The Middle East conflict begins to cast a shadow on the global economy
The conflict in the Middle East is already impacting critical global supply chains. In the absence of a clear resolution, uncertainty will continue to be the watchword for the global economy.
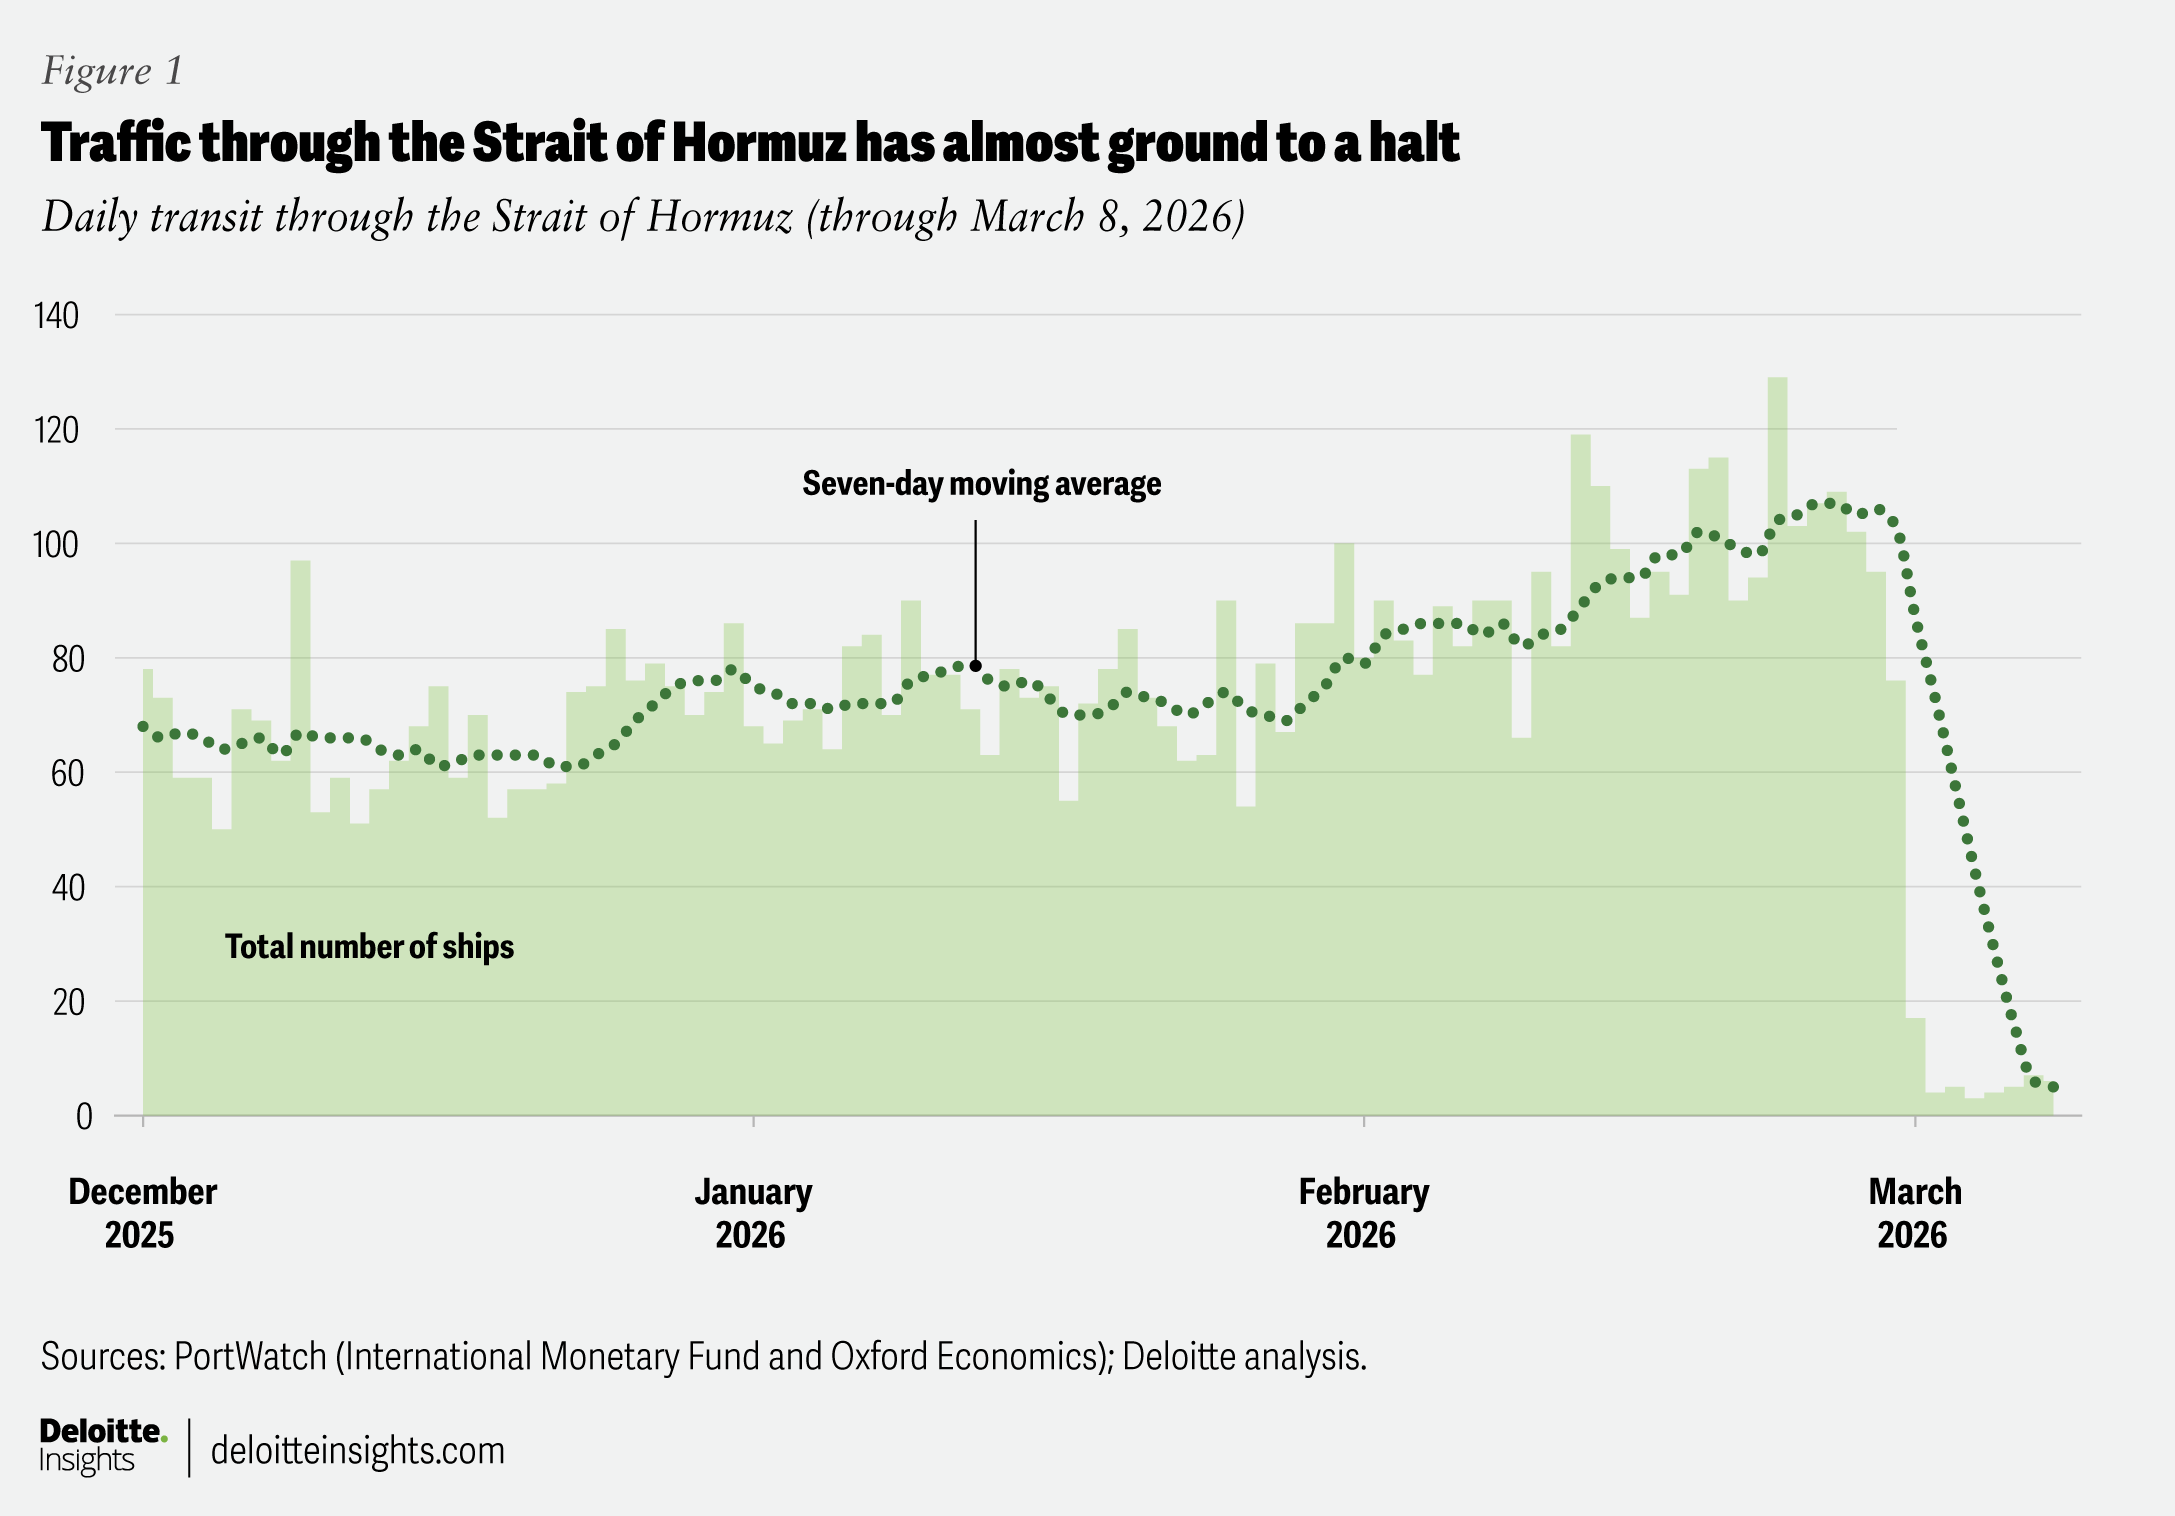
The Strait of Hormuz—a waterway just 29 nautical miles wide at its narrowest point—might give readers a mistaken impression of pristine shores, with ships silently slipping by uneventfully. But right now, it is embroiled in conflict. Nearly 20% of the oil and gas the world consumes passes through the strait—connecting hydrocarbon-rich nations of the Middle East to consumers in Asia and across the world.1 This critical artery of the global energy supply chain is now almost shut due to Iranian threats (figure 1), with some vessels even coming under attack while trying to sail through.2
Conflict has not only blocked oil, gas, and fertilizer exports from the Middle East but also merchandise goods that link major economies in the region to global supply chains. Maritime insurance premiums have also seen a steep rise.3 Parts of the Gulf have also experienced attacks on oil, gas, and other kinds of infrastructure—mostly with missiles and drones.4 An elongated conflict, therefore, may hit the global economy through multiple channels such as inflation, trade, aviation, and investment—raising uncertainty for consumers, businesses, and policymakers alike.
Critical oil, natural gas, and fertilizer supply chains disrupted by conflict
Around 20 million barrels per day (mbpd) of crude oil and petroleum products passed through the Strait of Hormuz in 2025.5 While alternate routes for oil exist (such as from Saudi Arabia through the Red Sea, and from the United Arab Emirates through Fujairah), their existing capacity is just about 3.5 mbpd to 5.5 mbpd—that too, with certain logistical constraints. This leaves roughly three-quarters of supplies blocked at the strait. Besides oil, 112 billion cubic meters of liquified natural gas from Qatar and the United Arab Emirates traveled through the strait in 2025. Unlike oil, however, there are no other routes for LNG exports from Qatar and the Emirates to countries outside the region.
As shipments stall, storage facilities are filling up fast. Consequently, several countries in the region have either currently shut down oil fields and refineries or reduced production.6 The reported attacks on ports and energy facilities have added to the problem. Qatar halted LNG production after a drone attack, while Saudi Arabia temporarily shut down its Ras Tanura refinery that came under attack.7 Similar incidents have forced refineries in Bahrain and Abu Dhabi to shut down, as well.8
The conflict also puts global agricultural output at risk. About 20% to 30% of global fertilizer exports pass through the Strait of Hormuz.9 Among these exports is urea, a nitrogenous fertilizer produced from LNG. As LNG plants shut down, urea production has been adversely impacted. Qatar has stopped production in its largest urea manufacturing plant.10 Shipping disruptions will also impact food supply to heavily import-reliant countries in the Middle East. For example, the six countries of the Gulf Cooperation Council11 import all of the sugar, 91% of vegetable oils, and 77% of the rice they consume (see “A soaring GCC hits turbulence”).12
Importers brace for higher prices and supply shortfall
The main jolt to the global economy will come from rising energy prices. As of March 12, 2026, Brent crude prices were up 39% from levels on the last trading day before the conflict (Feb. 27, 2026).13 Brent had even crossed US$110 per barrel in the period since then before declining. Natural gas and fertilizer prices have also increased during this period: Dutch TTF natural gas futures are up 59%, while Middle East granular urea futures have increased by 34%.14 Prices are unlikely to come down to pre-conflict levels any time soon without a credible end to hostilities—or at the least, a significant reopening of the Strait of Hormuz. Energy-price volatility15 is also expected to remain elevated, hence.
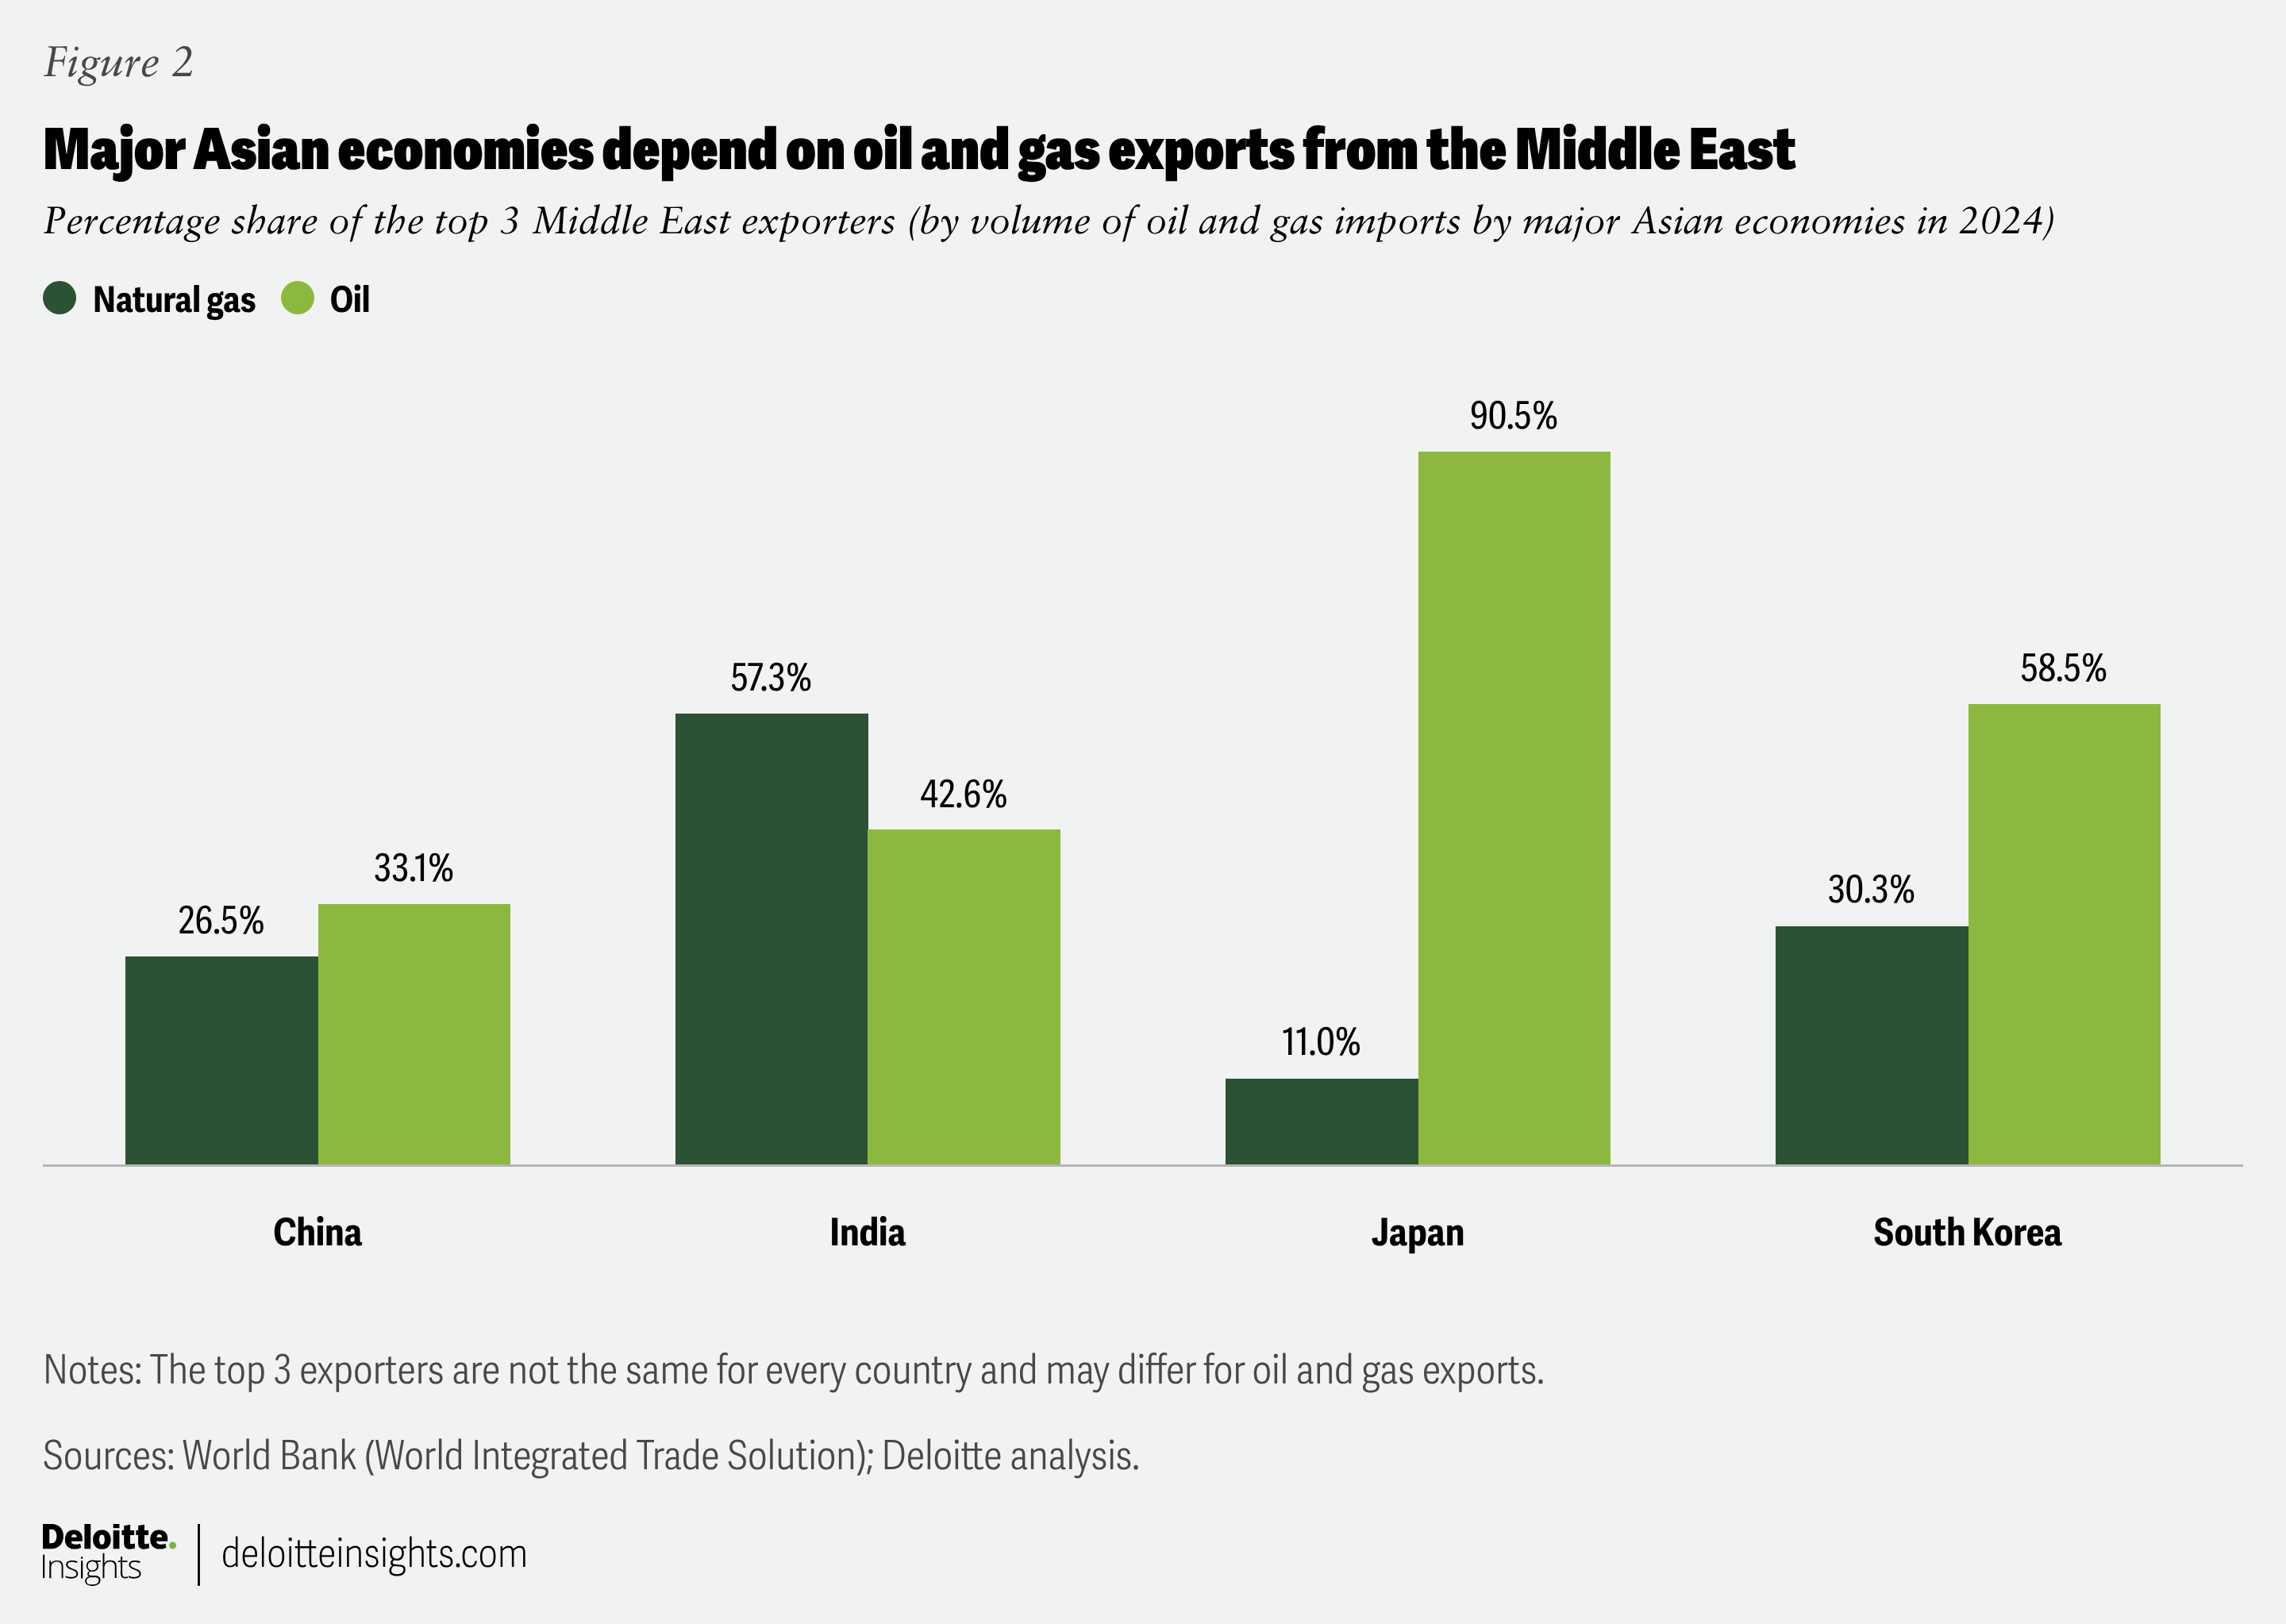
Most of the oil and gas moving through the Strait of Hormuz goes to Asia.16 In 2024, 90.5% of Japan’s total oil imports (by volume) came from just three Middle East nations—Saudi Arabia, the United Arab Emirates, and Kuwait (figure 2).17 Similarly, supplies from Qatar that year made up 40.7% of India’s natural gas imports.18 The European Union has also emerged as a major client since it cut down relations with Russia after the start of the Russia-Ukraine war in 2022. About 10% of LNG from Qatar and the Emirates transiting through the Strait of Hormuz was destined for the European Union.19
With oil and gas supply chains from the Middle East facing significant disruption, importers are scouting for other options. Yet, for other oil and gas producers like the United States, raising output to meet the sudden demand isn’t easy—and importers might have to pay higher prices.20 For the European Union, Russia isn’t an option due to existing sanctions—and the bloc needs to stock up on gas reserves for the winter. China may step up purchases of Russian oil and gas (as it has been doing the last few years), while India got a 30-day sanction waiver to buy Russian oil.21 Asian nations, however, might face increased transportation costs if supply chains shift from the Middle East to the Americas.
Rising energy prices and supply constraints may dent production of nonessential goods and services. India has directed its refineries to prioritize households for supplying liquefied petroleum gas rather than commercial establishments.22 Pakistan, Egypt, and Vietnam have raised fuel prices and launched energy-saving measures.23 In addition, the disruption to fertilizer output comes at a time when the crop-planting season in set to start in Asia and North America. This will add to the challenges faced by policymakers, including central bankers, who dealt with similar oil and food pressures in 2022 after Russia’s invasion of Ukraine.24
A soaring GCC hits turbulence
The economic boom in the Gulf Cooperation Council (GCC) is not just a tale of hydrocarbons: With a combined nominal economic value (in gross domestic product terms) of US$2.4 trillion,25 the region is home to aviation, tourism, and business hubs. In aviation, it includes carriers like Emirates, Qatar Airways, and Etihad. The region’s airports serve as the conduit for people traveling between Asia and the West. In 2025, Dubai International alone handled 95.2 million passengers—the world’s highest international passenger traffic.26 Hamad International Airport in Doha, Qatar, followed with 54.3 million passengers,27 while Abu Dhabi’s Zayed International Airport handled 32.5 million passengers.28
Aviation combines seamlessly with business and leisure travel in the region. In Dubai, for example, there were 19.6 million overnight visitors in 2025,29 while Saudi Arabia hosted about 1.7 million foreign pilgrims.30
The GCC’s business hubs attract talent and capital from across the world into a range of nonhydrocarbon sectors, including technology, banking and finance, and real estate. In 2024, the six-member bloc accounted for 38% of total foreign direct investment into the Middle East and North Africa.31 Trade is the GCC’s other major strength, with large ports facilitating oil and gas supplies and reexports to the rest of the world. The six biggest ports in the region have a combined capacity of close to 54 million twenty-foot equivalent units of cargo.32
The conflict in the Middle East, which has spilled on to the GCC’s shores, threatens its economic and business environment.
Risks to the US economy have also increased
A prolonged conflict in Iran could have implications for the US economy over time. Here’s what to potentially expect:
- More impact for low-income households. While oil shocks impact the US economy less nowadays than in the 1970s, inflation levels are still not immune.33 Economic research by the US Federal Reserve shows that a US$45 rise per barrel in oil prices (due to the war in Ukraine) in 2022 pushed annual inflation levels up by 0.5 percentage points—with the impact easing since the initial uptick in monthly prices.34
Even a small increase in inflation could add to existing price pressures on utilities, certain food items, and household durables.35 Durables inflation surged to a three-year high of 2.1% in December 2025. Utility prices were up 6.7% from a year before, and inflation in food and beef was in double digits.
Rising inflation, therefore, generally impacts low-income households the most. On average, the bottom 20% of households (by income) spent 88% of their pretax income on just three items: food at home, utilities (electricity and natural gas), and housing.36 These households also face a higher debt burden, especially credit-card debt, as their incomes cannot keep up with their expenses.37 Indeed, Deloitte’s ConsumerSignals study indicates that lower- and middle-income brackets—which comprise nearly 60% of all American consumers—report no meaningful improvement in their financial position over the past three years, and are not better off than they were three years back.38
- Roadblocks for the much-vaunted ‘wealth effect.’ High-income households have been driving much of the growth in overall US consumer spending. According to the economic heterogeneity indicators used by the Federal Reserve Bank of New York, real consumer spending has grown since 2023 for high-income households, but has remained flat for middle-income households and declined for low-income ones (albeit with variations).39 This is also evident from the US Fed’s January 2026 Beige Book.40
What’s driving this spending surge? Research by Gamber and others indicates that rising asset prices—also called the “wealth effect”—have been a key driver of increasing consumption by high-income households over the past five years.41 In 2025, for example, the top 20% of income earners accounted for 80.1% of total growth in net economic value—and this share has gone up in the last three years.42
A prolonged conflict in Iran may render the economy vulnerable to asset-price shocks similar to those seen after the outbreak of war in Ukraine and the subsequent tightening of monetary policy in 2022: By the third quarter of 2022, total net worth of the top 20% of income earners had declined by 8.4% compared with end-2021.43
- The US federal deficit may increase. US federal government debt rose to US$38.8 trillion in February.44 As debt rises, so do interest payments. In 2025, net interest payments were a little less than US$1 trillion—the third-largest government outlay after Medicare (US$1.02 trillion) and Social Security (US$1.6 trillion).45 The federal deficit, at 5.4% of GDP, is also high compared to a major part of the pre-pandemic decade.46 Addressing this fiscal gap may become more challenging if the conflict in Iran persists. The Center for Strategic and International Studies estimates the cost of the first 100 hours of the conflict to be US$3.7 billion, most of which hasn’t been budgeted.47
Ten-year Treasury yields have also risen since the start of the conflict (by 31 basis points as on March 12, 2026).48 If the conflict persists, debt and deficit levels may rise further. This also comes at a time when there is ongoing uncertainty about future tariff revenues after the Supreme Court held that the International Emergency Economic Powers Act does not authorize presidents to impose tariffs. Due to tariff revenues, federal receipts from customs duties surged 235% in 2025 to US$264 billion.49 While the government has announced new tariffs of 10% under Section 122 of the Trade Act of 1974, those are set to expire within 150 days of announcement.50
- Challenges ahead for the Fed. Any increase in inflation, however small or temporary, due to elevated oil prices, could complicate the Fed’s efforts to ease monetary policy—especially at a time when the labor market is weakening. In February, nonfarm payrolls fell by 92,000 and the unemployment rate edged up to 4.4%.51 Other than health care and social assistance, and to a lesser extent, leisure and hospitality, payrolls have been either flat or declined over the past year for all other sectors.52
Any deterioration in fiscal balances due to conflict-related expenses will likely also add to the Fed’s worries. Long-term borrowing costs in the economy are often tied to 10-year Treasury yields. And if yields rise, interest rates like the 30-year mortgage rate may edge up.53 The Fed may be able to suppress long-term yields through quantitative easing. But that will add to the Fed’s large balance sheet and its high level of US Treasury holdings,54 which may not align with the views of the new Fed chair who takes over in May 2026.55
- But a few sectors may benefit. As Middle East exports of oil and gas face significant disruption, countries in Asia and Europe will turn to other producers like the United States. Since the start of the war in Ukraine, the European Union has reduced its dependency on Russian oil and gas. The United States now accounts for about 60% of total LNG imports into Europe—up from 24.1% in the first quarter of 2021.56 India too has been ramping up purchases of American LNG, which accounted for about 20% of India’s total LNG imports in 2024.57 The European Union, India, and energy-deficient Asian nations like Japan and South Korea will likely be eager to increase LNG purchases from the United States, which has flexible capacity.58
In Europe, there has been a conscious effort to raise defense spending since the start of the Russia-Ukraine conflict, although European economies will also be eager to shore up domestic manufacturing.59 The conflict in Iran will likely add to that effort. GCC countries may be looking to replenish and upgrade their stocks of American air defense equipment.60 But for all those potential benefits for US energy and defense companies, other manufacturers will likely see production costs rise if oil and gas prices continue to climb, especially as they continue to deal with US tariff–related uncertainty.
Uncertainty is the watchword for now
Although the world’s supply chains are diversified, it may not be enough to fully absorb the pressures arising from the Middle East conflict. The global economy had to weather a similar shock in 2022 when the Russia-Ukraine war broke out, contributing to elevated inflation across many economies. That conflict, however, still continues.
So, the conflict in the Middle East, which has significantly disrupted oil and gas exports from the region, could create challenges for many economies. There are other parts of the global economy that may also be affected, such as artificial intelligence investments and infrastructure in GCC nations, given recent attacks on their data centers.61 It’s still early days, and a de-escalation remains possible. But until that happens, uncertainty is likely to persist.
Continue the conversation
Meet the industry leader
Ira Kalish
by
Akrur Barua
The author would like to thank Ira Kalish, chief Global economist at Deloitte, for his valuable review and inputs, and Ruhika Agarwal and Rohini Sanyal, from the Economics team for their support toward the research for this article. From the Deloitte Insights team, the author would like to thank Arpan Kr. Saha and Sayanika Bordoloi for editorial and production support, and Harry Wedel and Jim Slatton for the art on this piece.
Editorial (including production and copyediting): Arpan Kumar Saha and Sayanika Bordoloi
Design: Jim Slatton and Harry Wedel
Audience development: Maria Martin Cirujano
Cover image by: Harry Wedel
Knowledge services: Vanapalli Viswa Teja
Visit the Deloitte Global Economics Research Center
Access more insights for the consumer spending, housing, business investment, globalization & international trade, fiscal & monetary policy, sustainability, equity, & climate, labor markets and prices & inflation sectors.