The Fed’s rate path may turn out to be an uneven one
The October 2025 Economics Insider analyzes factors likely to drive US monetary policy in the near and medium term
As the Federal Open Market Committee (FOMC) met on September 16 and 17, a rate cut was always on the cards. Job growth had slowed sharply, with nonfarm payrolls rising by just 27,000 per month on average since May.1 Inflation was edging up, especially for durable goods, with tariffs making their way slowly into consumer prices.2 Pressure from the federal government to ease monetary policy has also been rising along with calls for changes in the Federal Reserve (Fed) itself.3
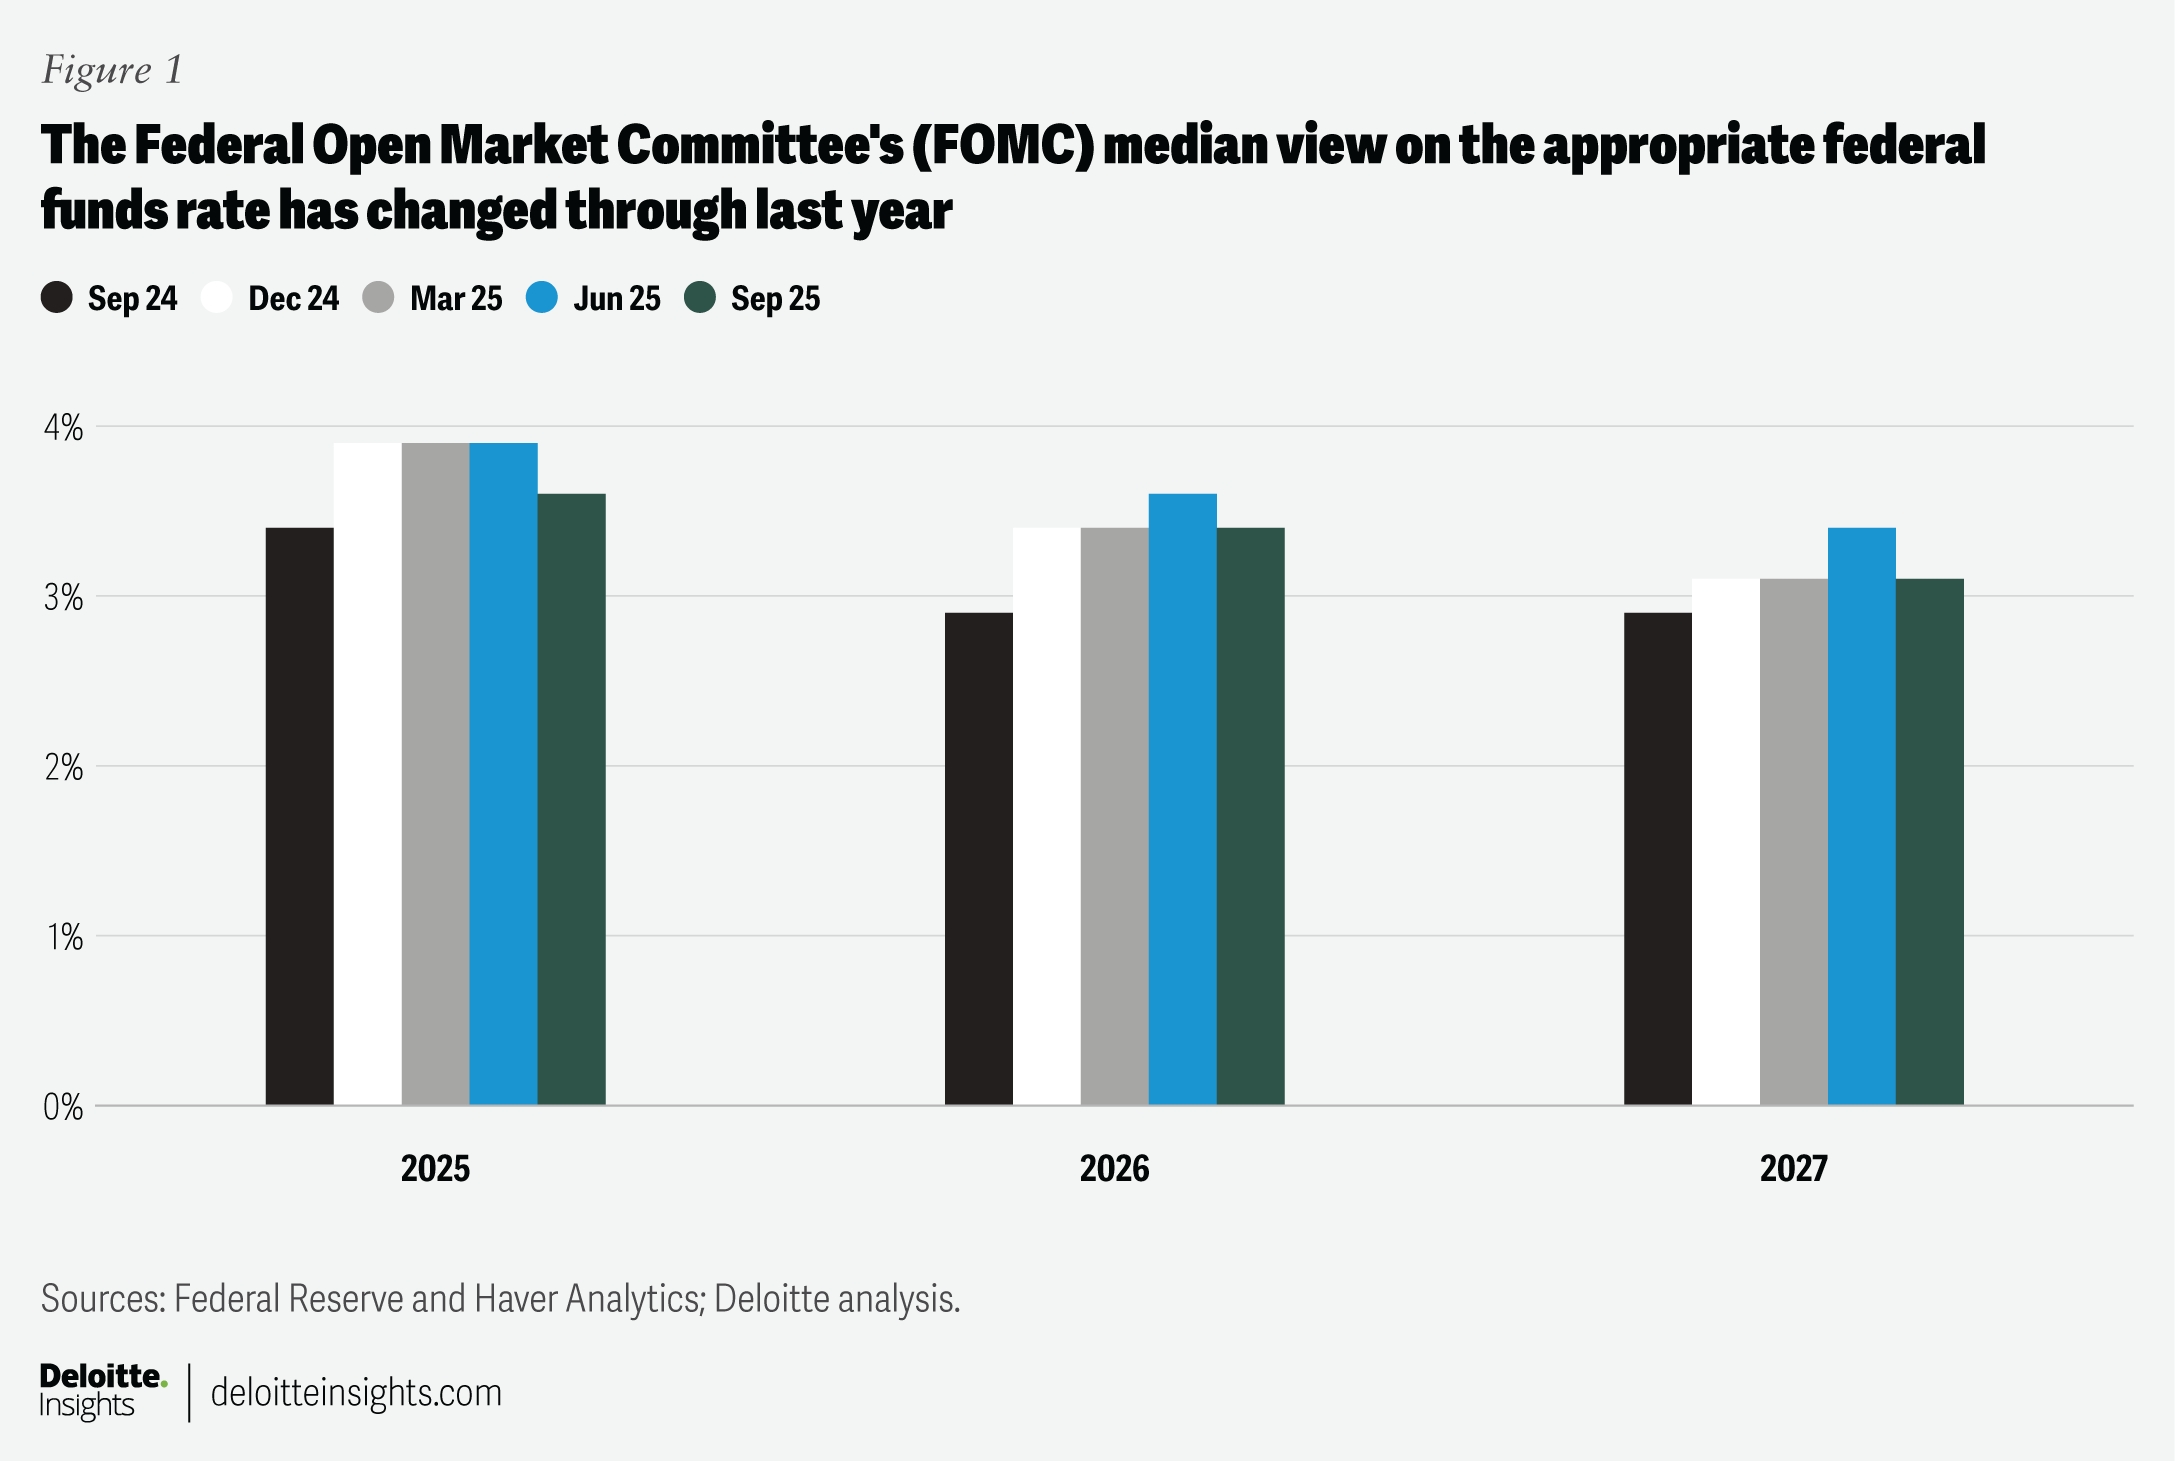
What matters more than one rate cut decision, however, is the future path of monetary policy decisions. Indeed, the FOMC’s median views have changed over the past year.4 The committee now expects 75 basis points (bps) worth of rate cuts this year—higher than 50 bps of cuts expected in the previous quarter—as it shifts focus from inflation concerns to tackle a weakening labor market (figure 1).
It is, however, too early to expect the Fed to stick to its easing path. First, importers and producers haven’t passed on increased tariff costs entirely to consumers. Second, a final tariff framework is yet to emerge. Finally, the FOMC assumes that any easing amid rising inflation risks can cause inflation expectations and, therefore, actual inflation to get out of control.
The inflation trajectory is still unclear
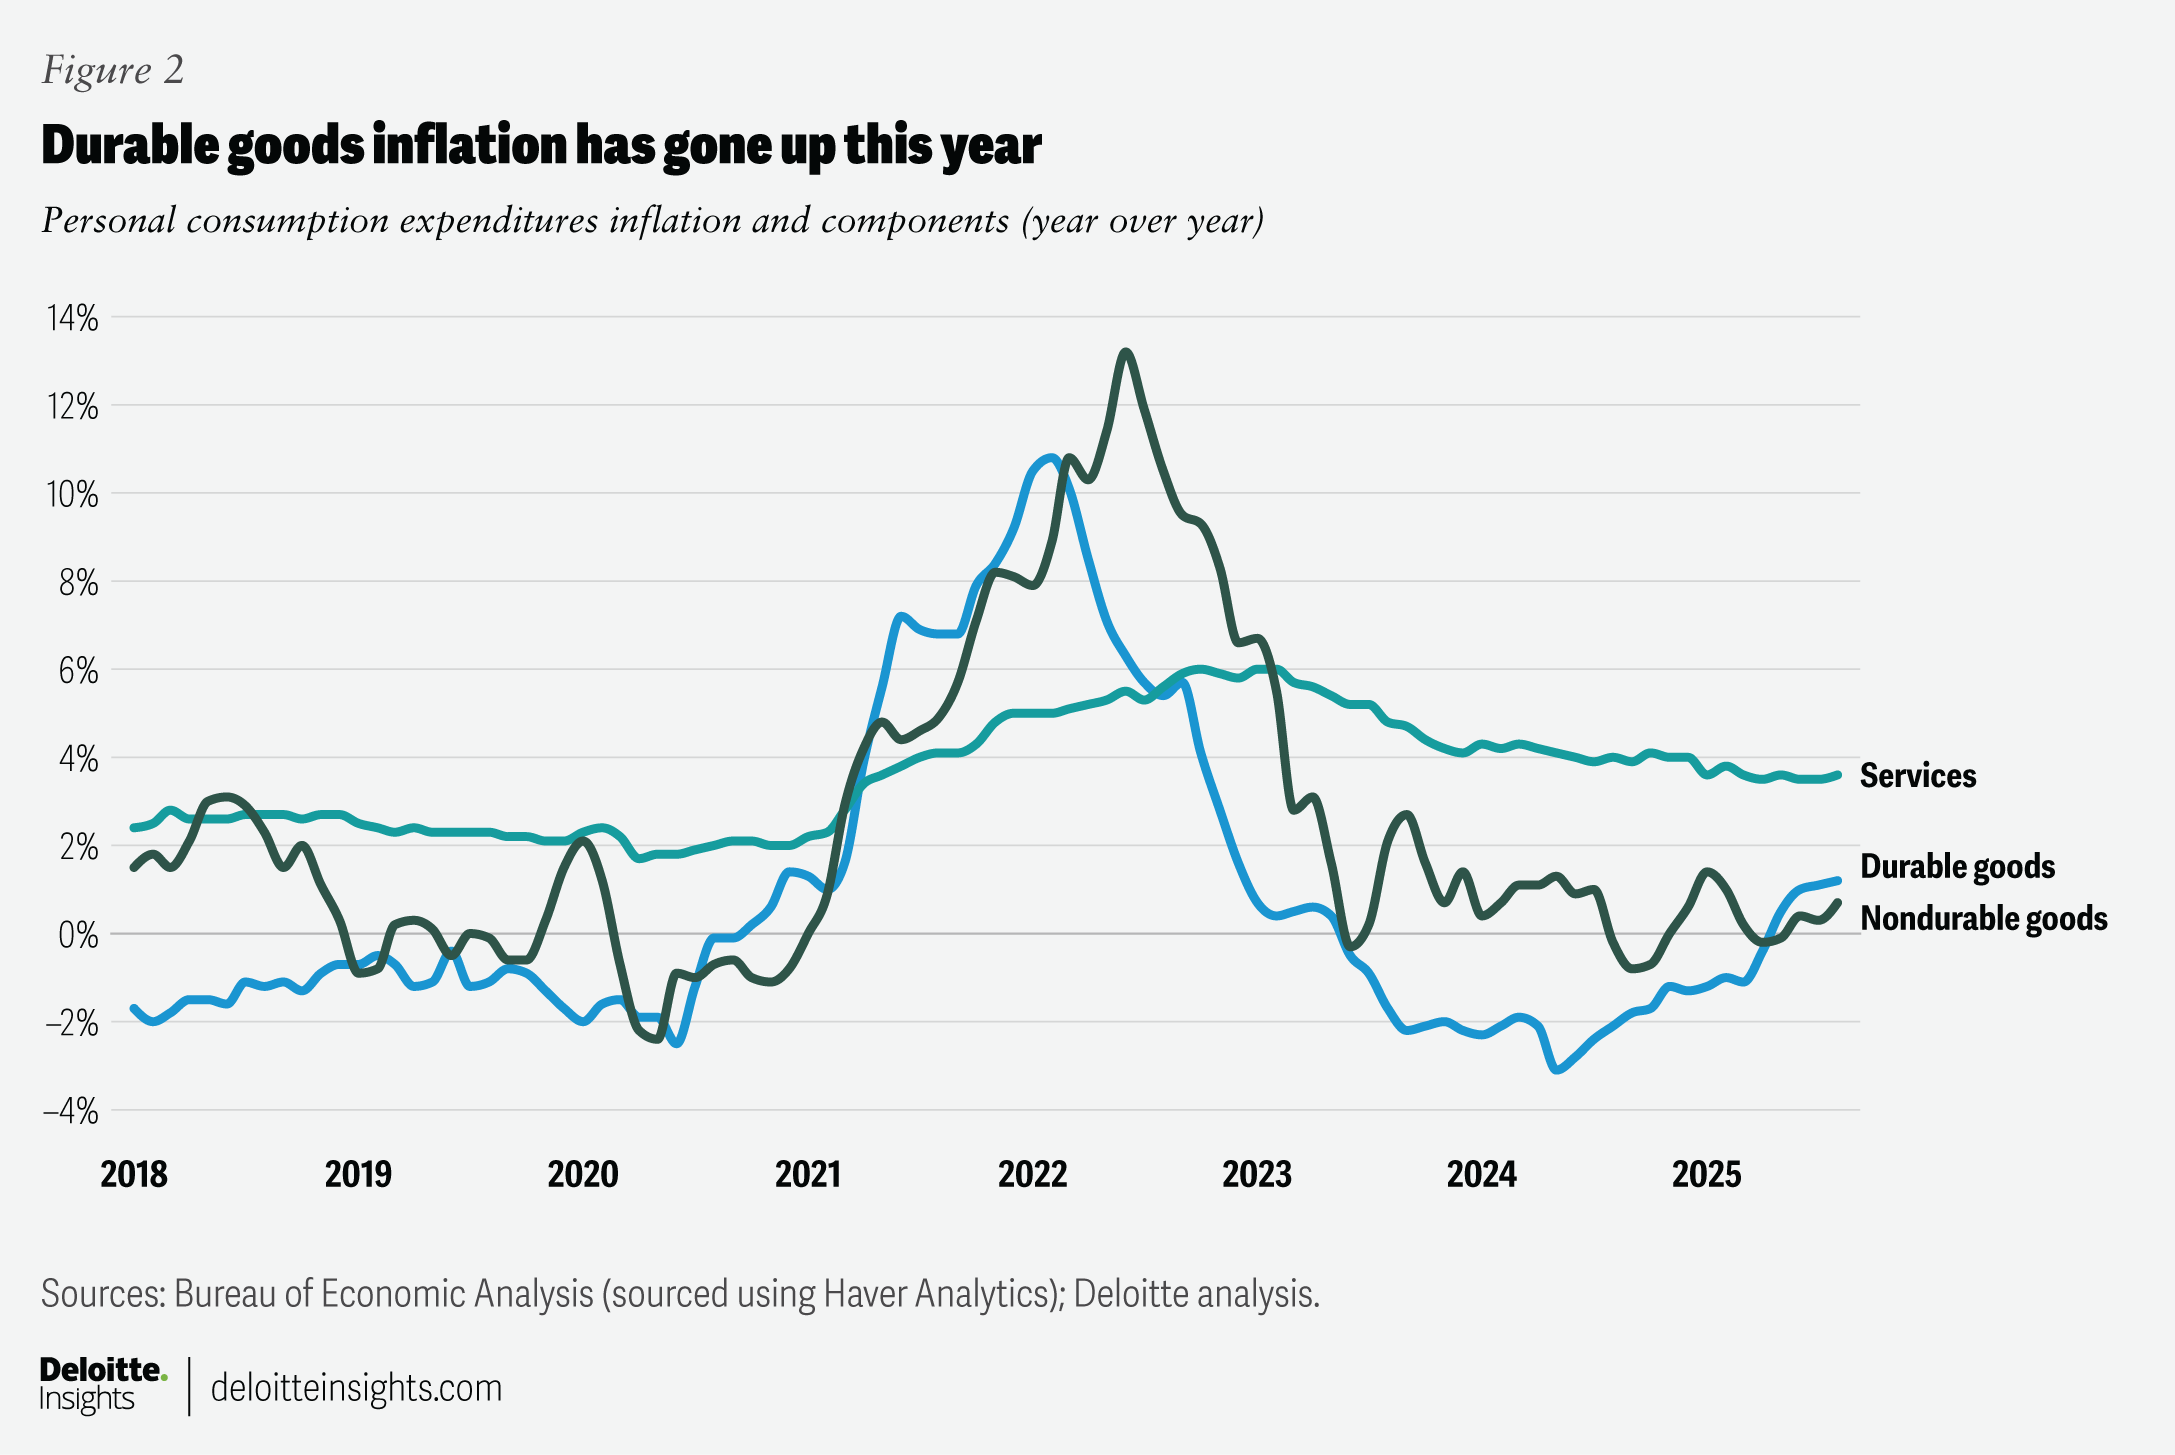
The Fed has been cautioning against the possible impact of tariffs on inflation for quite some time.5 Personal consumption expenditure (PCE) inflation—the Fed’s preferred inflation gauge—has been edging up since April.6 Durable goods inflation has been the most impacted by tariffs, and at 1.2% in August, the figure was the highest seen since December 2022. Inflation for services also remains higher than before the pandemic. (figure 2). Core PCE inflation, which excludes food and energy, was 2.9% in August, still far above the Fed’s 2% target.
There are four key reasons why this uptick in inflation may continue.
- Businesses appear to be drawing down pre-tariff inventory, and hence, consumers are not yet facing the full impact of tariff hikes. In the first quarter of 2025, real nonfarm inventories rose by US$164.1 billion—the largest increase in three years—as businesses stocked up on imported goods before high tariffs kicked in.7 As these stocks deplete over the next few months, businesses will face higher tariffs for replenishing their inventories. They will likely pass on some of this increased cost to consumers, leading to higher inflation.
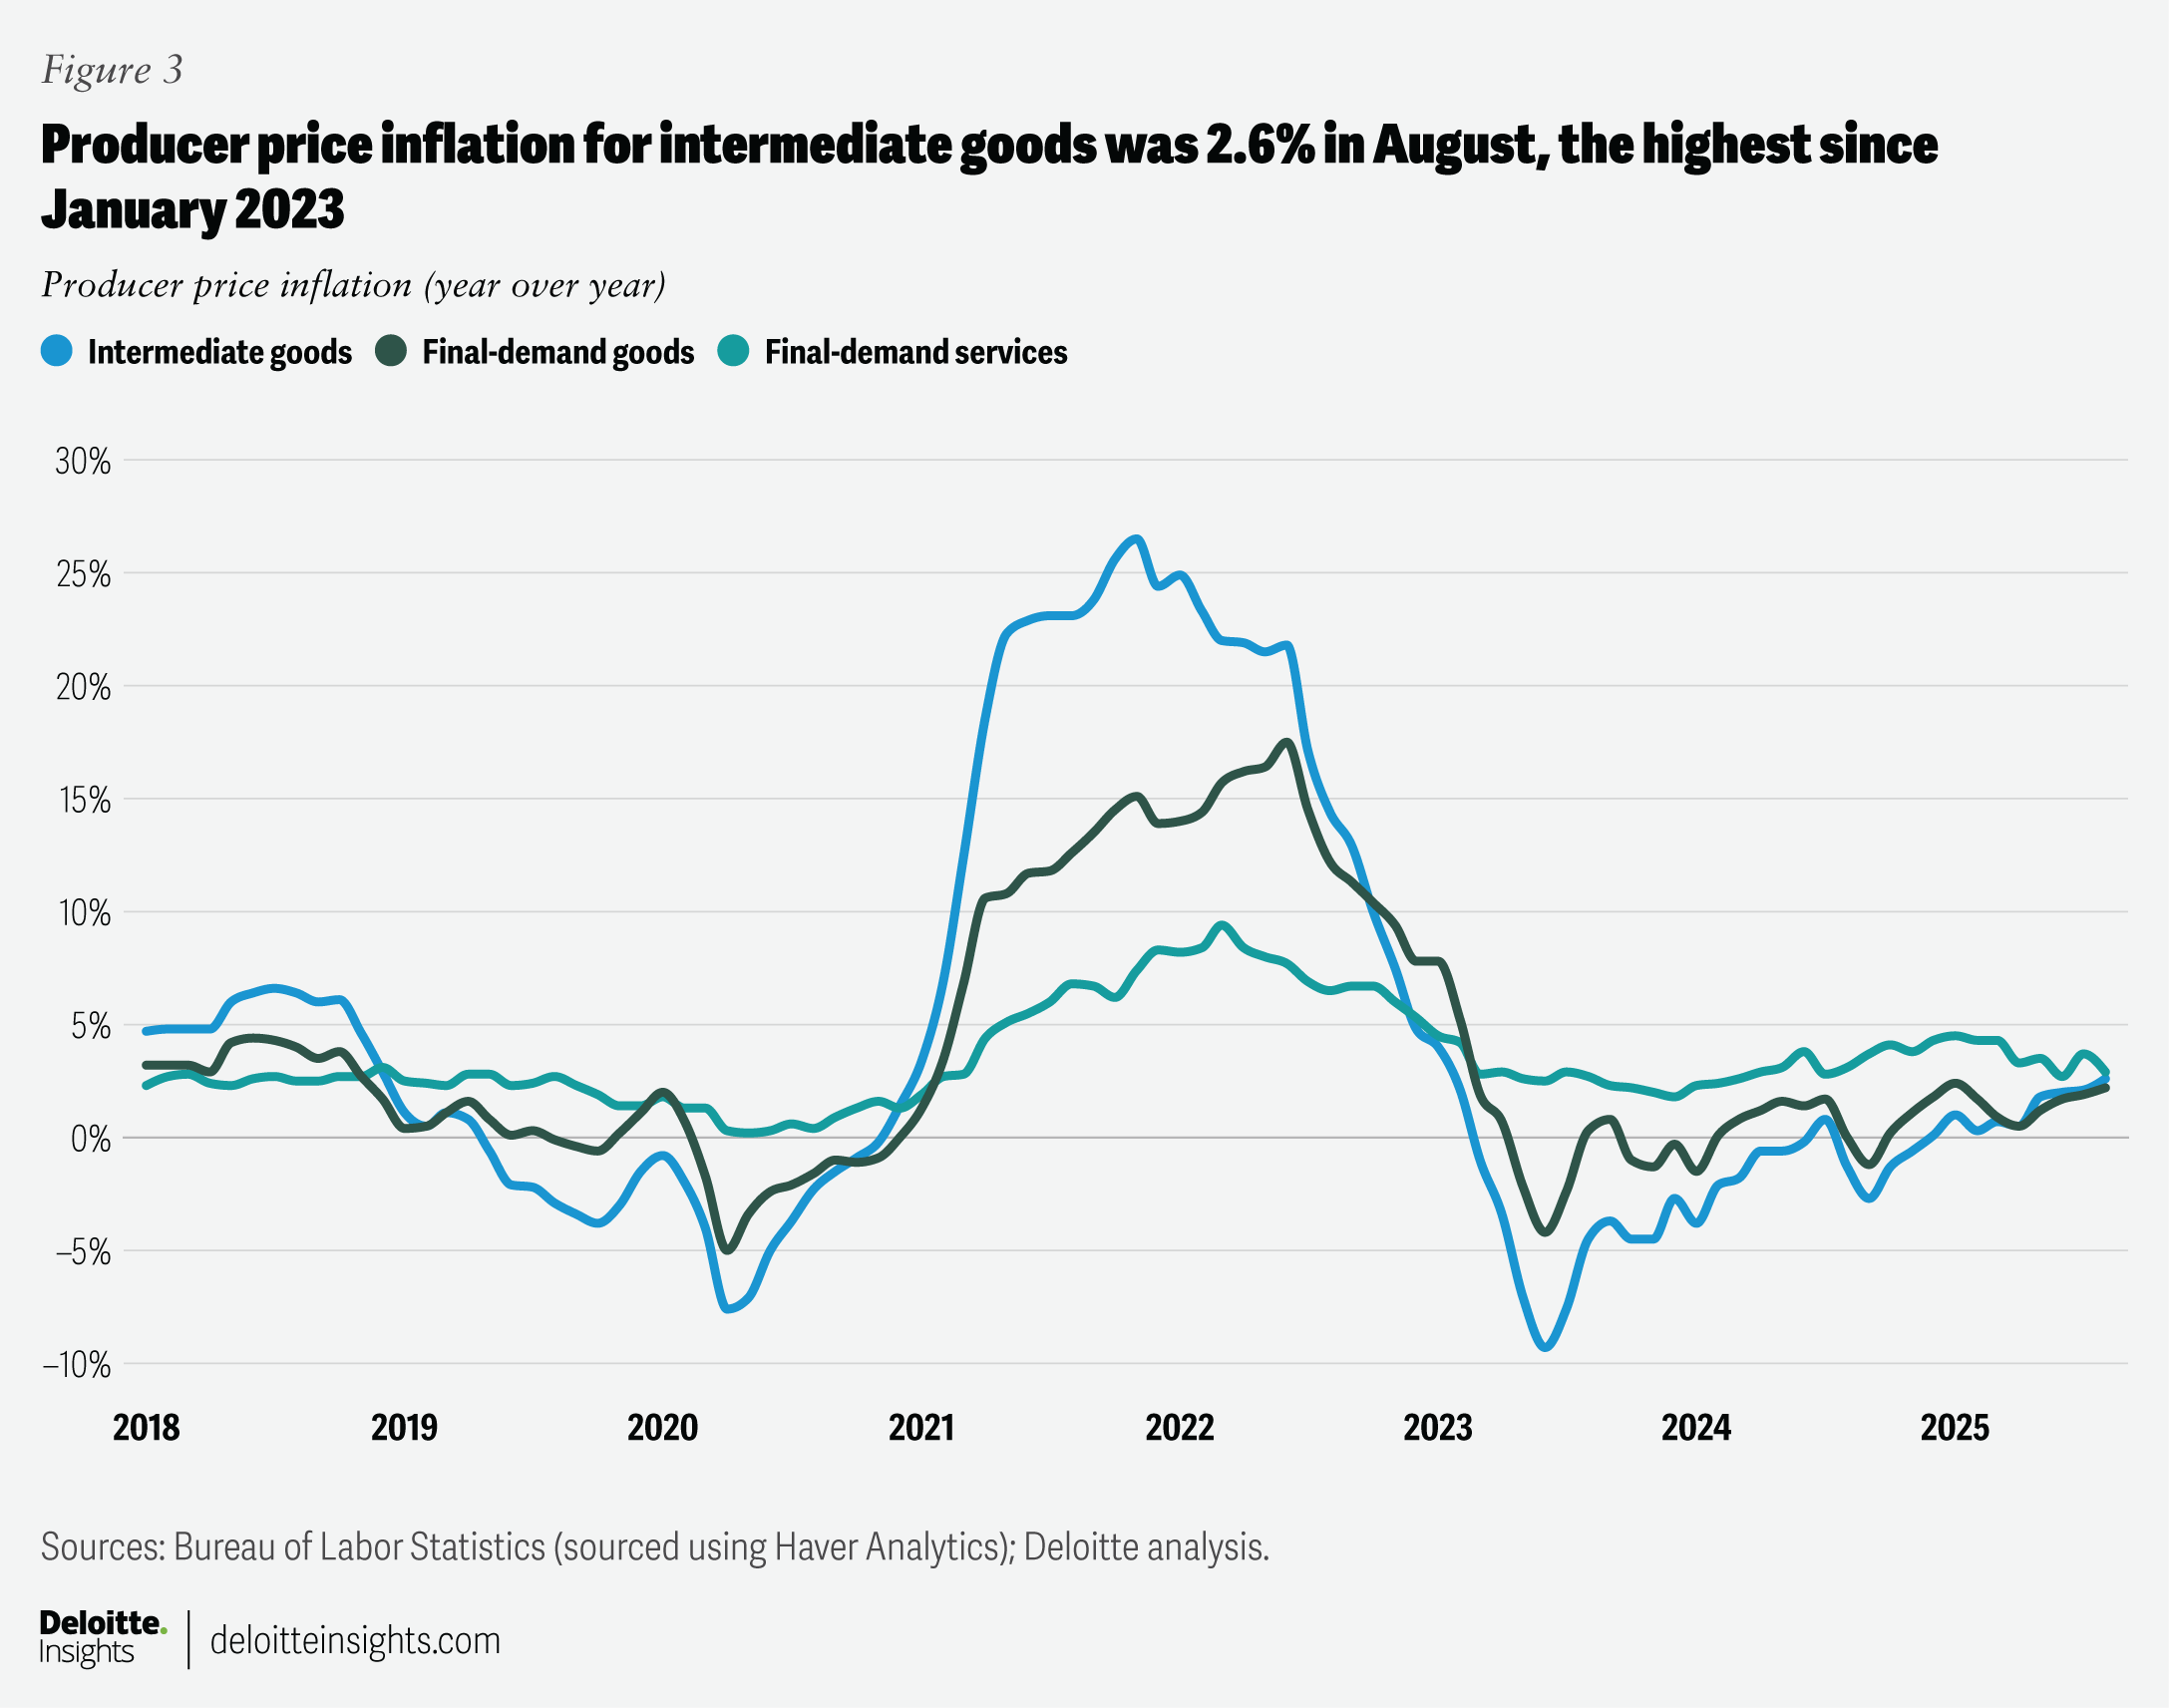
- Producer price inflation for final demand goods and for intermediate goods have been going up steadily since April (figure 3).8 Currently, not all these cost increases are finding their way into consumer prices. For example, while producer prices for final-demand goods are up 1.2% since April, the PCE price index for goods is up by only 0.5%. Without passing on more of these higher tariff-related costs to consumers, businesses will find it hard to defend their profit margins. Overall, Deloitte economists, at their lower end of estimates, expect that 60% of tariff costs will be passed on to consumers.9
- Producers and consumers are still waiting for a final tariff framework to emerge. The United States is yet to sign trade deals with China and India, while the United States-Mexico-Canada Agreement is up for renegotiation next year. In addition to country-level tariffs, there are ones on products such as semiconductors that may be on the anvil.10 For now, estimates by the Yale Budget Lab put the US average effective tariff rate at about 17.9%, a sharp jump from the 2.5% rate at the end of 2024.11
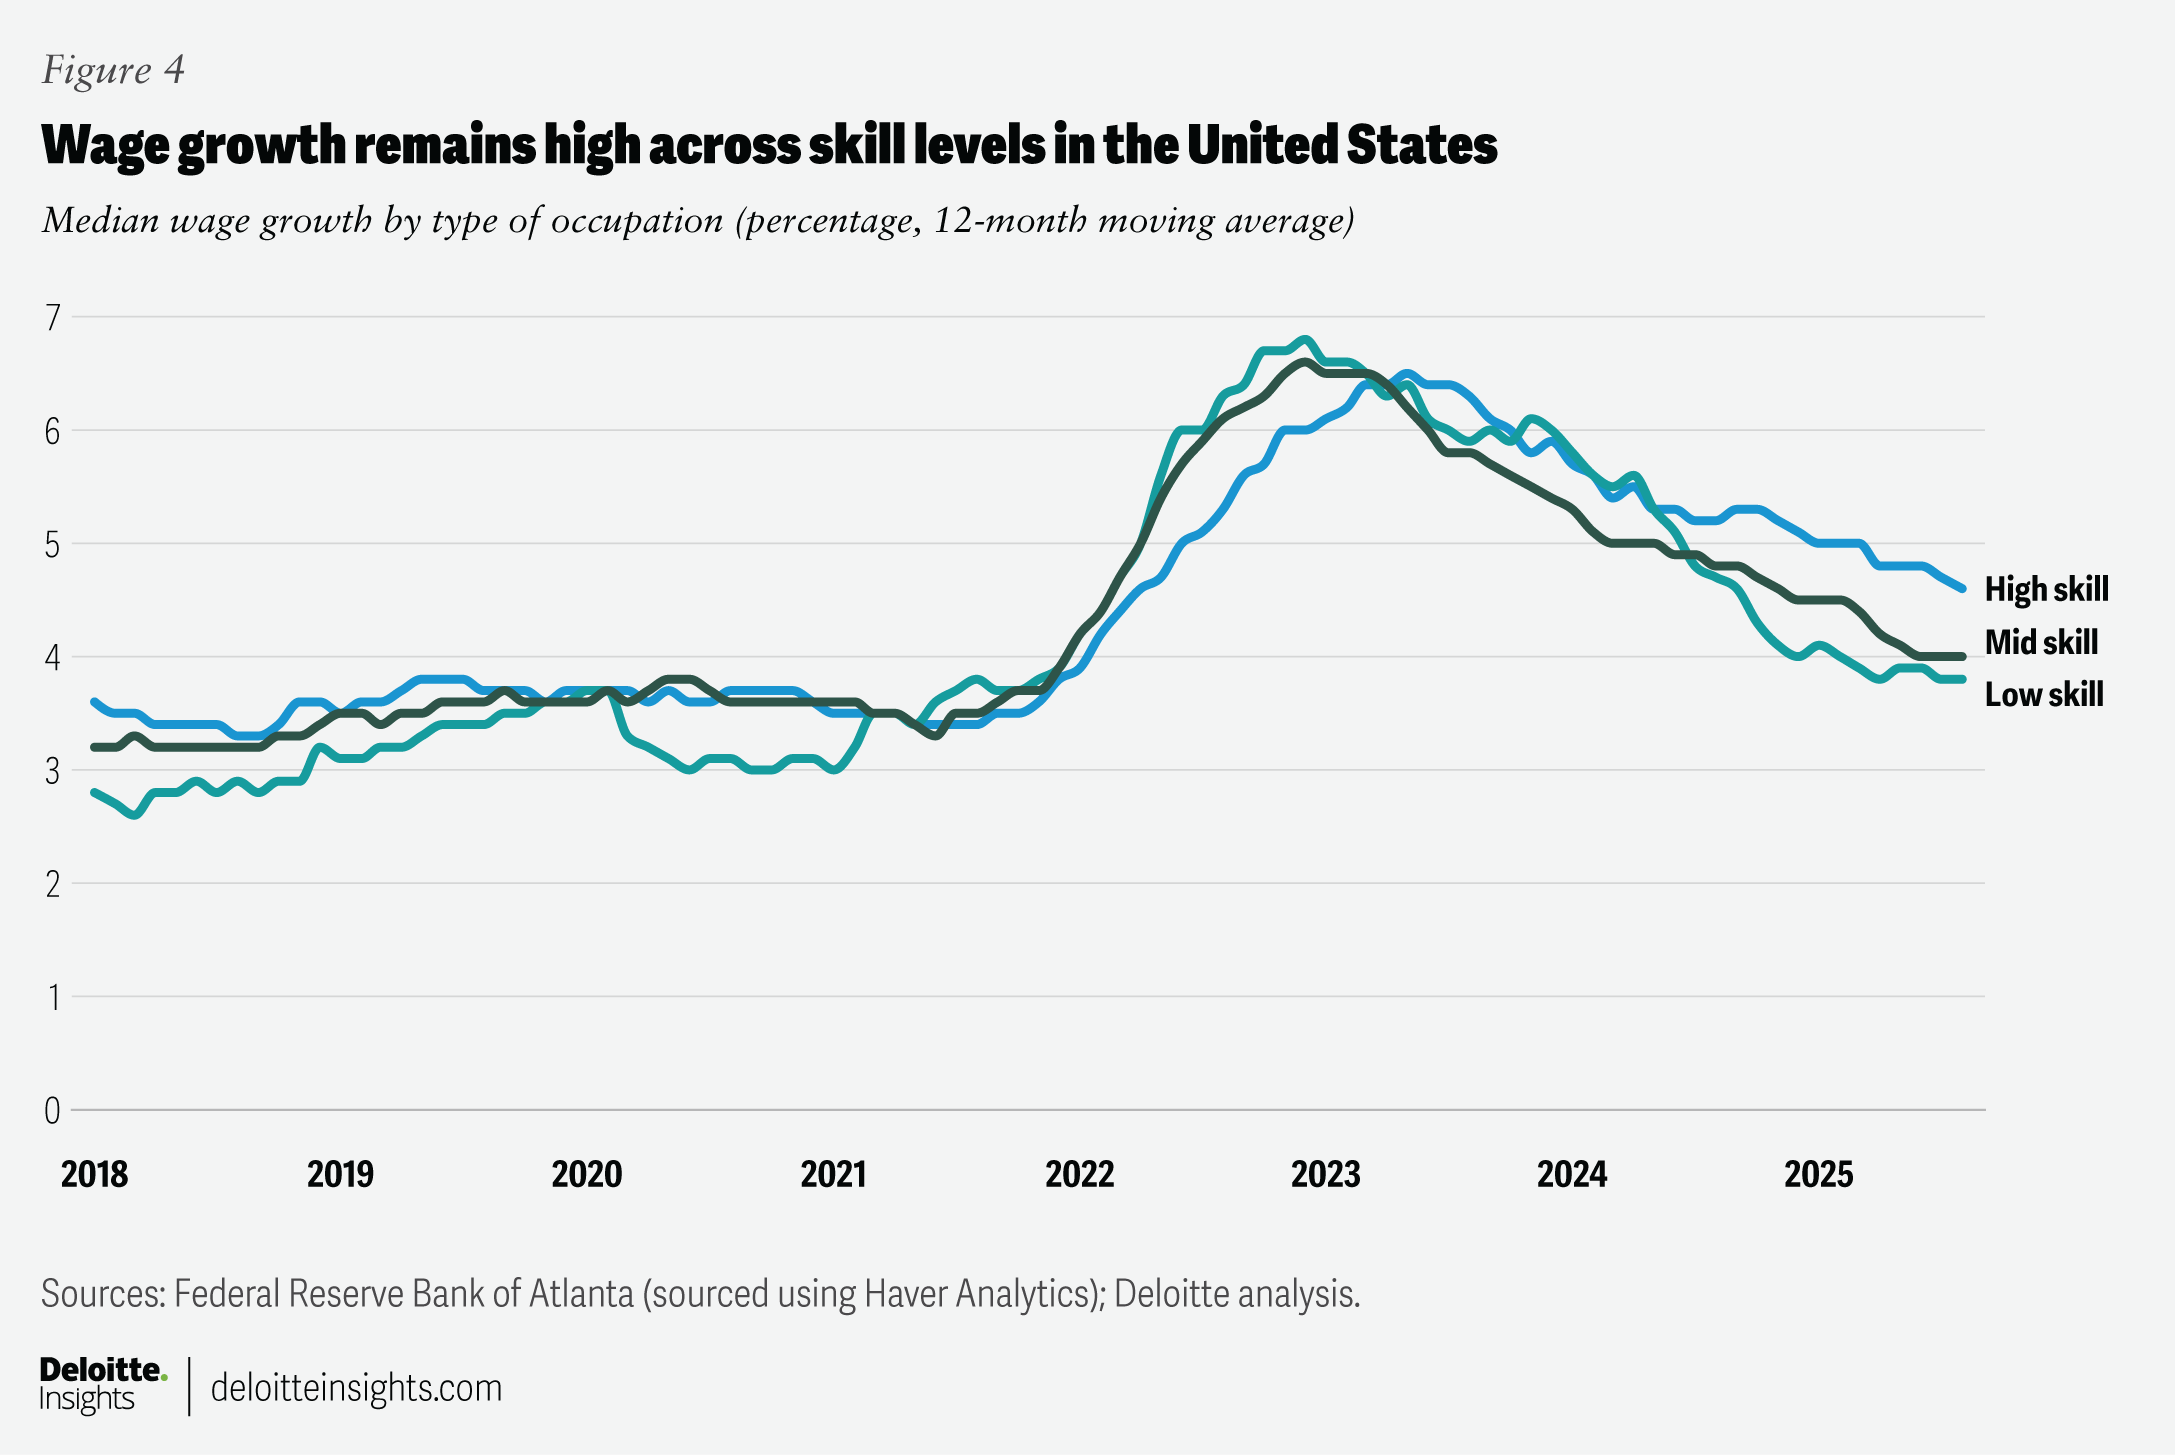
- Just as tariffs are shaking up supply chains, American producers also face headwinds from immigration restrictions. This is likely to dent labor supply growth in the farming, retail, food services, hospitality, and construction sectors. High-skill labor supply, especially in tech, will also be affected due to new restrictions on H-1B visas.12 While large companies may be able to pay the US$100,000 fee for new H-1B applicants, smaller companies, including startups, may suffer. Overall, these restrictions will weigh on labor force growth, and hence, keep wage growth elevated. This is likely playing out with growth in average hourly earnings, which is still higher than pre-pandemic times despite slowing job growth.13 Wage growth has been high across skill levels (figure 4).14
Tariffs and immigration will influence the Fed’s rate path
The degree and pace of tariffs and immigration flows will likely shape the course of inflation and the labor market, thereby influencing monetary policy over the next five years.
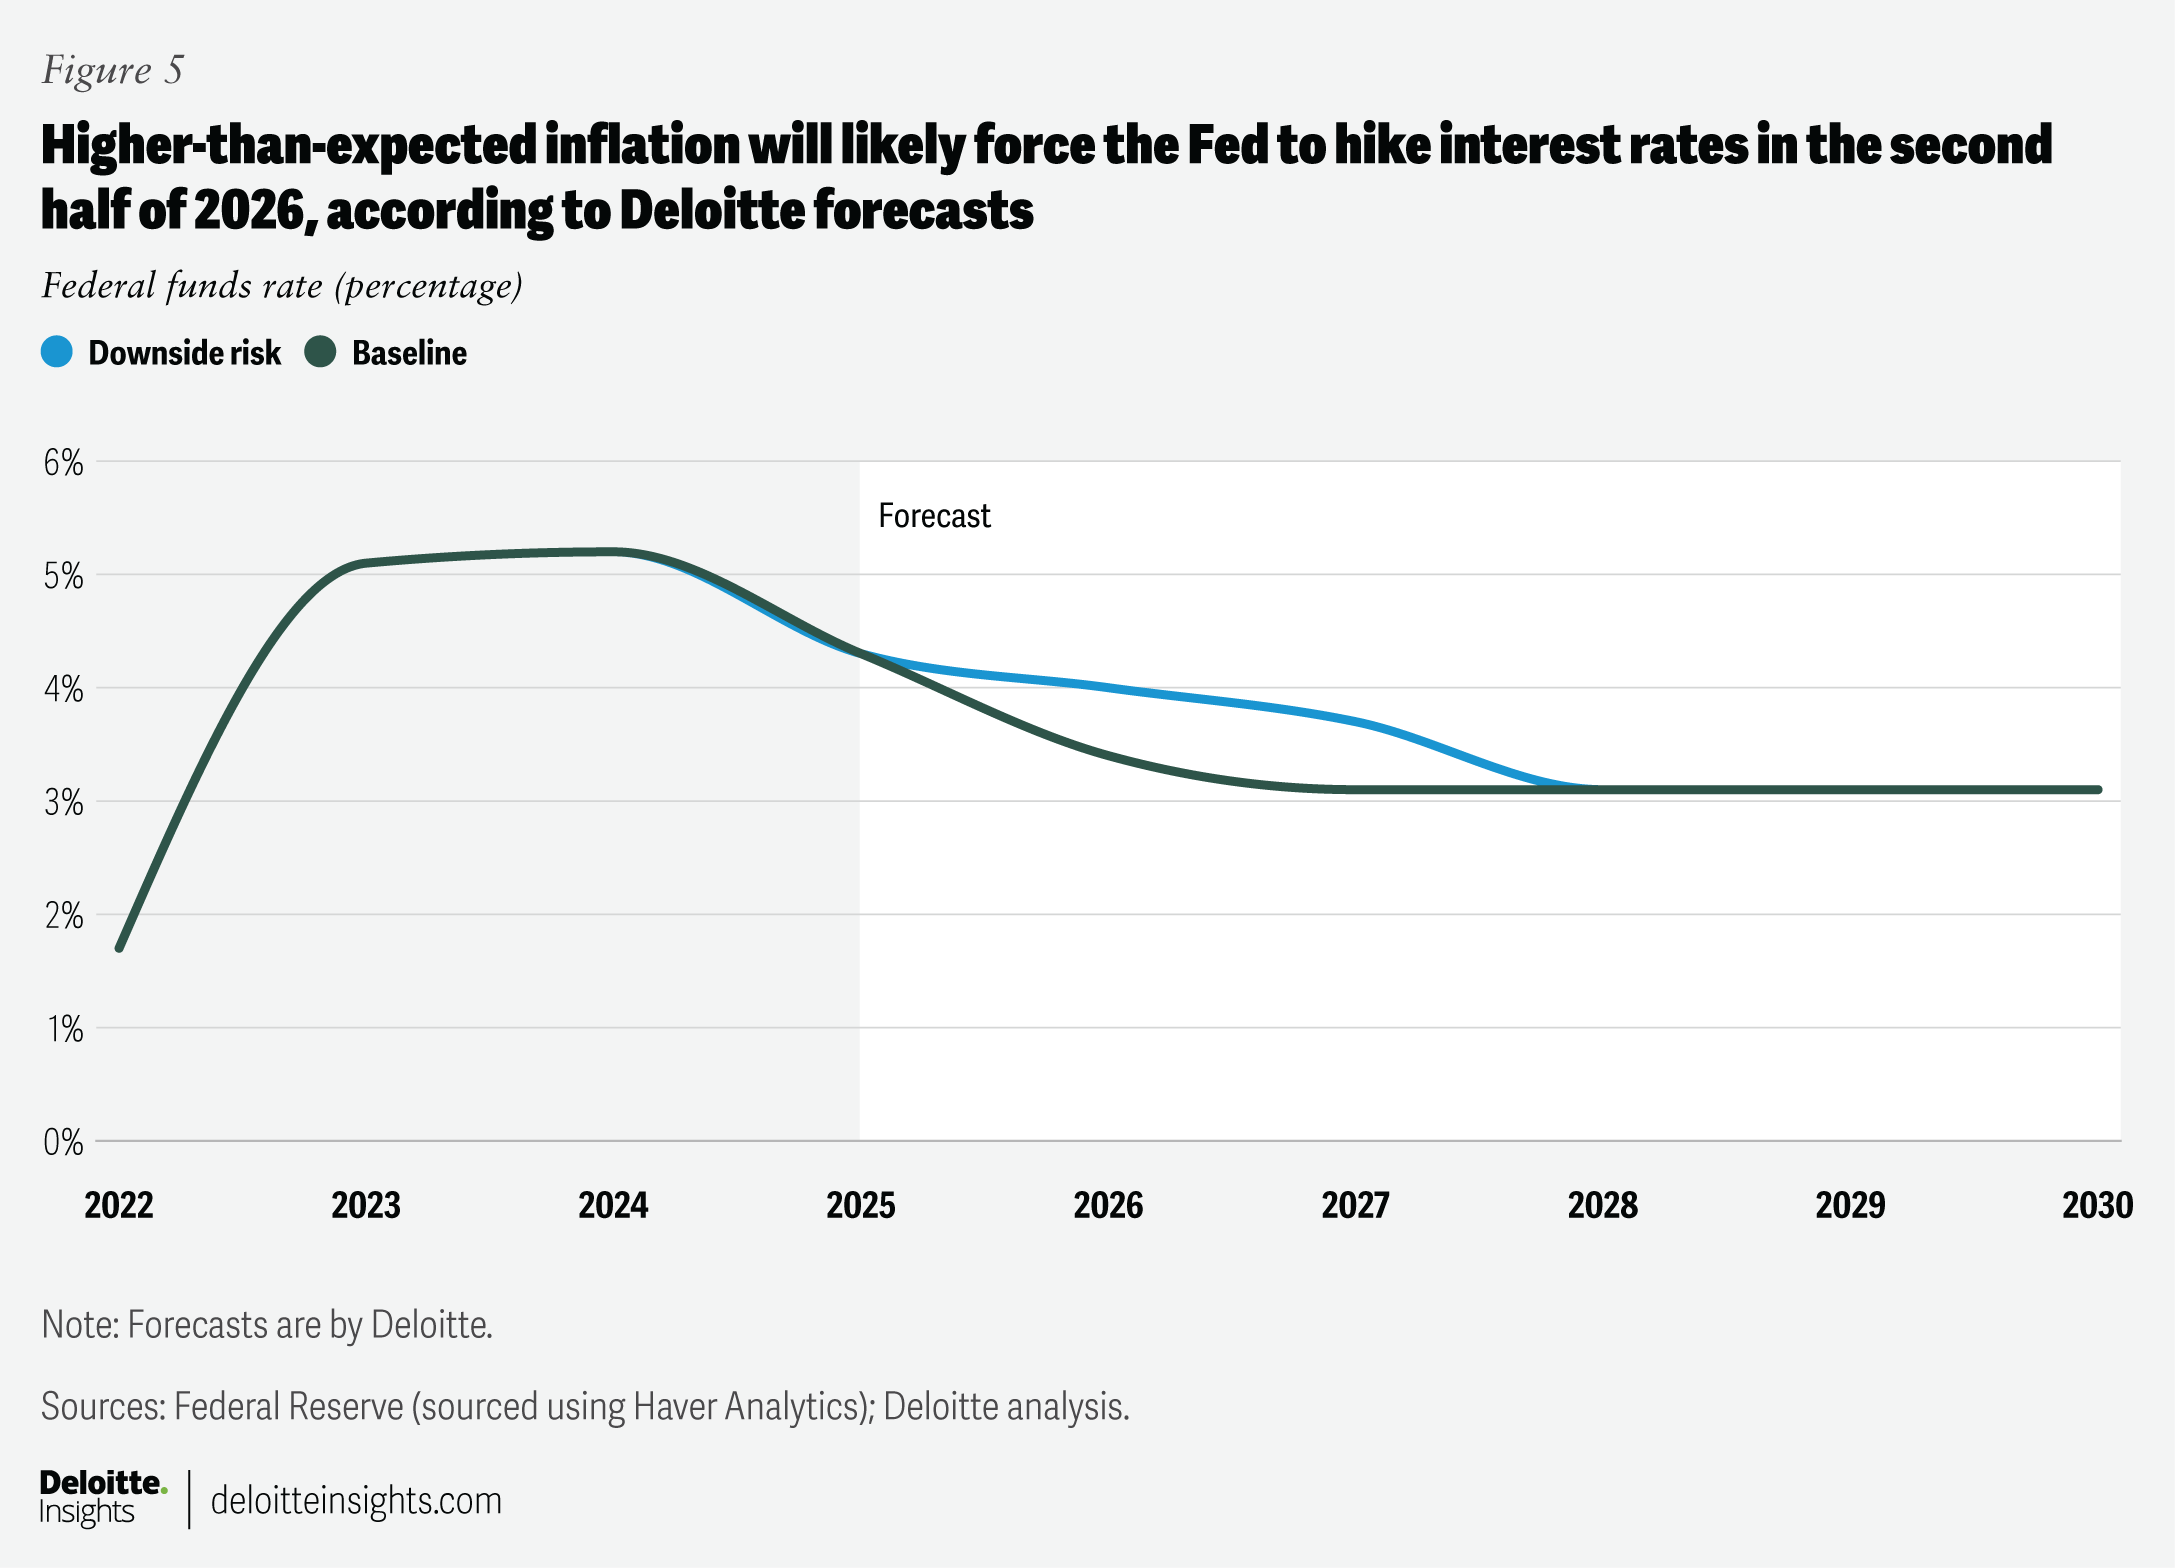
- Deloitte economists, in their baseline scenario, forecast that the US average effective tariff rate will settle at about 15% by next year, while net immigration will be about 3.3 million from 2025 through 2030.15 The volume of net immigration is lower than previous estimates. For example, in January, the Congressional Budget Office had forecasted that net immigration would be 6.8 million between 2025 and 2030.16 Given the impact of higher tariffs and lower immigration, the Fed will likely stick to its current easing cycle till the federal funds rate reaches 3.125% by the fourth quarter of 2026.
- However, a higher tariff rate (20%) and zero net immigration by 2030—which forms the core of Deloitte’s downside risk scenario—will push inflation higher than the baseline. This, in turn, is expected to make the Fed reverse course next year and hike policy rates in the second half of 2026. This will likely lead to a recession spanning the last quarter of 2026 until the second quarter of 2027, forcing the Fed to again lower rates in 2027 to stimulate the economy (figure 5).
An eye on ‘fiscal dominance’
The Fed currently holds US$4.6 trillion worth of US Treasuries, making it the largest domestic holder of marketable US government debt.17 Bond markets may therefore construe steady rate cuts amid rising inflation and lack of fiscal consolidation as a sign of waning independence of the Fed, especially given recent government efforts to intervene in monetary policy decisions.18 In particular, this may raise concerns about “fiscal dominance,” where central banks tune monetary policy to support fiscal sustainability, thereby denting investor confidence in US Treasuries. This was most evident during the wartime economy of the 1940s. While today’s scenario may be less scary, episodes of sharp dips in bond investors’ confidence in Europe19 will likely keep the Fed wary of any missteps.
BY
Akrur Barua
Michael Wolf
The authors would like to thank Dr. Ira Kalish, chief Global and US economist, for his reviews.
Cover image by: Harry Wedel