United States Economic Forecast: Q2 2026
Oil prices and AI investment play major role in the US economic forecast for 2026–2031
Deloitte analysis forecasts three scenarios for US economic growth over the next five years, with oil shocks, ongoing AI investment, and US inflation as significant factors
Since our last forecast, we have continued to see a rapidly changing global economic and policy environment, and recognize that conditions remain highly fluid. Hence, the three forecast scenarios we present here are not meant to be precise estimates of where the US economy will end up. Instead, they are built on explicit assumptions to help guide thinking about the future.
Our baseline forecast reflects our best assessment of the path economic variables will take. Our downside and upside scenarios reflect plausible alternatives for the US economy, should our assumptions prove to be overly optimistic or pessimistic, respectively.1
Table of contents
- Scenarios
- Sectors
Scenarios
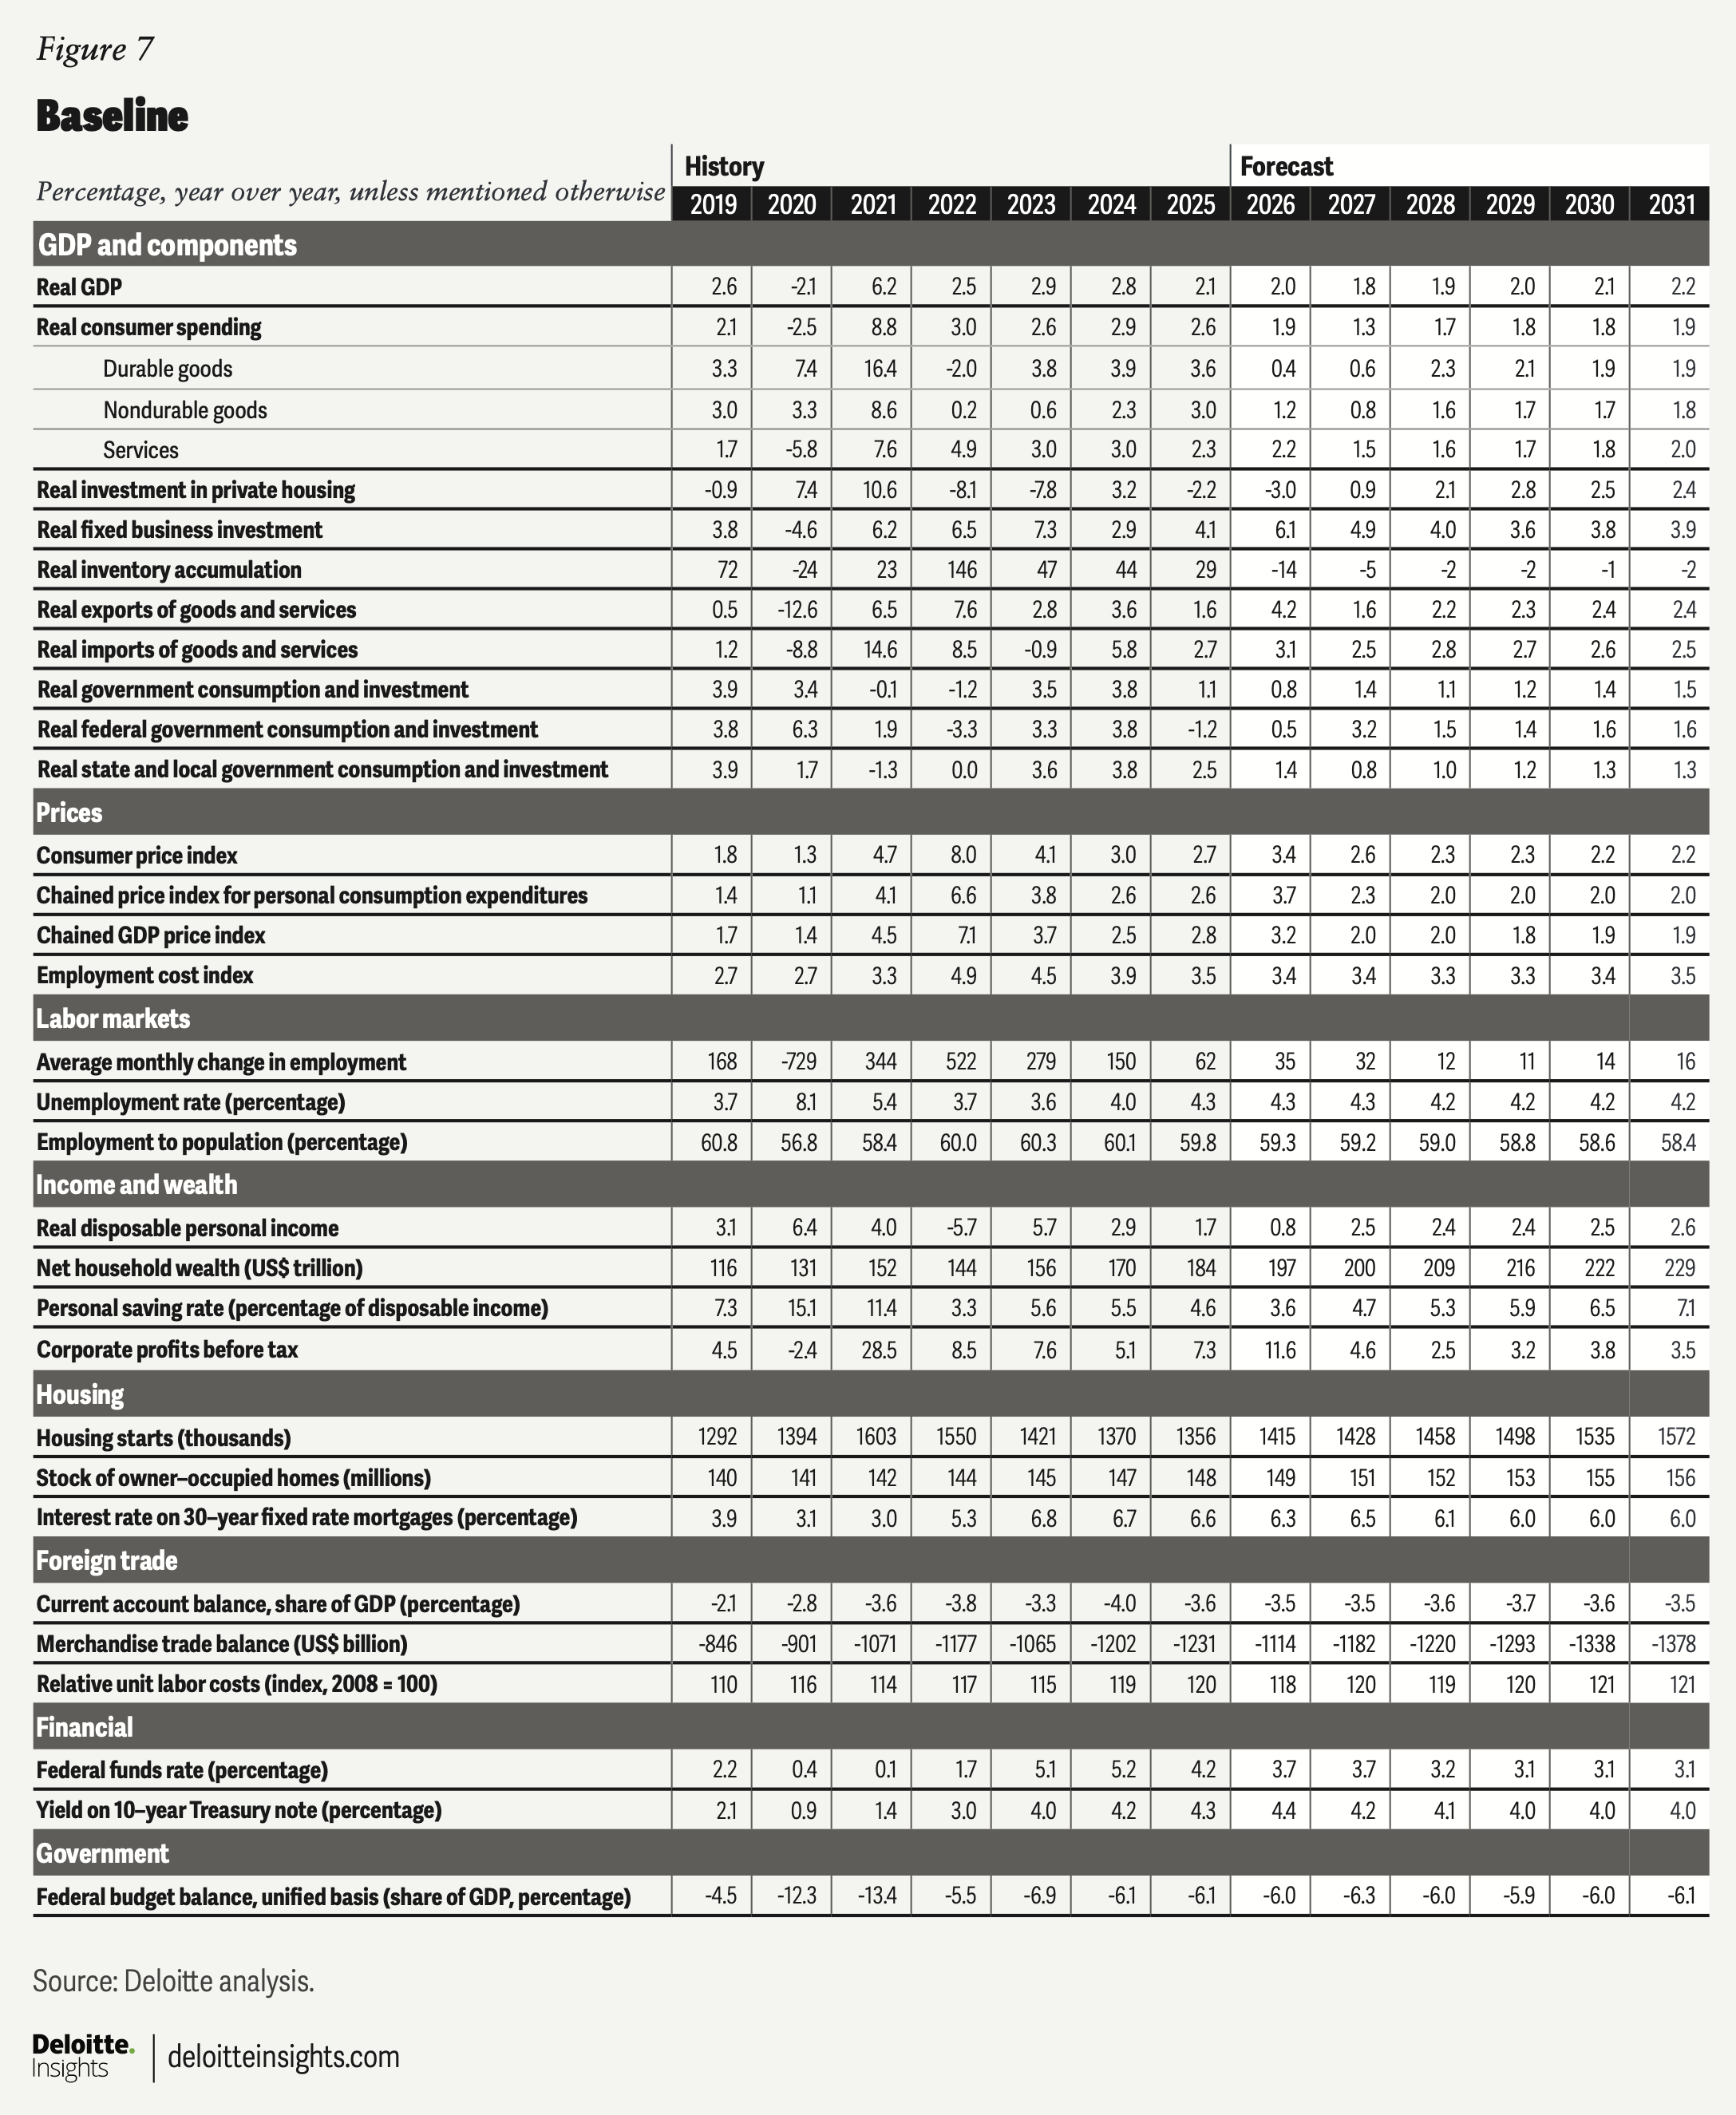
Baseline
Real economic growth (measured in terms of gross domestic product) has been relatively strong this year, thanks to solid gains in business investment and a resilient consumer. Capital expenditures related to artificial intelligence and the positive wealth effect of higher stock prices are part of the explanation. Indeed, we have revised our outlook for fixed business investment growth to 6.1% in 2026, up from the 4% in our previous forecast.
While AI-related investment is expected to act as a key support to economic growth this year and next, the path oil prices take will largely dictate how strong or weak growth will ultimately be. Despite the United States being the world’s largest oil producer, higher oil prices are expected to weigh on growth as they erode purchasing power, with only limited upside for additional investment in oil and gas production. Our baseline forecast assumes that the price of Brent crude averages US$92 per barrel in 2026 and falls to US$80 per barrel in 2027.
Higher oil prices have already had a direct effect on inflation, which was 4.2% on a year-ago basis in May, up from 2.4% in February. Higher fertilizer prices, also impacted by the Middle East conflict, are expected to raise food prices later this year. Higher tariffs have also contributed to inflationary pressure, though we expect those pressures to diminish by the end of the year.
Stronger inflation, coupled with solid payroll growth, will likely cause the Federal Reserve to raise interest rates by the end of this year. However, the rates are unlikely to stay heightened for long. We expect the Fed to announce a rate cut before the end of 2027. We expect oil prices to move lower next year, which will cause inflation to move lower on a sequential basis.
In addition, domestic demand outside of AI-related investment is expected to slow. Fiscal stimulus from the One Big Beautiful Bill Act supported growth this year, but fiscal policy is expected to turn modestly contractionary, as the boost from tax cuts begins to fade while federal spending remains constrained.2 In addition, higher gasoline prices have severely blunted the stimulative effect of those tax cuts.3
Consumer spending is also likely to shift lower amid higher interest rates and inflation. Indeed, personal savings fell to an extreme low of 2.6% of after-tax income in April. Wage growth has also continued to moderate even as inflation has picked up, further eroding purchasing power. Wage growth is not expected to pick up either, given demand for labor remains muted. A decrease in immigration is expected to weigh on slow total employment growth, with working age population growth nearing 0%, slowing to a crawl.
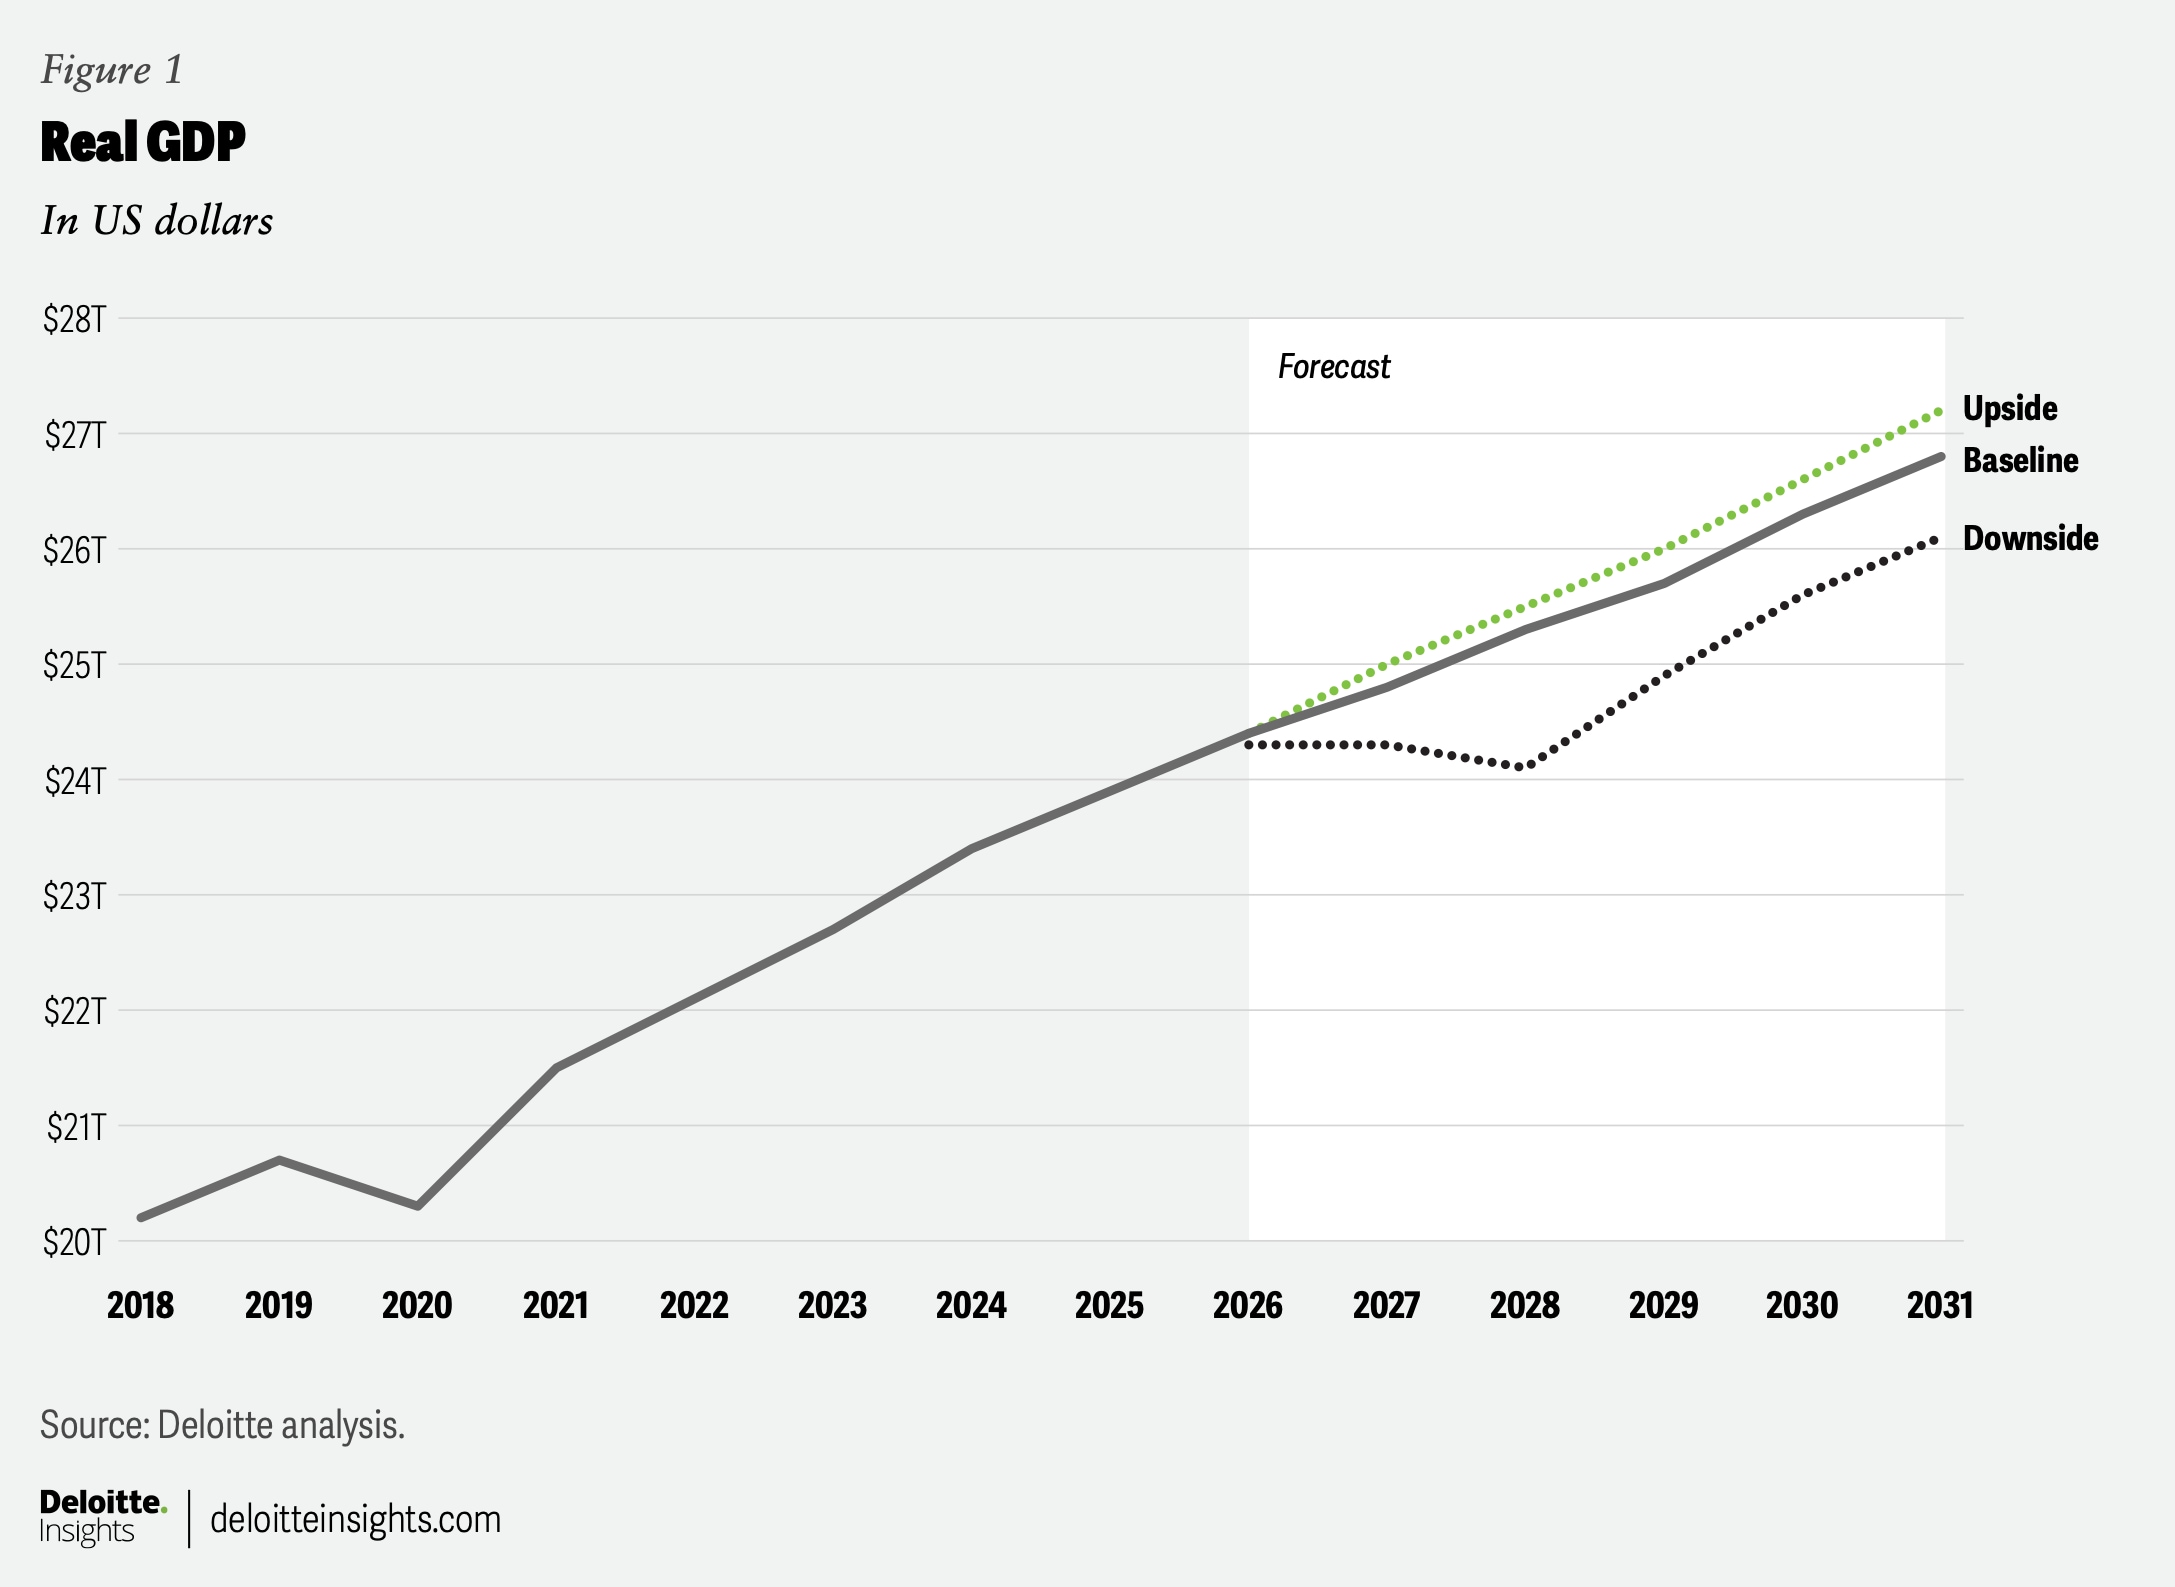
Real GDP is still expected to grow by a healthy 2.0% in 2026, before slipping to 1.8% in 2027, when consumer spending is on a more sustainable footing and AI-related investment growth moderates a bit. However, we have revised our longer-term real GDP forecast higher as we now anticipate stronger AI-led productivity gains to begin showing up in macroeconomic data over the next few years. As a result, real GDP in 2030 is expected to be 2.1%, up from the 1.7% we forecasted in March.
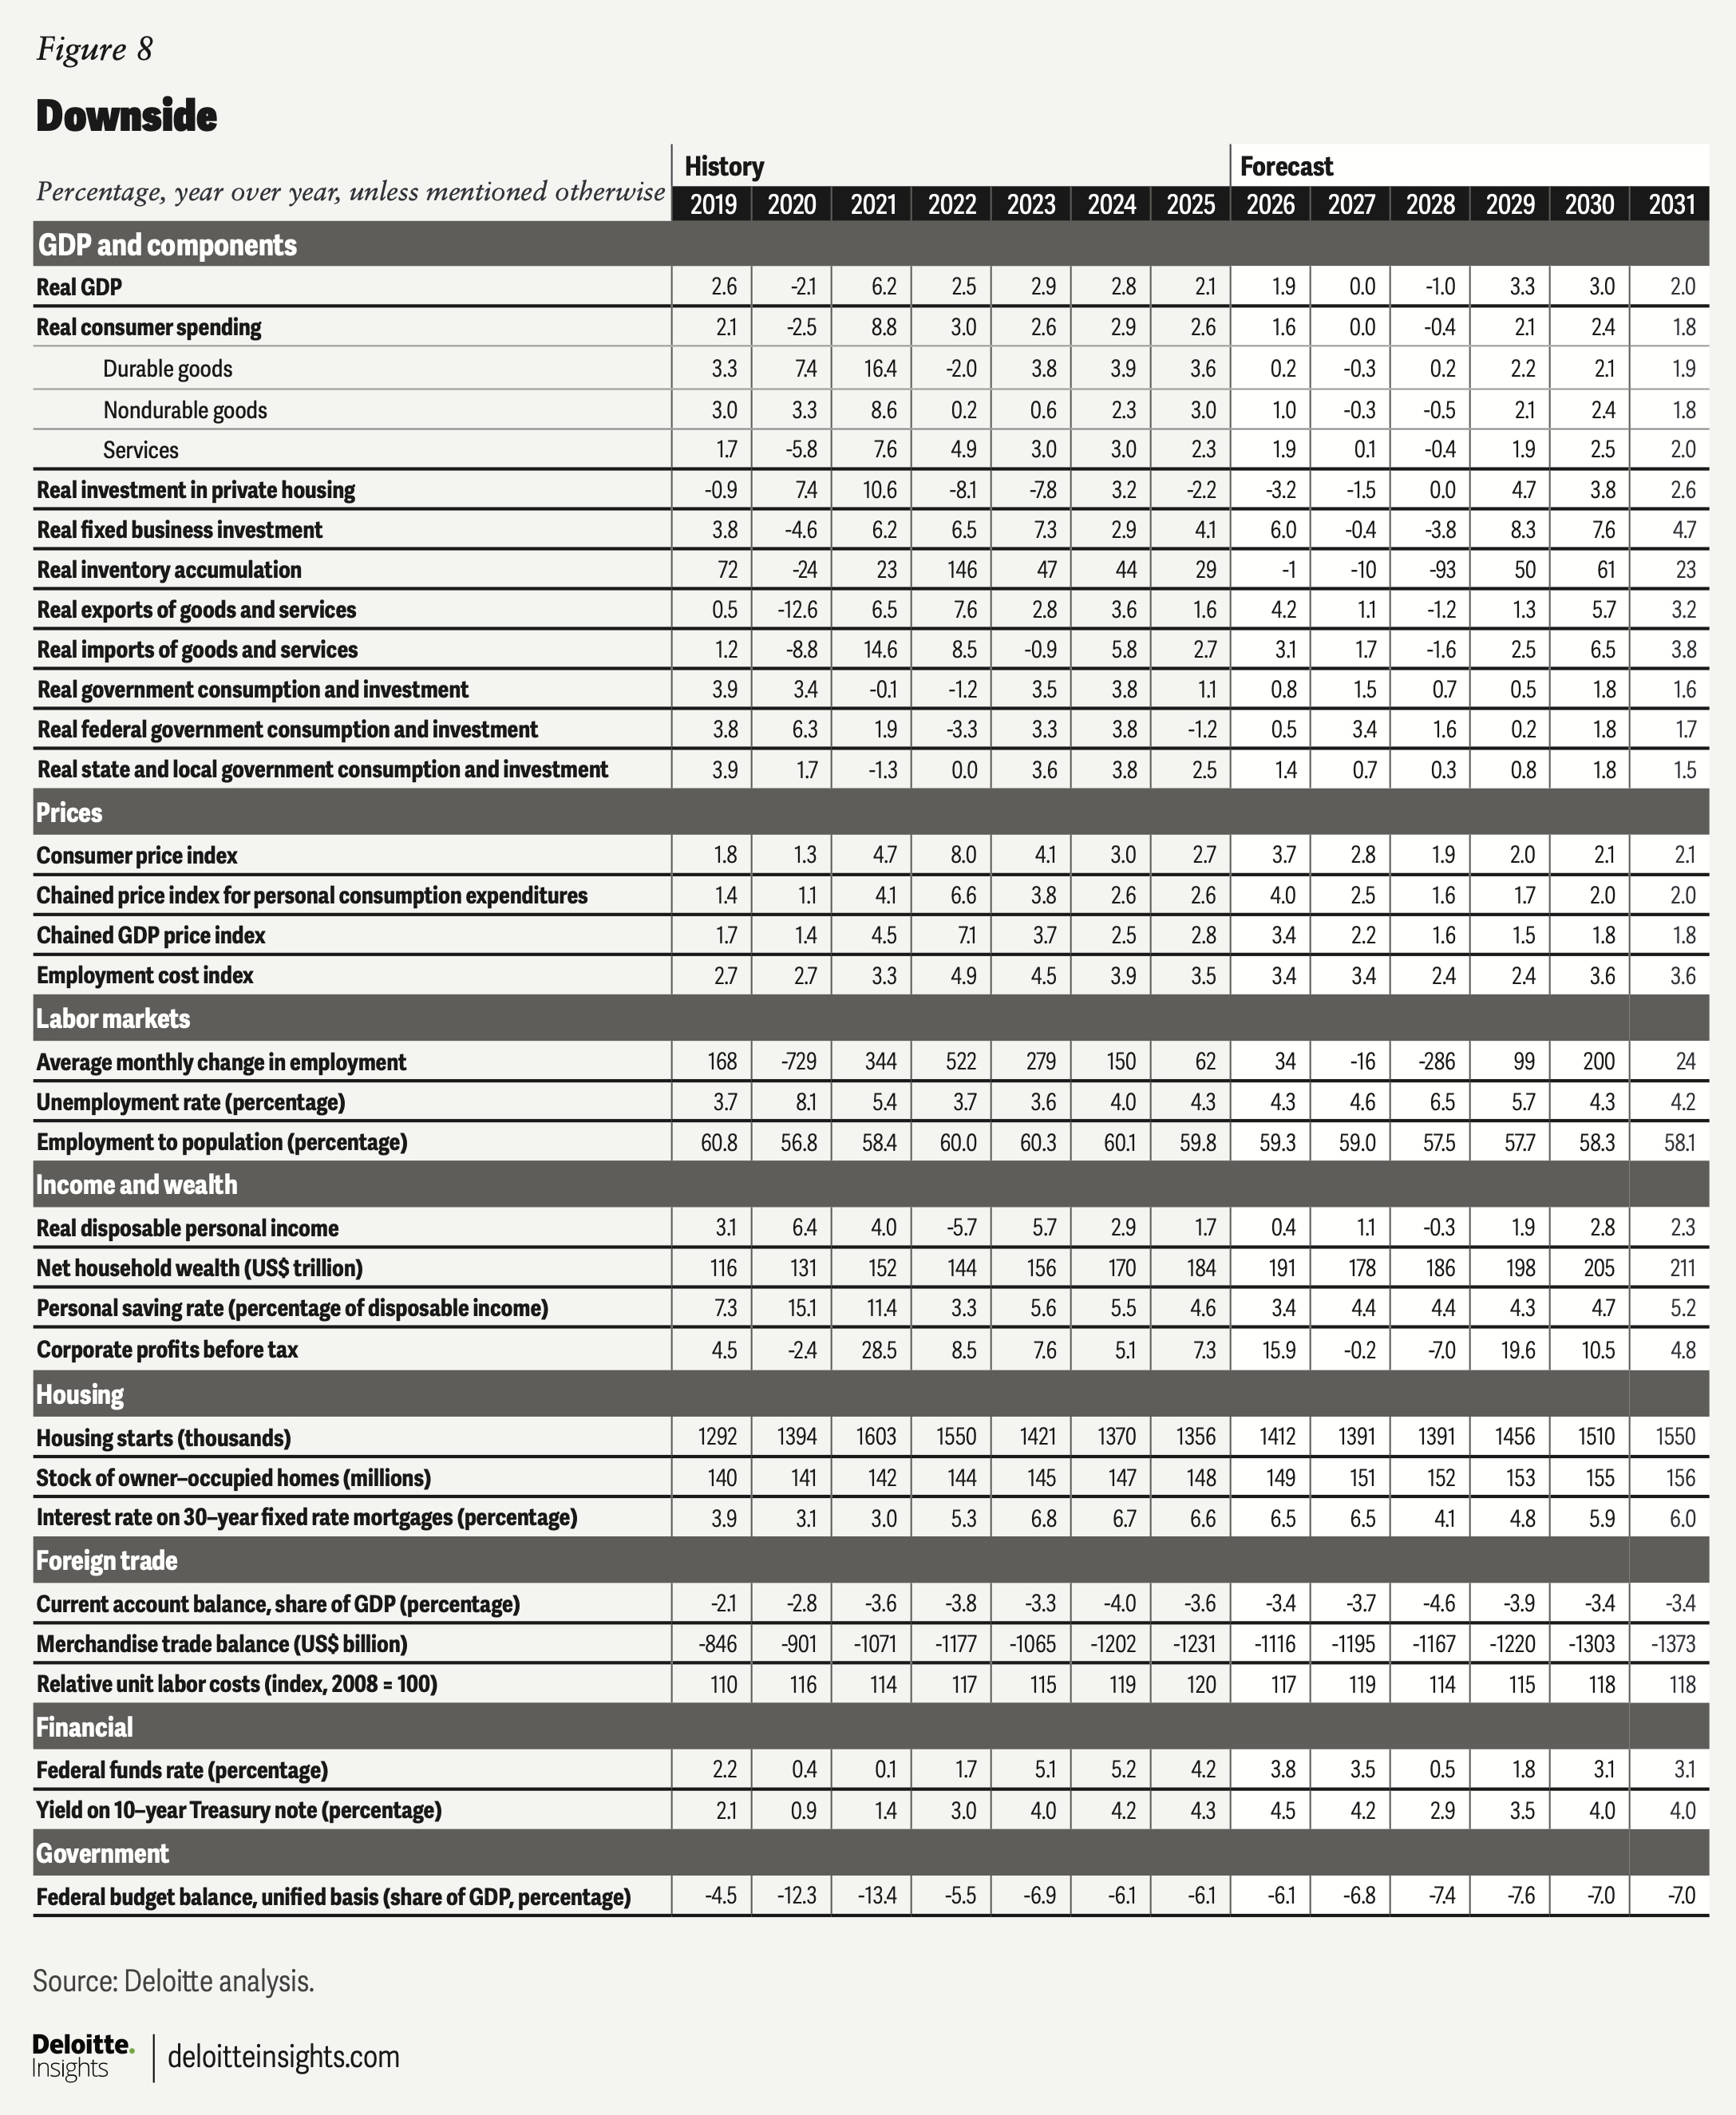
Downside: The oil shock returns
Our downside scenario maintains the same tariff and immigration assumptions as the baseline. However, it assumes a higher average oil price throughout the forecast period. We assume that Brent crude averages US$106 per barrel in 2026, slipping to a still-lofty US$103 in 2027. We also assume that AI investment gets overdone, leading to a sharp pullback in business spending in 2027, as companies reassess potential demand for related products. Real business investment is expected to decline by 0.4% in 2027 and another 3.8% in 2028. For reference, the peak-to-trough decline in our downside scenario is nearly as large as the decline seen after the dot-com bust.
Additionally, the depreciation cycle for many of the components of AI-related investments is relatively short. Rising obsolescence of existing AI infrastructure will likely force companies to make new investments just to maintain existing capabilities, which could drive more spending to prevent moving further from the technological frontier. Moreover, input-price inflation is expected to ease quickly in this scenario, lowering a critical barrier to additional investment.
We expect stock prices to fall roughly 15% from peak to trough. This should bring price-to-earnings ratios in line with their long-term average. This sudden drop in wealth will have an outsized effect on consumer spending, which has been heavily dependent on top earners who are likely more influenced by changes in their financial portfolios. As a result, we expect real consumer spending to remain unchanged in 2027 and fall by 0.4% in 2028.
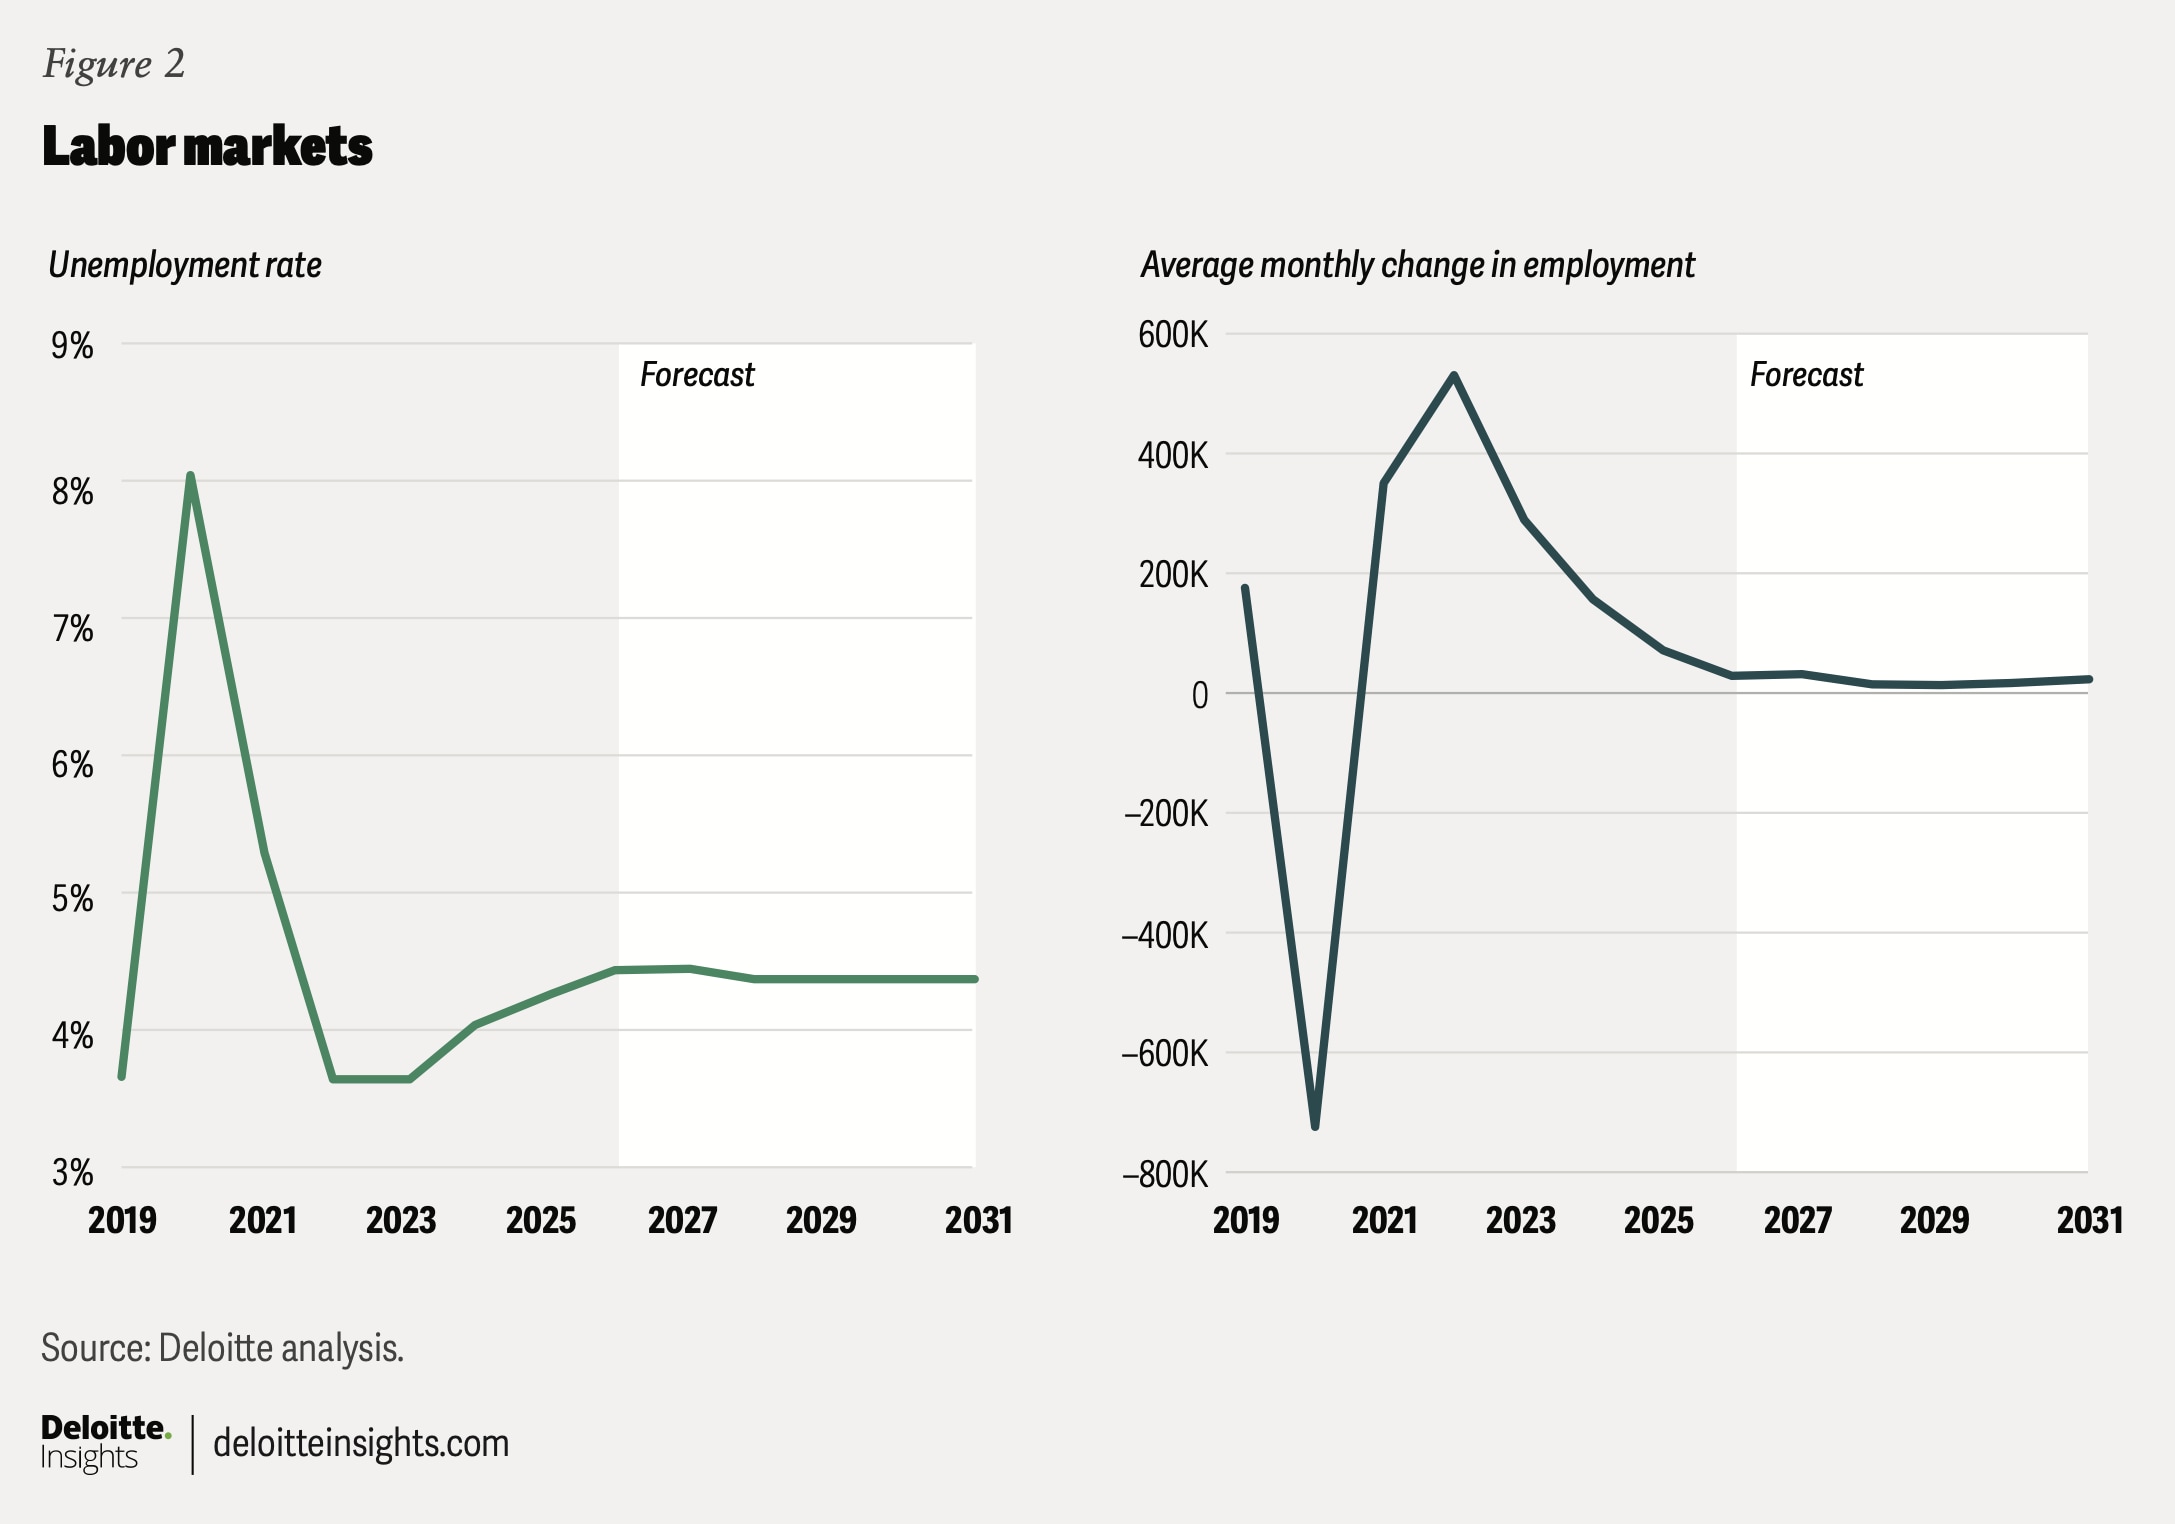
The weakening of domestic demand raises the unemployment rate to 6.5% in 2028. It also provides a stronger disinflationary impulse, allowing growth in core personal consumption expenditure (PCE) prices to dip below the US Fed’s 2% target by the end of 2027, before returning to 2% in 2030. The midpoint of the federal funds rate drops below 1% by the start of 2028. Real GDP is expected to decline by 1% in 2028. A stronger recovery is expected thereafter.
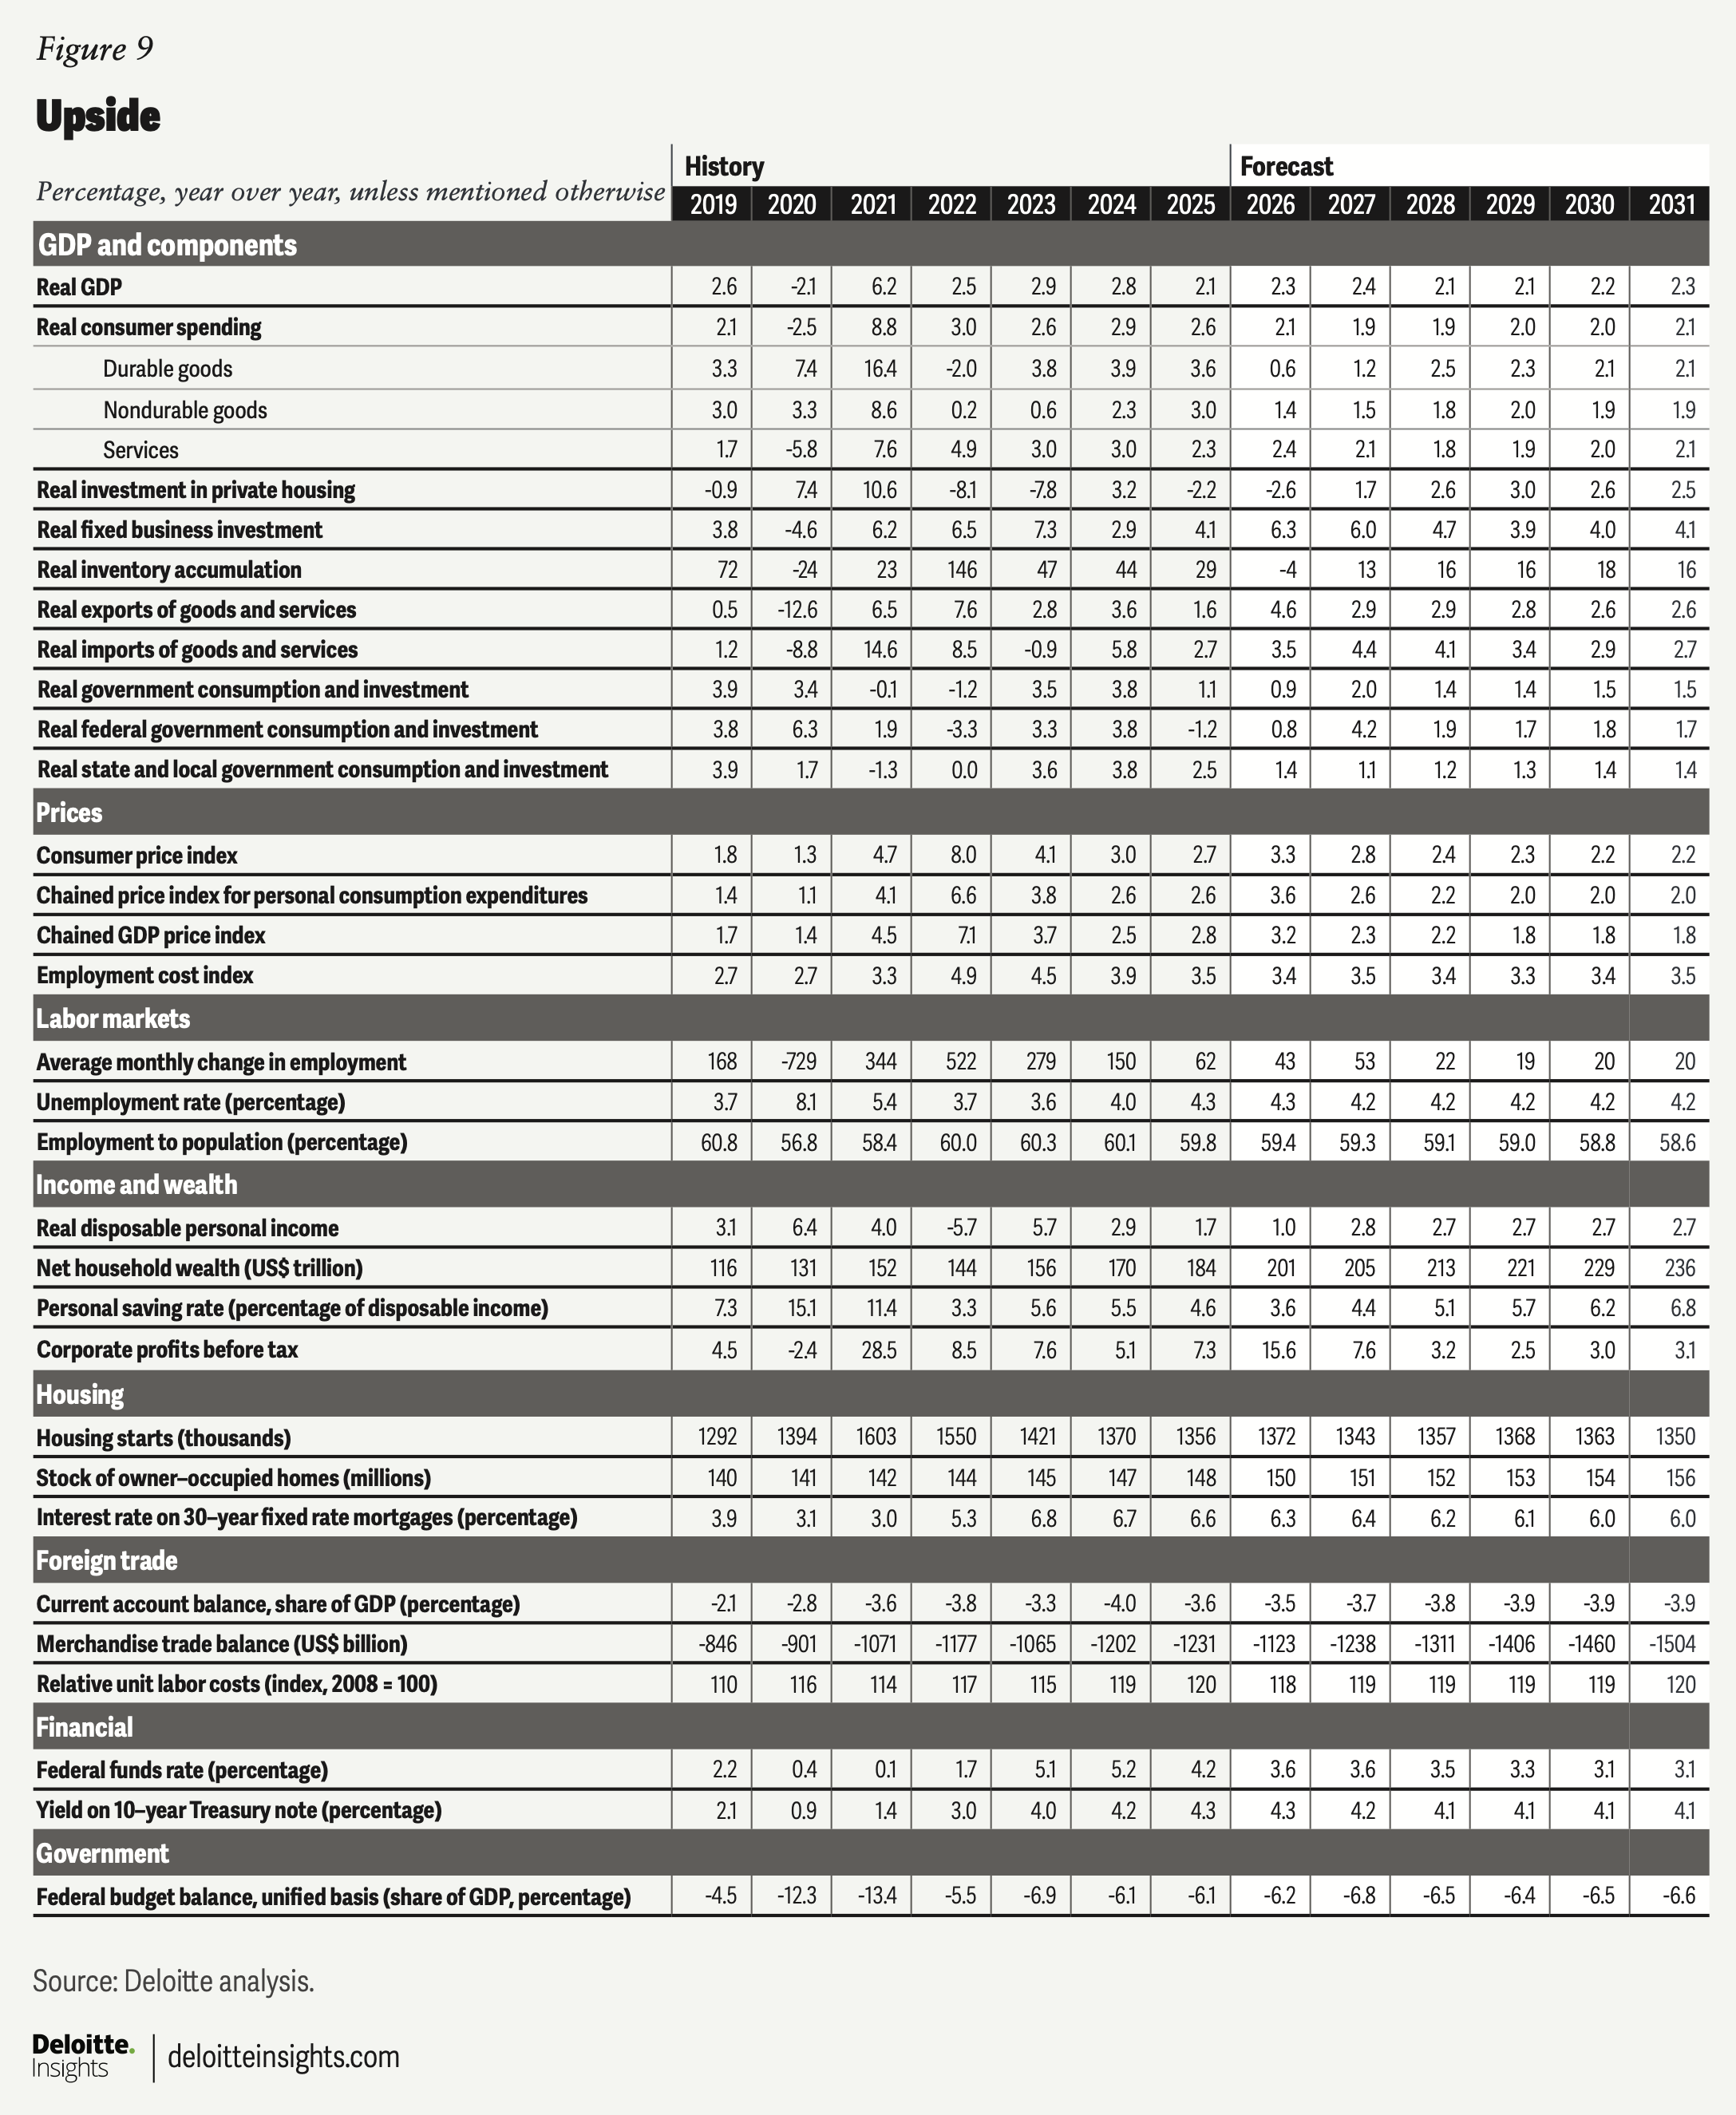
Upside: The AI investment boom endures
We assume that the average tariff rate falls to about 5% over the next year, as more exemptions are made and fewer tariffs are deemed permissible by courts. We also assume stronger net migration, with the adult population standing around 860,000 higher than the baseline in 2030. Business investment—largely driven by AI—is expected to grow stronger than the baseline sustainably. AI-related productivity gains are also expected to be stronger starting in 2027. Finally, we assume that oil prices are lower than the baseline, averaging US$85 per barrel in 2026 and US$79 per barrel in 2027.
Lower tariffs and lower oil prices help to limit the inflationary impulse from stronger business investment and higher net migration. However, we still anticipate a slightly stronger near-term inflationary impulse for core inflation. The lack of near-term inflationary pressure from the drop in oil prices prevents the Fed from having to raise rates this year. Instead, the Fed is expected to leave rates unchanged until the start of 2028 when it resumes its rate-cutting cycle. Aggregate consumer spending remains relatively strong, thanks to faster population growth and ongoing gains in equity markets. As the labor market tightens and productivity growth picks up, so does real wage growth, giving spending an additional boost.
Although aggregate business investment is expected to strengthen, its growth will be uneven. Elevated long-term interest rates will restrain investment in some sectors, especially those that have little to do with AI. On the plus side, lower tariff rates also lower input costs, particularly for capital-intensive businesses, which will allow such firms to better overcome elevated financing costs.
Sectors
Labor market
The labor market has picked up this year. Monthly nonfarm payroll growth averaged 114,000 during the first five months of this year, while it averaged a loss of 22,000 in the last five months of 2025. Some of last year’s weaknesses were due to the public sector. The unemployment rate also fell to 4.3% in May, down from 4.5% last November.
However, even with the pickup in hiring this year, private-sector payrolls were up just 0.5% on a year-ago basis in May. And if we exclude healthcare and social assistance, then private payrolls were up less than 0.1% from a year earlier.
With the unemployment rate stabilizing at a little over 4%, it is unlikely that payroll growth will exceed the growth rate of the working-age population. The US Census Bureau estimates that the working-age population had grown by less than 0.2% year over year by July 2025. Assuming net immigration has been weaker than it was in the first half of 2025, we can expect working-age population growth to be weaker as well. This demographic shift will weigh on employment growth for the remainder of the forecast period.
Other labor market surveys have pointed to weaker job demand ahead. The job opening rate has been firmly below where it was in the years leading up to the pandemic. Companies are also eager to use AI to save on labor costs, which is likely adding to their hesitation when it comes to hiring. Forward-looking purchasing managers’ surveys indicated a contraction in employment for both the manufacturing and services sectors in May.4
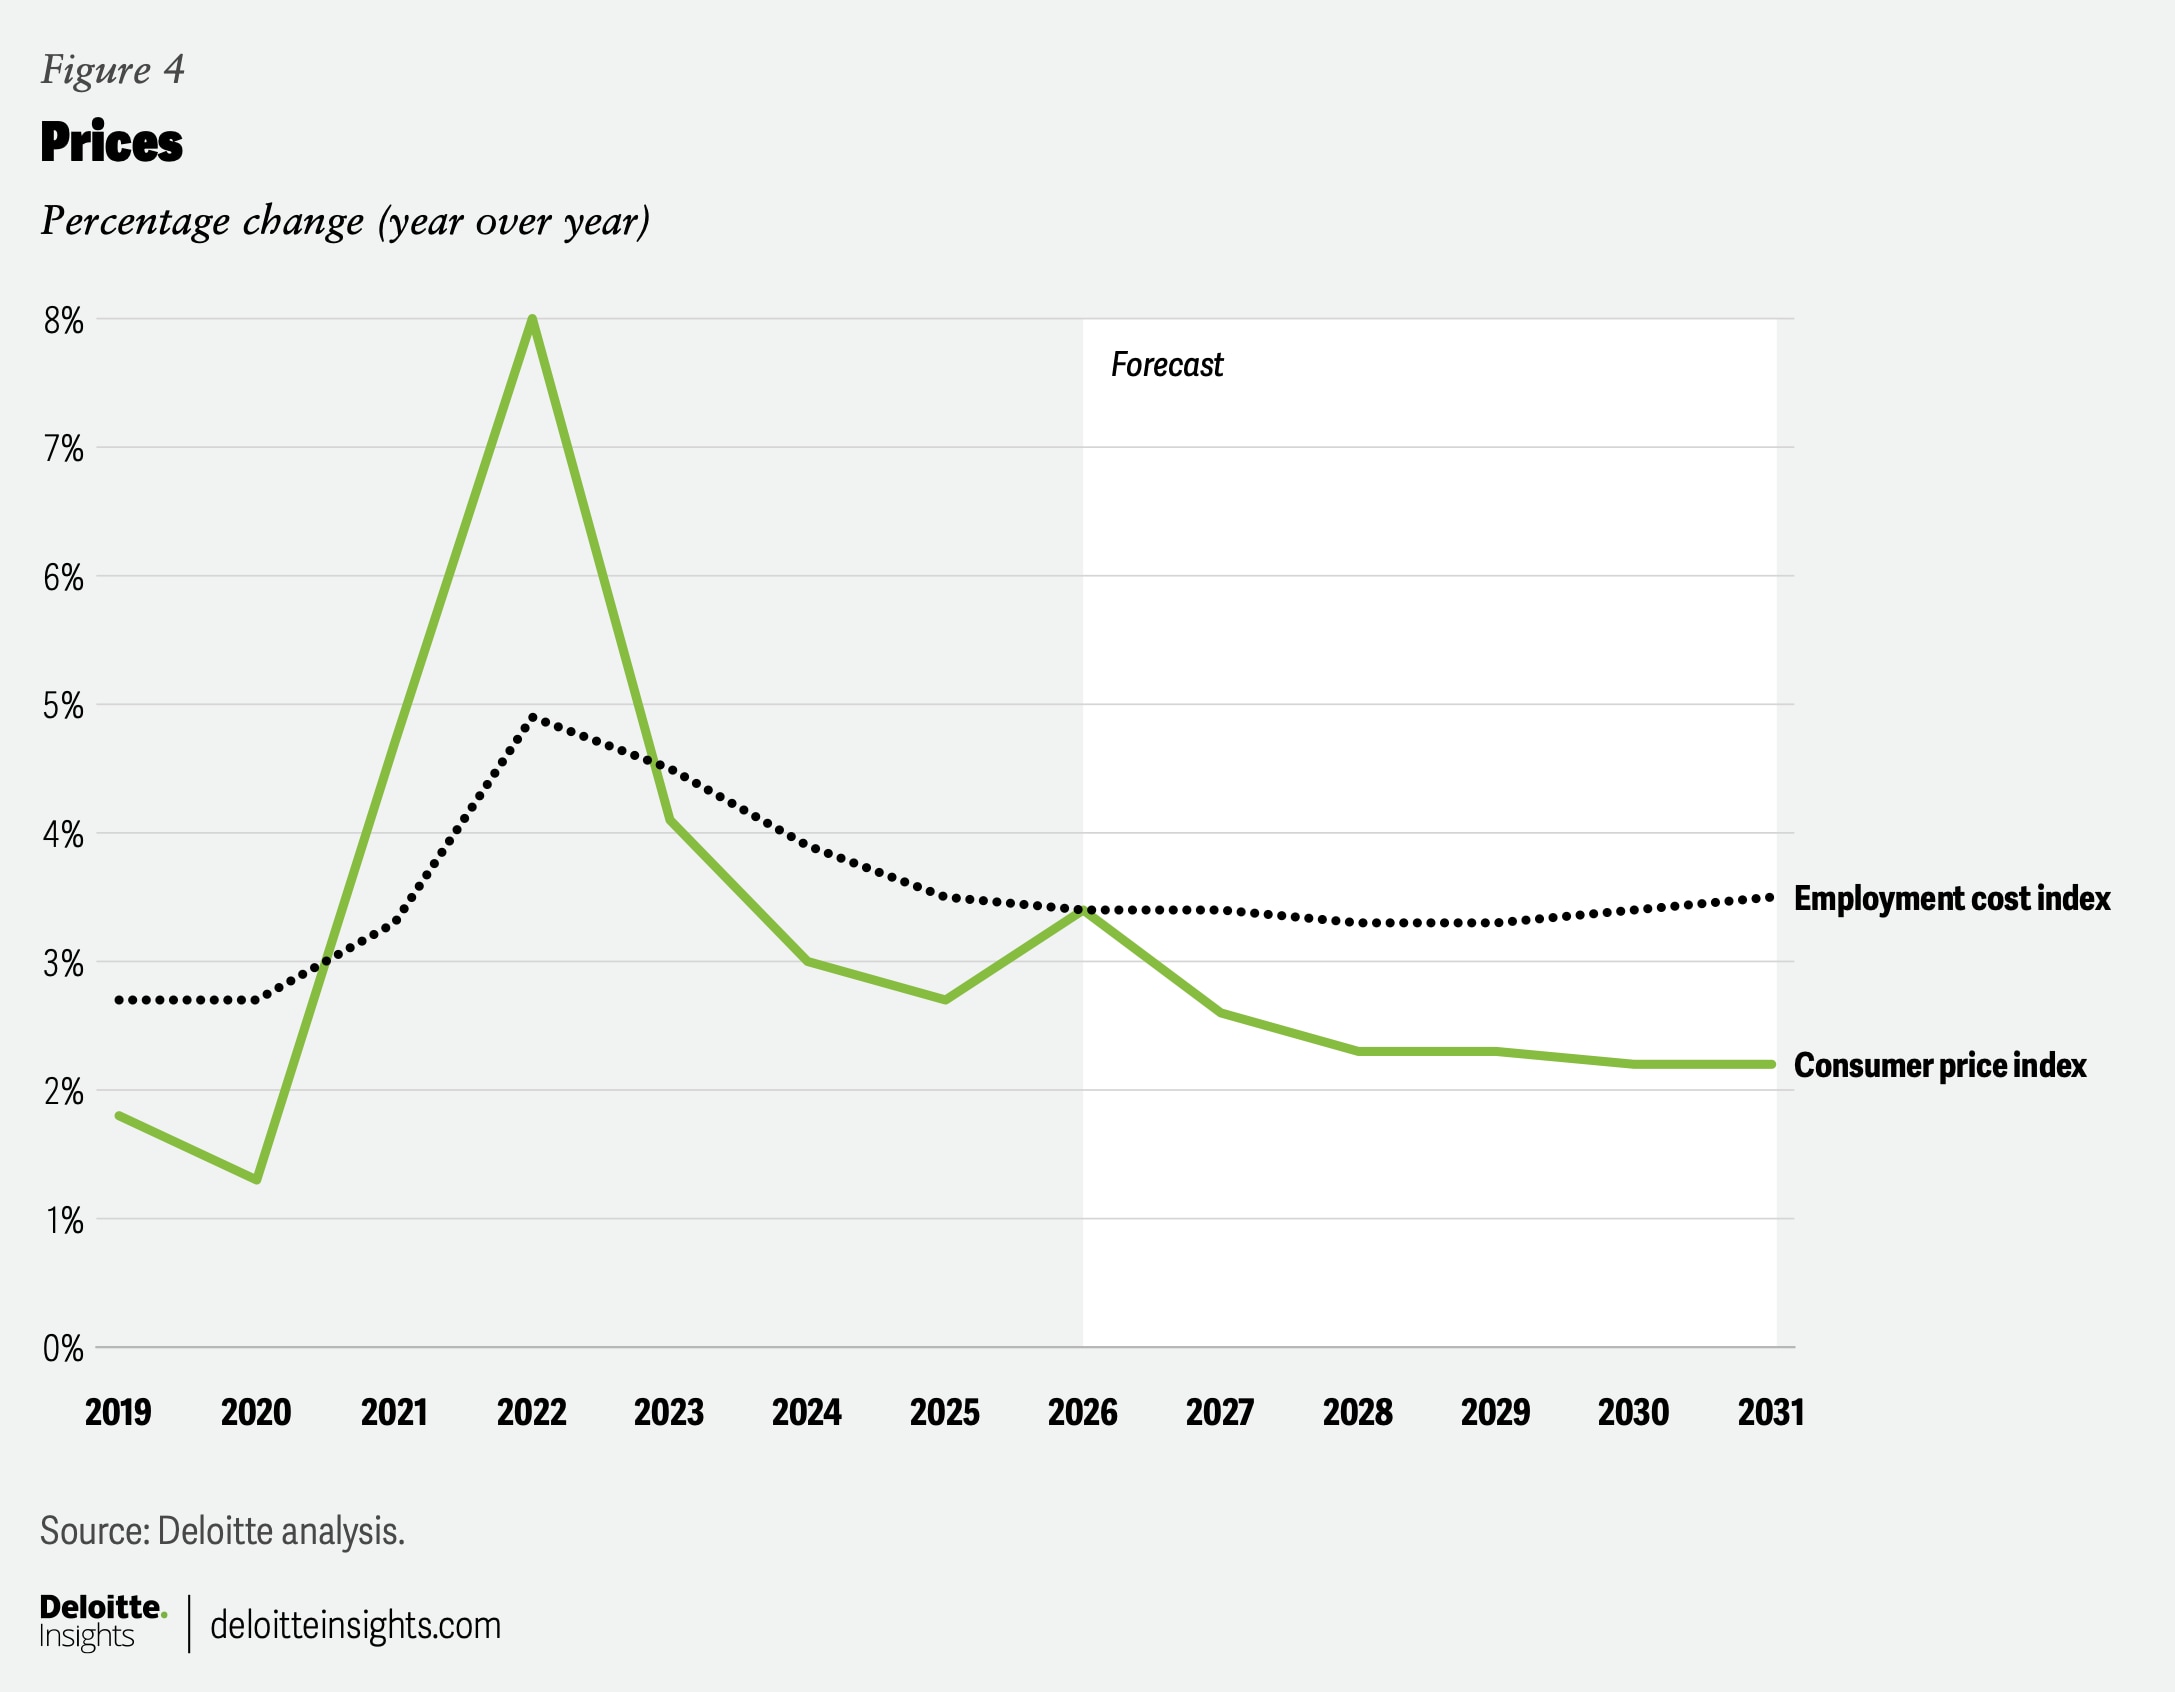
This bodes ill for wage growth, which continues to moderate. Average hourly earnings in the private sector were up 3.4% in May, down from about 4% for 2024 and 2025. Additional moderation in wage growth is expected. However, high inflation will likely limit some of that moderation in the near term, as workers expect to be compensated for the higher costs they are enduring.
Government policy
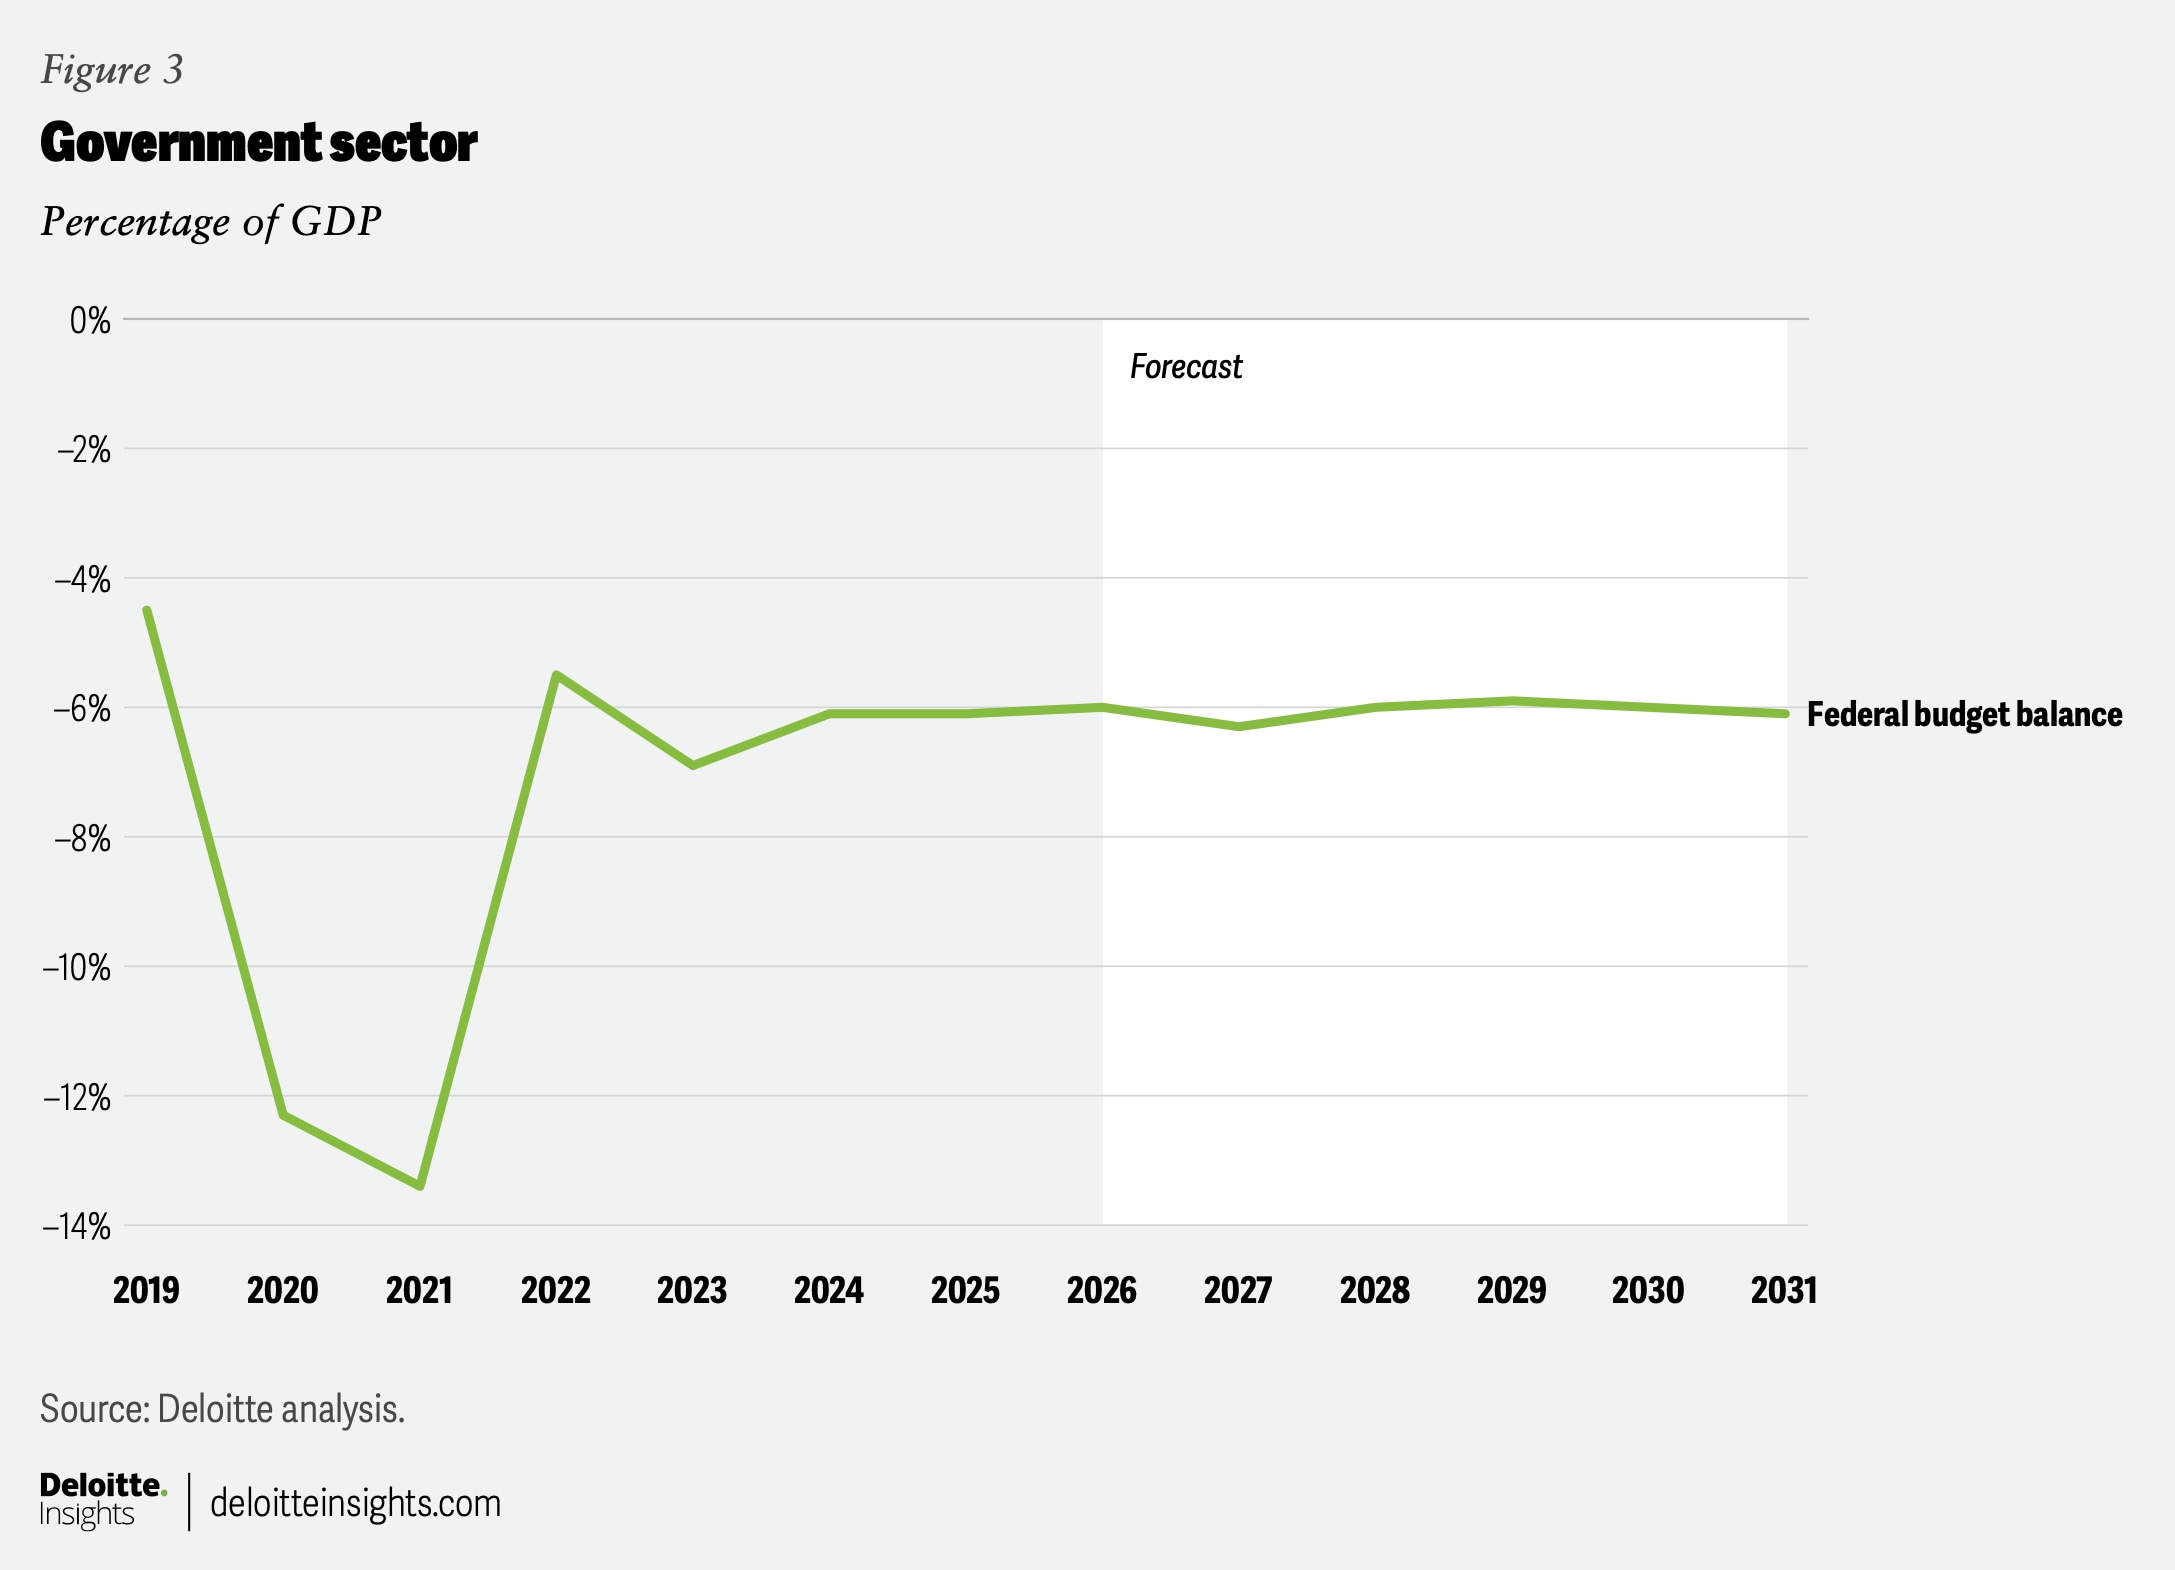
The federal deficit is expected to remain wider than 6% through 2031, which is slightly larger than the February 2026 baseline expectation published by the Congressional Budget Office (CBO).5 The expected larger deficit is partially due to our lower forecast for net migration. The CBO’s analysis of the immigration surge beginning in 2021 shows that immigrants reduce the federal deficit. Tariff-related revenues will end up being smaller than the CBO forecasted.6 The illegality of some of the recently implemented tariffs means that the federal government has to repay the roughly US$165 billion it collected in tariffs.7 A similar repayment could result from more recently collected tariffs should courts deem those illegal as well.
The tax cuts from the One Big Beautiful Bill Act are expected to continue to support growth for the rest of 2026, albeit at a somewhat lower rate compared to the first half of the year. Fiscal policy at the federal, state, and local levels is expected to turn modestly contractionary and act as a modest drag to growth for the remainder of the forecast period, as the impulse from tax cuts fades and the weight of spending cuts picks up.8 In addition, much of the stimulative effect of the 2026 fiscal policy has already been offset by the rise in gas prices, limiting the visibility of public sector stimuli in the economic data.
Prices
Headline inflation has accelerated since the conflict in the Middle East caused oil prices to spike. On a year-ago basis, the PCE price index jumped from 2.9% in February to 3.8% in April. The consumer price index showed an even stronger gain in inflation, which jumped 1.2 percentage points between February and April on a year-ago basis. Energy inflation jumped more than 17 percentage points over the same period.
Even after excluding energy, inflation has picked up. The core PCE price index was up 3.3% in April and has shown a steady trend of acceleration since at least October 2025, when it was 2.8%. Goods inflation in particular has picked up, which is due to businesses increasingly passing on the cost of tariffs to consumers. Although the statutes used to impose tariffs are expected to change, we expect the average tariff rate to remain relatively consistent, allowing the passthrough to consumers to diminish in the second half of this year.
In our baseline scenario, we expect the price of oil to move lower, which should provide a disinflationary impulse. This disinflation will likely allow the Fed to cut rates again next year after a temporary rate hike this year.
However, the Fed could turn more hawkish if inflation expectations continue to rise. In May, the New York Fed’s survey of consumer expectations revealed a median three-years-ahead expected inflation rate of 3.1%, which was only 0.1 percentage points higher than where it was at the start of the year. However, the University of Michigan’s survey of inflation expectations in five years jumped to 3.9% in May, 0.6 percentage points higher than the level in January. So far, both measures remain relatively benign, but this could quickly change if elevated prices persist.
Foreign trade
The tariff landscape is evolving quickly: On Feb. 20, 2026, the US Supreme Court determined that the US administration’s use of emergency powers to implement tariffs was illegal. After the Supreme Court ruling, the country implemented a blanket 10% tariff under Section 122, which will expire on July 24, 2026.9 The administration announced that it plans to implement more tariffs under Section 301, which allows the country to impose tariffs on countries that are engaged in unfair trade practices. Many countries may face either a 10% or 12.5% tariff under the statute, with exemptions for a range of products.10
These announced tariffs are still undergoing review at the time of writing and could thus change before implementation. However, the announcement raises questions about trade deals struck over the last year. Although using Section 301 is typically seen as a more legally permissive way to implement tariffs, these too are likely to be challenged in court,11 which will add to uncertainty regarding trade policy as well as government revenue and the fiscal deficit. We assume an average tariff rate of 10% endures through 2031 in our baseline forecast but acknowledge that this is highly uncertain given ongoing changes in this space.
The other major source of trade uncertainty is the renegotiation of the United States–Mexico–Canada Agreement. We acknowledge that the trade agreement could vary substantially from its current form. However, we will not speculate on the complicated process of the negotiations and will maintain our current tariff assumptions until we have greater clarity on the outcome.
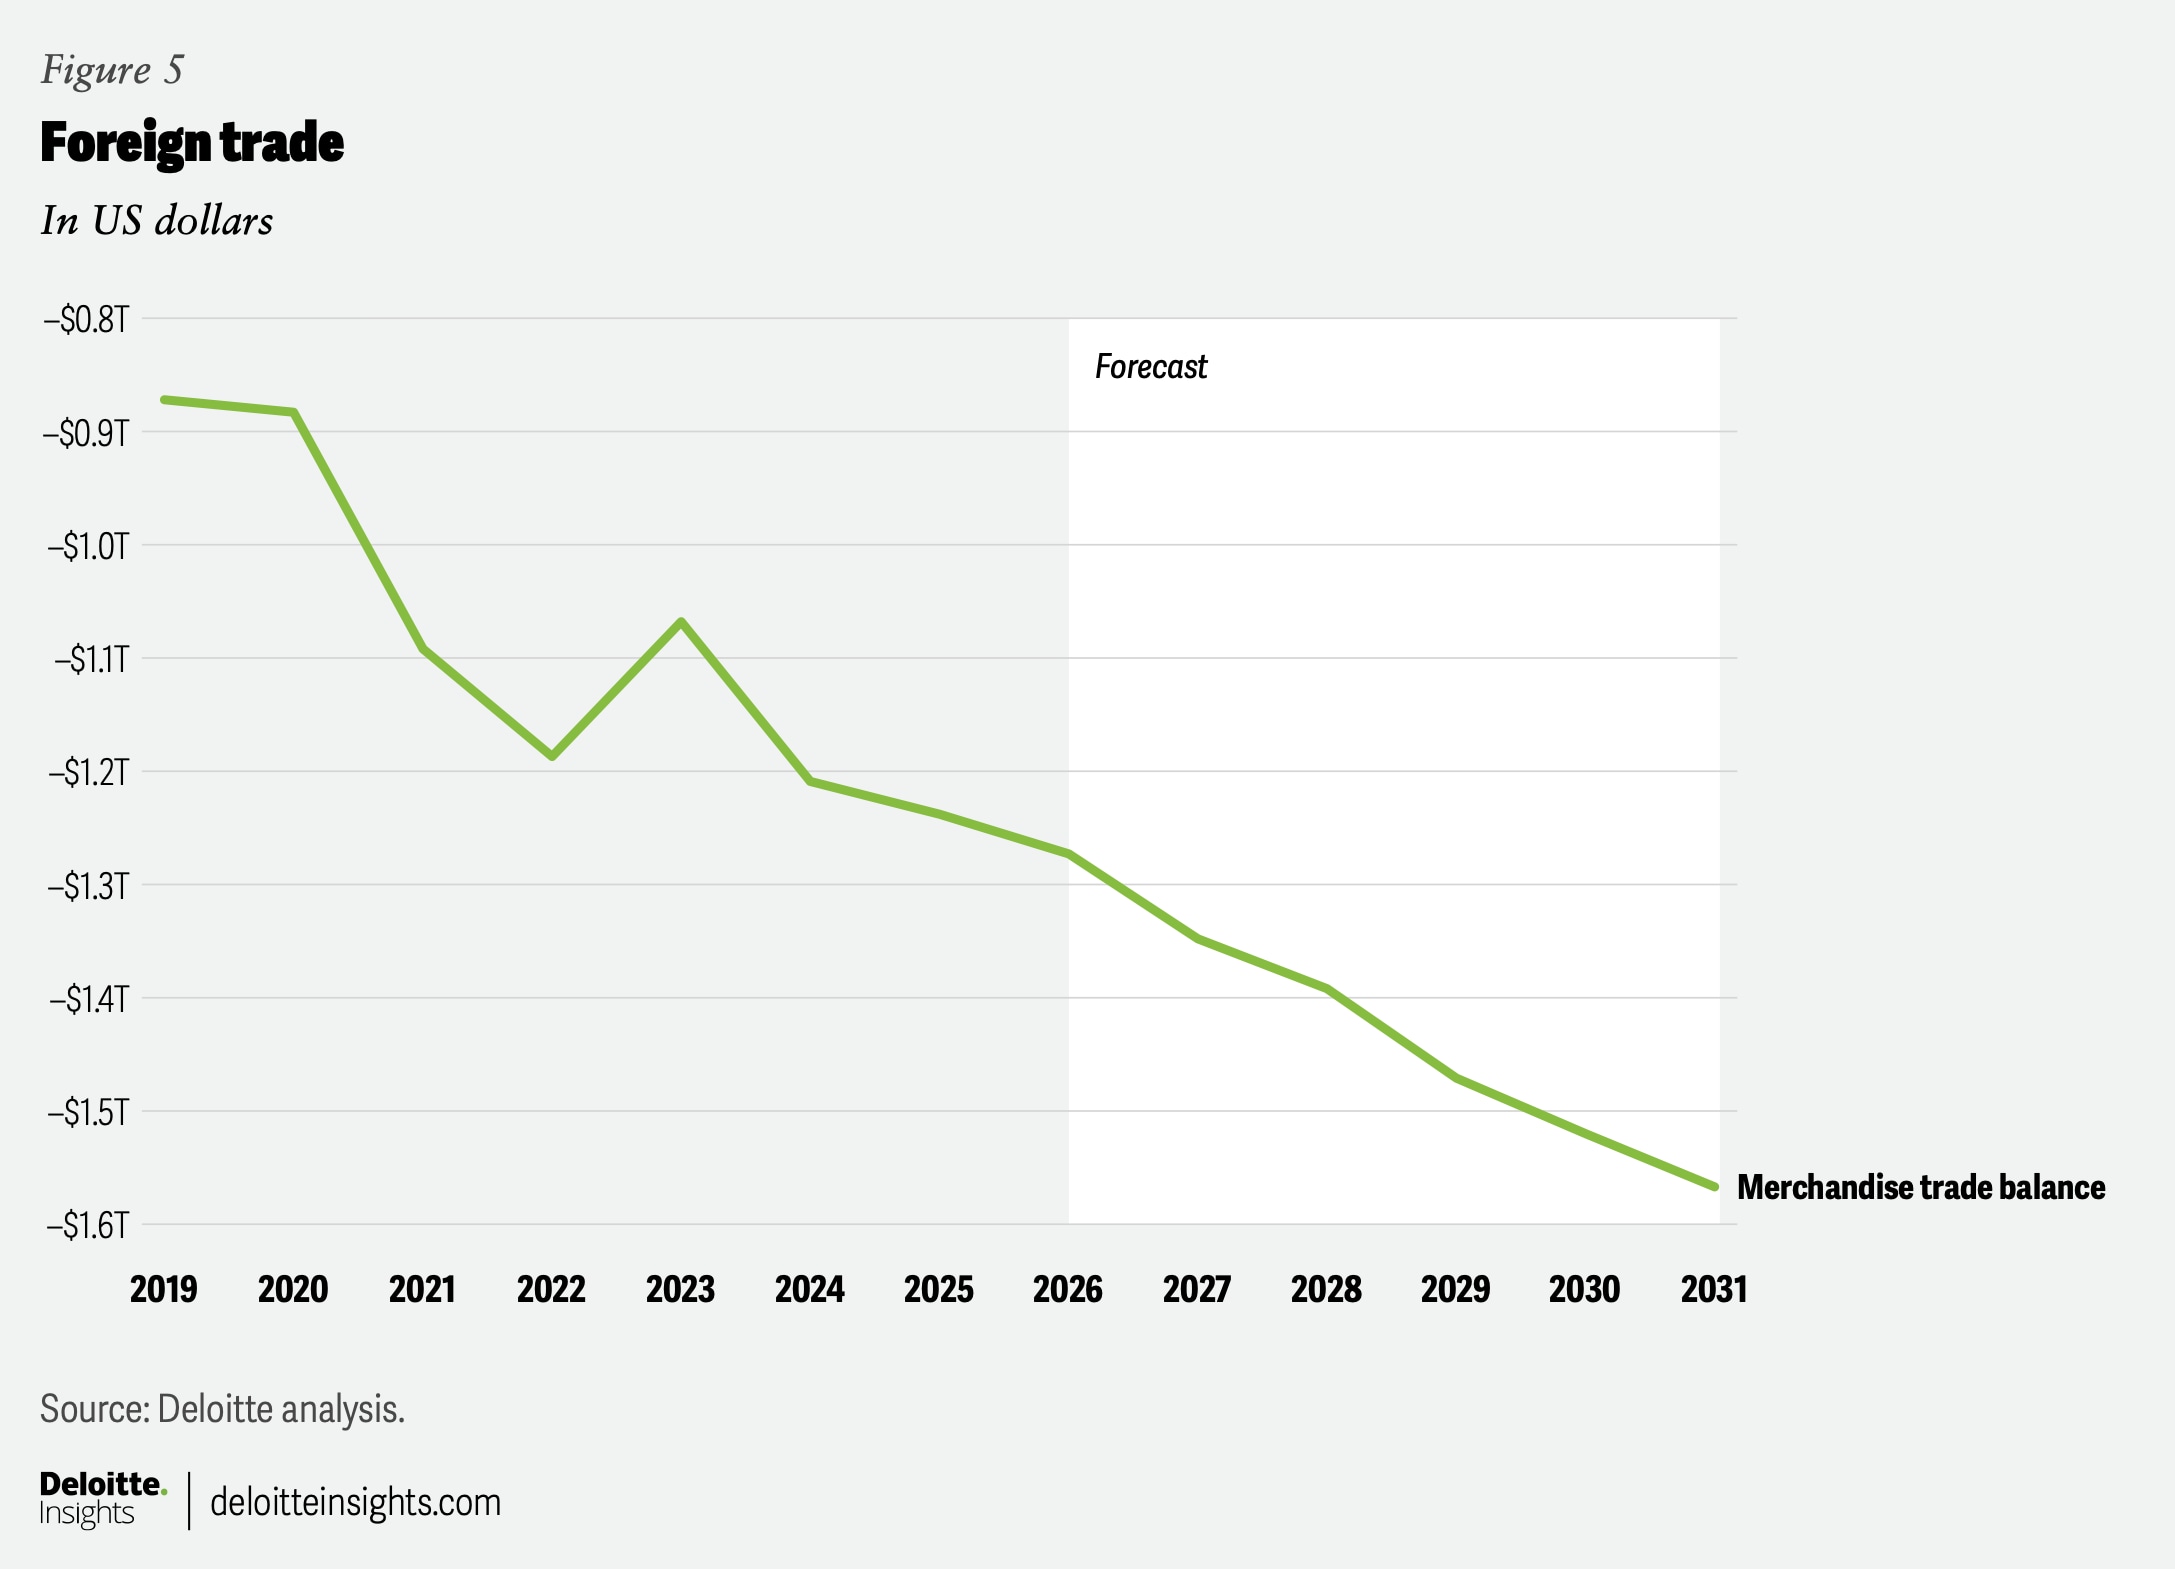
Goods trade was incredibly volatile last year as importers and exporters attempted to avoid tariffs. As a share of GDP, the goods trade deficit narrowed modestly in 2025 compared to 2024. However, we expect the deficit to widen slightly each year through 2030. Although tariffs raise the cost of imports, they also raise the cost of exports. Indeed, the export-price index is rising quickly.
With the federal budget deficit continuing to widen as a share of GDP and without a major reduction in debt elsewhere in the economy, the United States will continue to consume more than it produces, thereby raising the trade deficit.
Financial markets
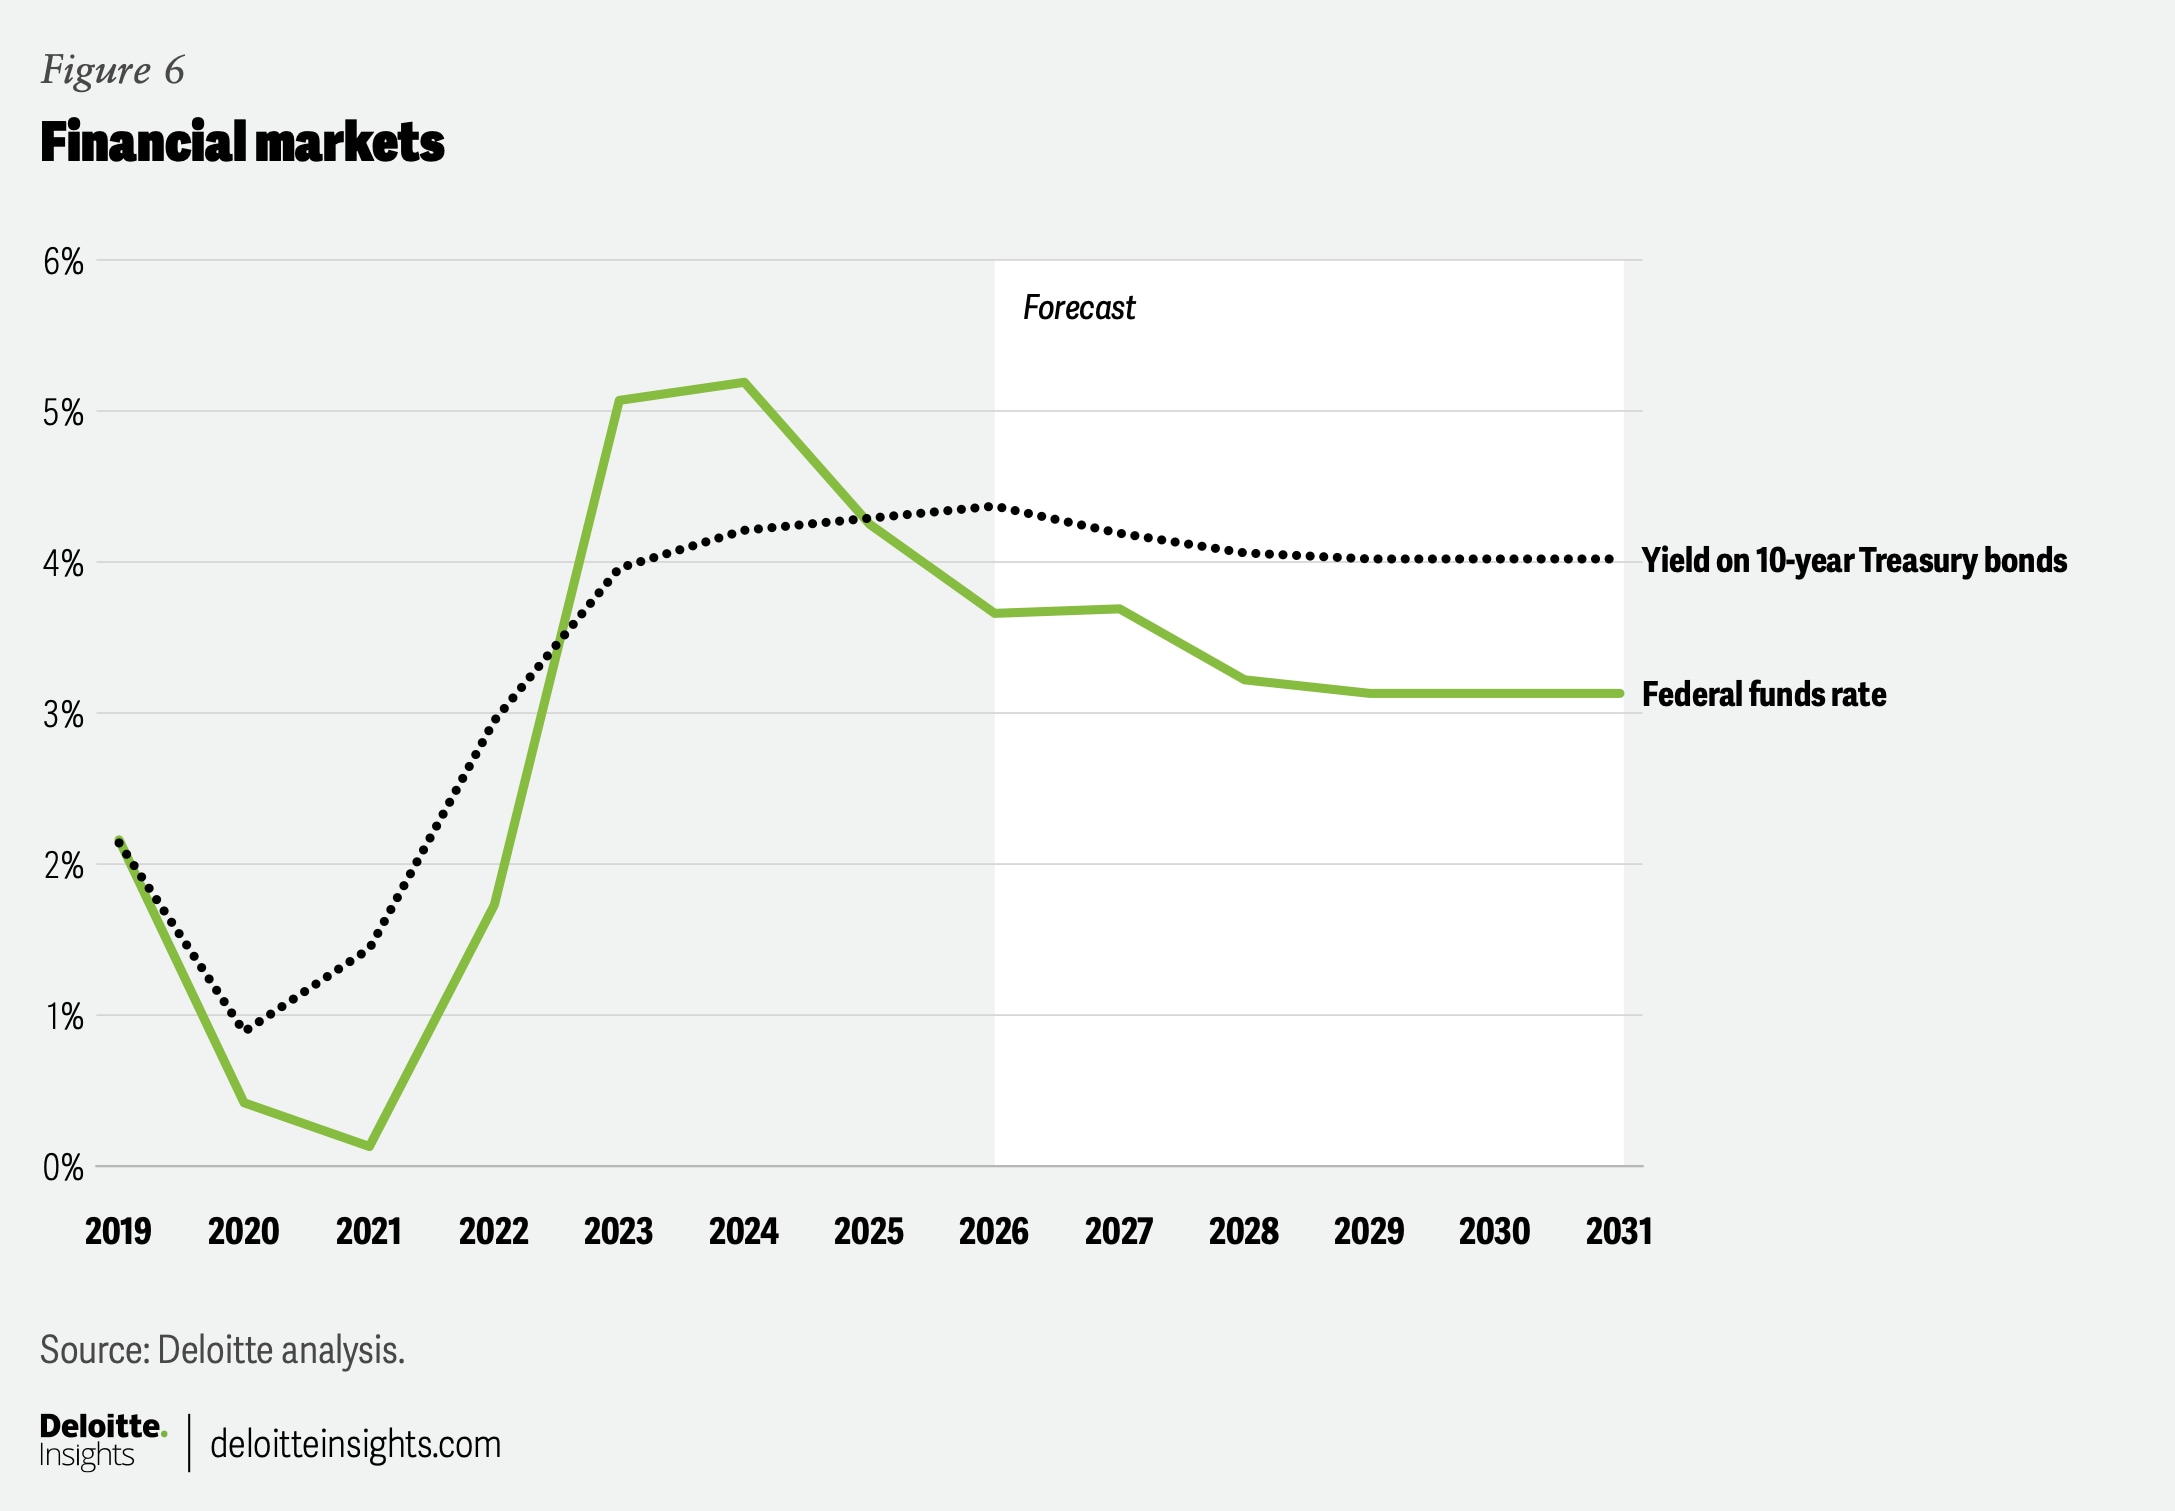
The US Federal Reserve delivered three quarter-point interest rate cuts in the second half of 2025. With inflation moving higher this year, along with oil prices, and a strengthening of the labor market, we now expect the Fed to raise interest rates before the end of the year. The Fed is then expected to begin cutting rates again before the end of 2027.
With inflation rising and financial markets expecting a more hawkish Fed, longer-term interest rates have moved higher. For example, the 10-year Treasury yield was up more than 20 basis points from its January 2026 average as of the time of writing. The 30-year Treasury bond yield was up about 15 basis points over the same period.
Much of the rise in yields is due to expectations of higher inflation. However, bond investors are also increasingly concerned about the sustainability of US debt. Notably, the real yield on the 30-year Treasury, which strips out the inflationary effect, was up more than 10 basis points compared with the January 2026 average. Higher long-term yields limit the stimulative effect of the Fed’s prior monetary easing cycles. The interest rate on the 30-year fixed-rate mortgage was up about 50 basis points since the conflict in the Middle East began, adding clear downward pressure on the housing market and related spending.
Stock markets continue to show considerable strength, with the S&P 500 stock price up more than 25% year on year at the time of writing.12 Optimism around the potential of AI has boosted earnings and raised expectations of future growth. With price-to-earnings ratios still quite high and investors skittish about AI investments, we expect that equity price gains will moderate a bit this year. Equity price growth has likely fueled consumer spending over the last few quarters, particularly at the higher end of the income and wealth distribution. Slower equity price gains this year will likely result in softer consumer spending growth.
Appendix
By
Michael Wolf
Rohini Sanyal
Editorial (including production and copyediting): Arpan Saha, Preetha Devan, Pubali Dey, and Anu Augustine
Design: Harry Wedel
Audience development: Pooja Boopathy
Cover image by: Rahul Bodiga
Knowledge services: Rohan Singh
Visit the Deloitte Global Economics Research Center
Access more insights for the consumer spending, housing, business investment, globalization & international trade, fiscal & monetary policy, sustainability, equity, & climate, labor markets and prices & inflation sectors.