Climbing US government debt casts a fiscal shadow
The September 2025 Economics Insider analyzes the surge in US government debt and the risks it can pose for investor sentiment, monetary policy, and the economy
US$36 trillion and counting—that’s the total outstanding federal government debt in the United States.1 It’s nearly 20% higher than the nation’s nominal GDP and larger than the combined output of the next four biggest economies.2 Unsurprisingly, concerns around debt sustainability are mounting—among both investors and onlookers, both domestically and abroad—given the role of US Treasury bonds as the world’s primary safe asset.3 These worries come at a time when US trade protectionism is also rising.
The strong pace of debt accumulation, without solid fiscal consolidation, is worrying. The latest budget bill, for example, may only widen the deficit and further add to this debt.4 The composition of the debt also leaves the government vulnerable to any rise in bond yields, which would in turn raise interest payments. And while rising tariffs may boost government revenues and offer some fiscal relief, frequent policy shifts risk undermining global confidence in US Treasuries and the dollar.
US debt accumulation has been gathering pace
The scale and pace of US debt accumulation have both been striking (figure 1). In 2000, total government debt stood at US$5.7 trillion, or 55% of GDP. By the second quarter of 2025, it had risen more than sixfold to US$36.2 trillion, or 119% of GDP, growing at an average of 8% annually.5 That’s well above the 4.6% average growth of nominal GDP recorded over the same period.6 The rising debt-to-GDP ratio shows that the ability of the US government to service its debt has gone down over time.
Table of Contents
- US debt accumulation has been gathering pace
- Rising share of marketable debt heightens fiscal risks
- Shifts in US policy may have an impact on global investors
- Risks to the smooth conduct of monetary policy
- Tariffs bring some relief but may raise economic costs
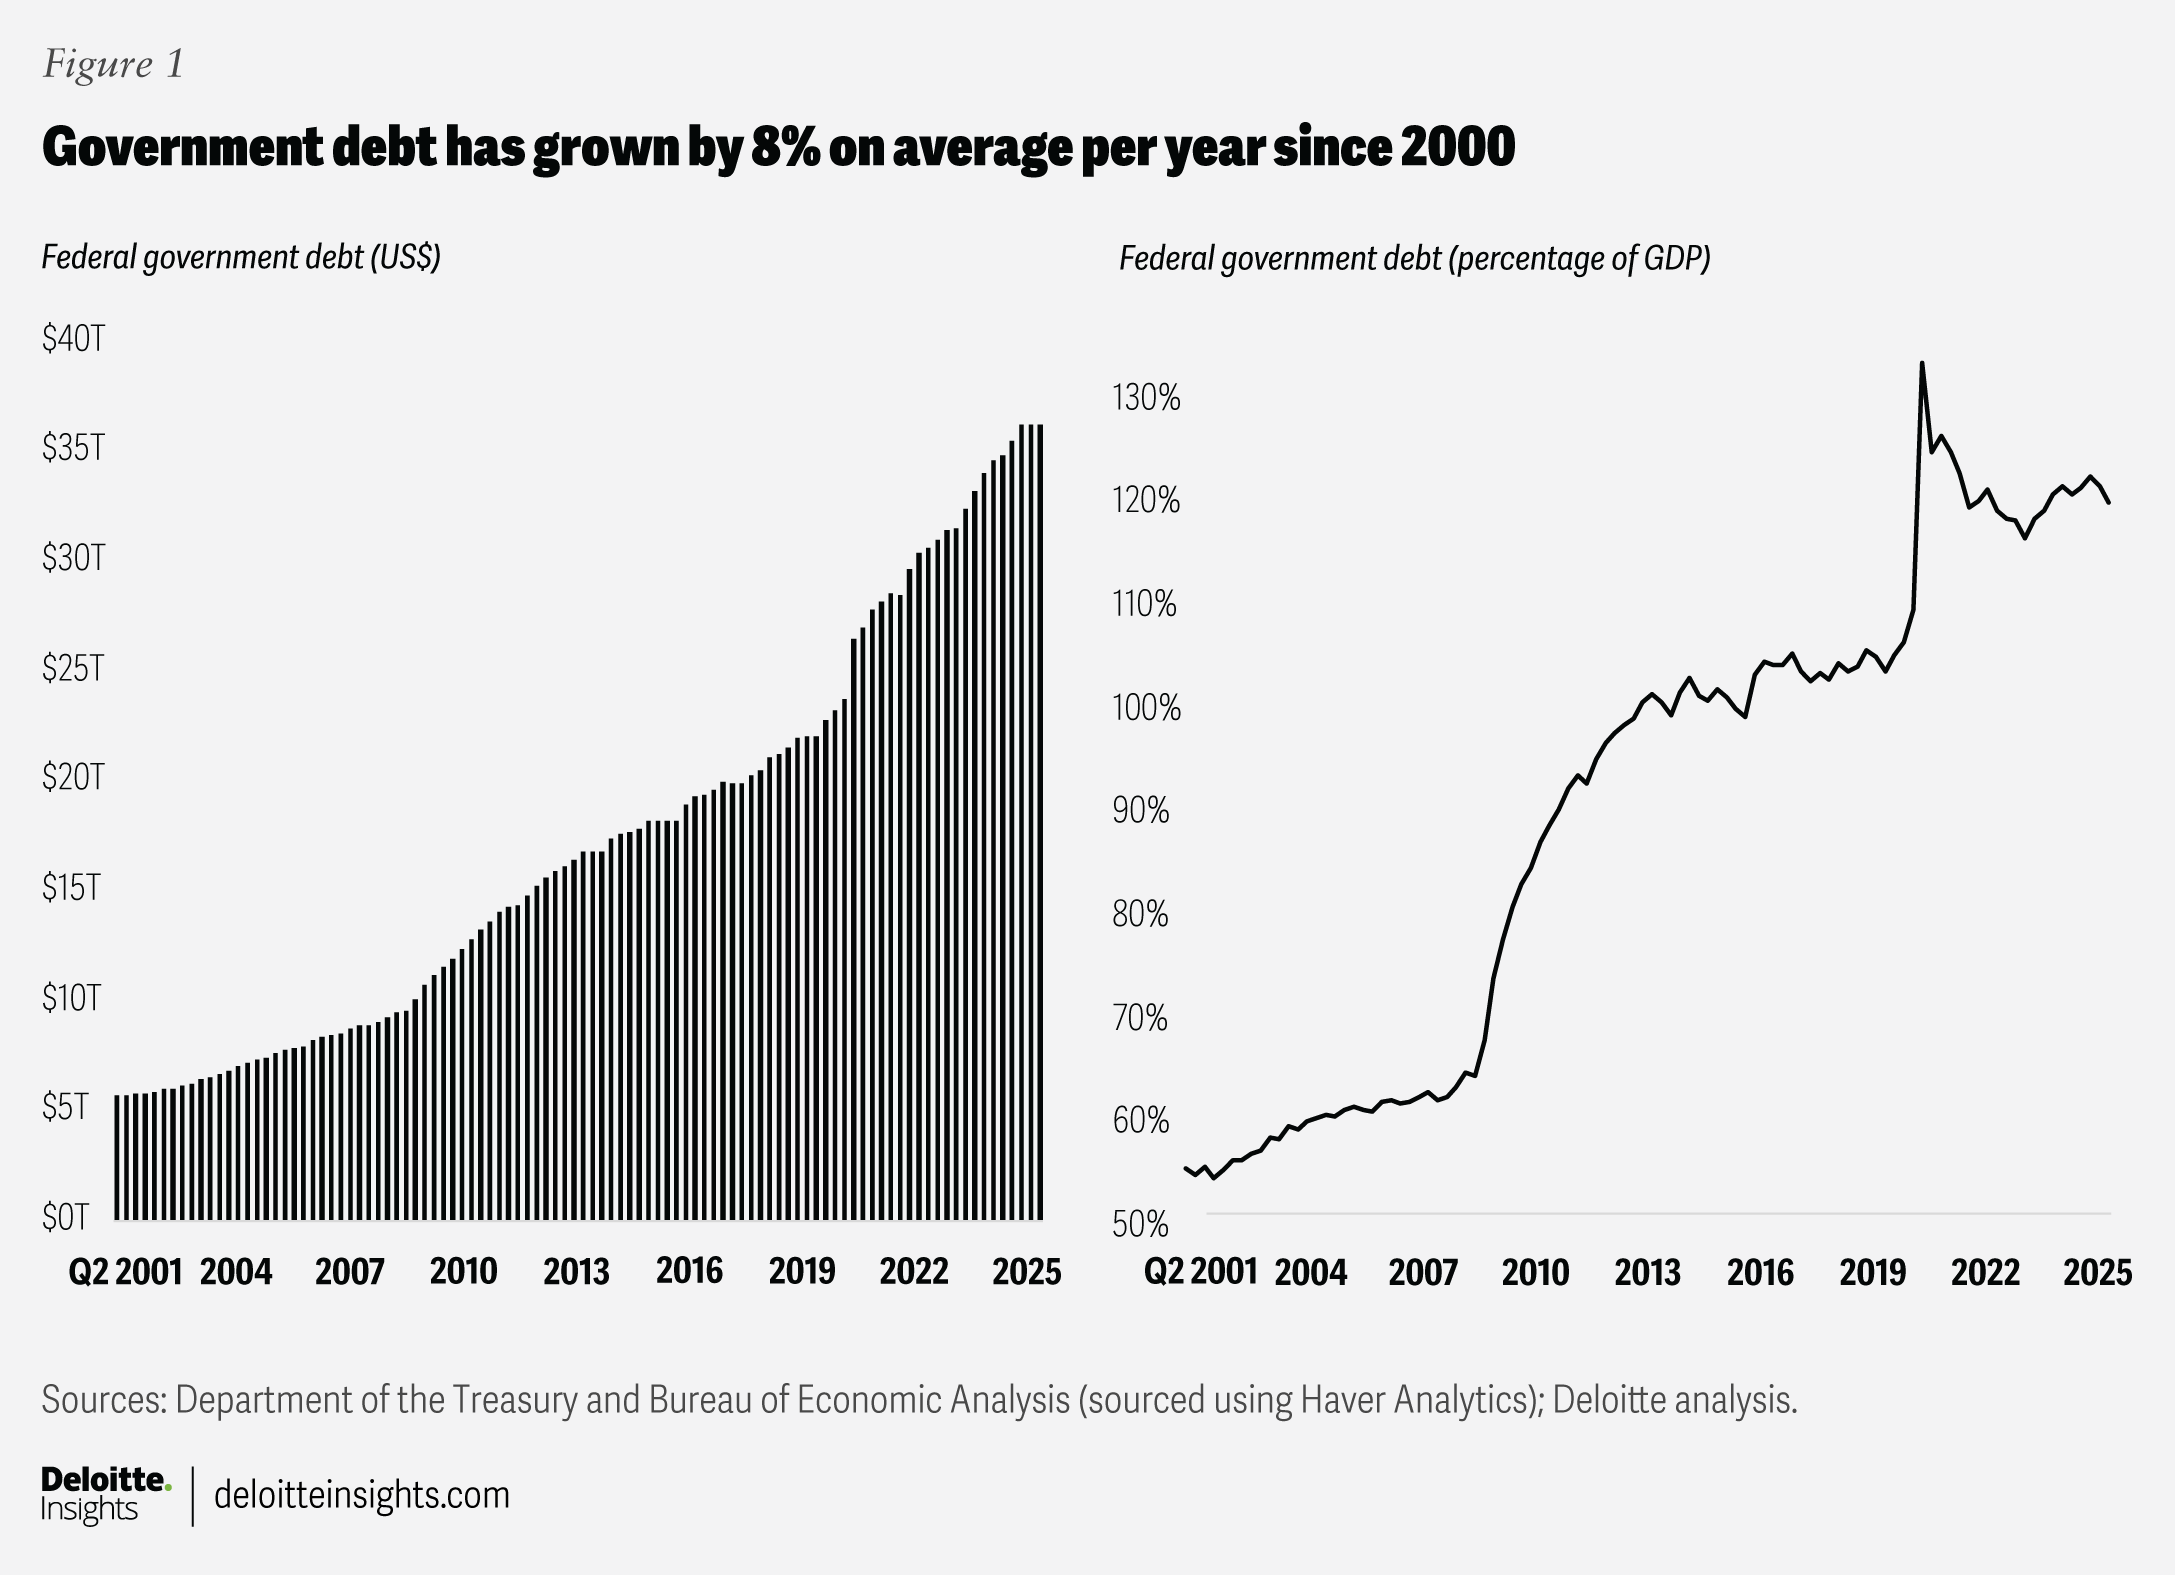
Since 2000, the surge in government debt was most pronounced during two periods: The first was between 2008 and 2010, when debt rose by about 15% a year on average as the federal government stepped in to support the economy during the global financial crisis. The second was in 2020, when government support to businesses and households surged during the COVID-19 pandemic. That year, debt rose by 19.6%, the fastest pace of annual increase since World War II.
Looking ahead, the US Congressional Budget Office (CBO) projects government debt to reach 135% of GDP by 2035, leaving fiscal management highly sensitive to market shifts.7 The 2022 gilt crisis in the United Kingdom—where unfunded tax cuts drove yields up more than 150 basis points in days and resulted in intervention by the Bank of England—serves as a reminder of how quickly confidence in government finances can erode.8
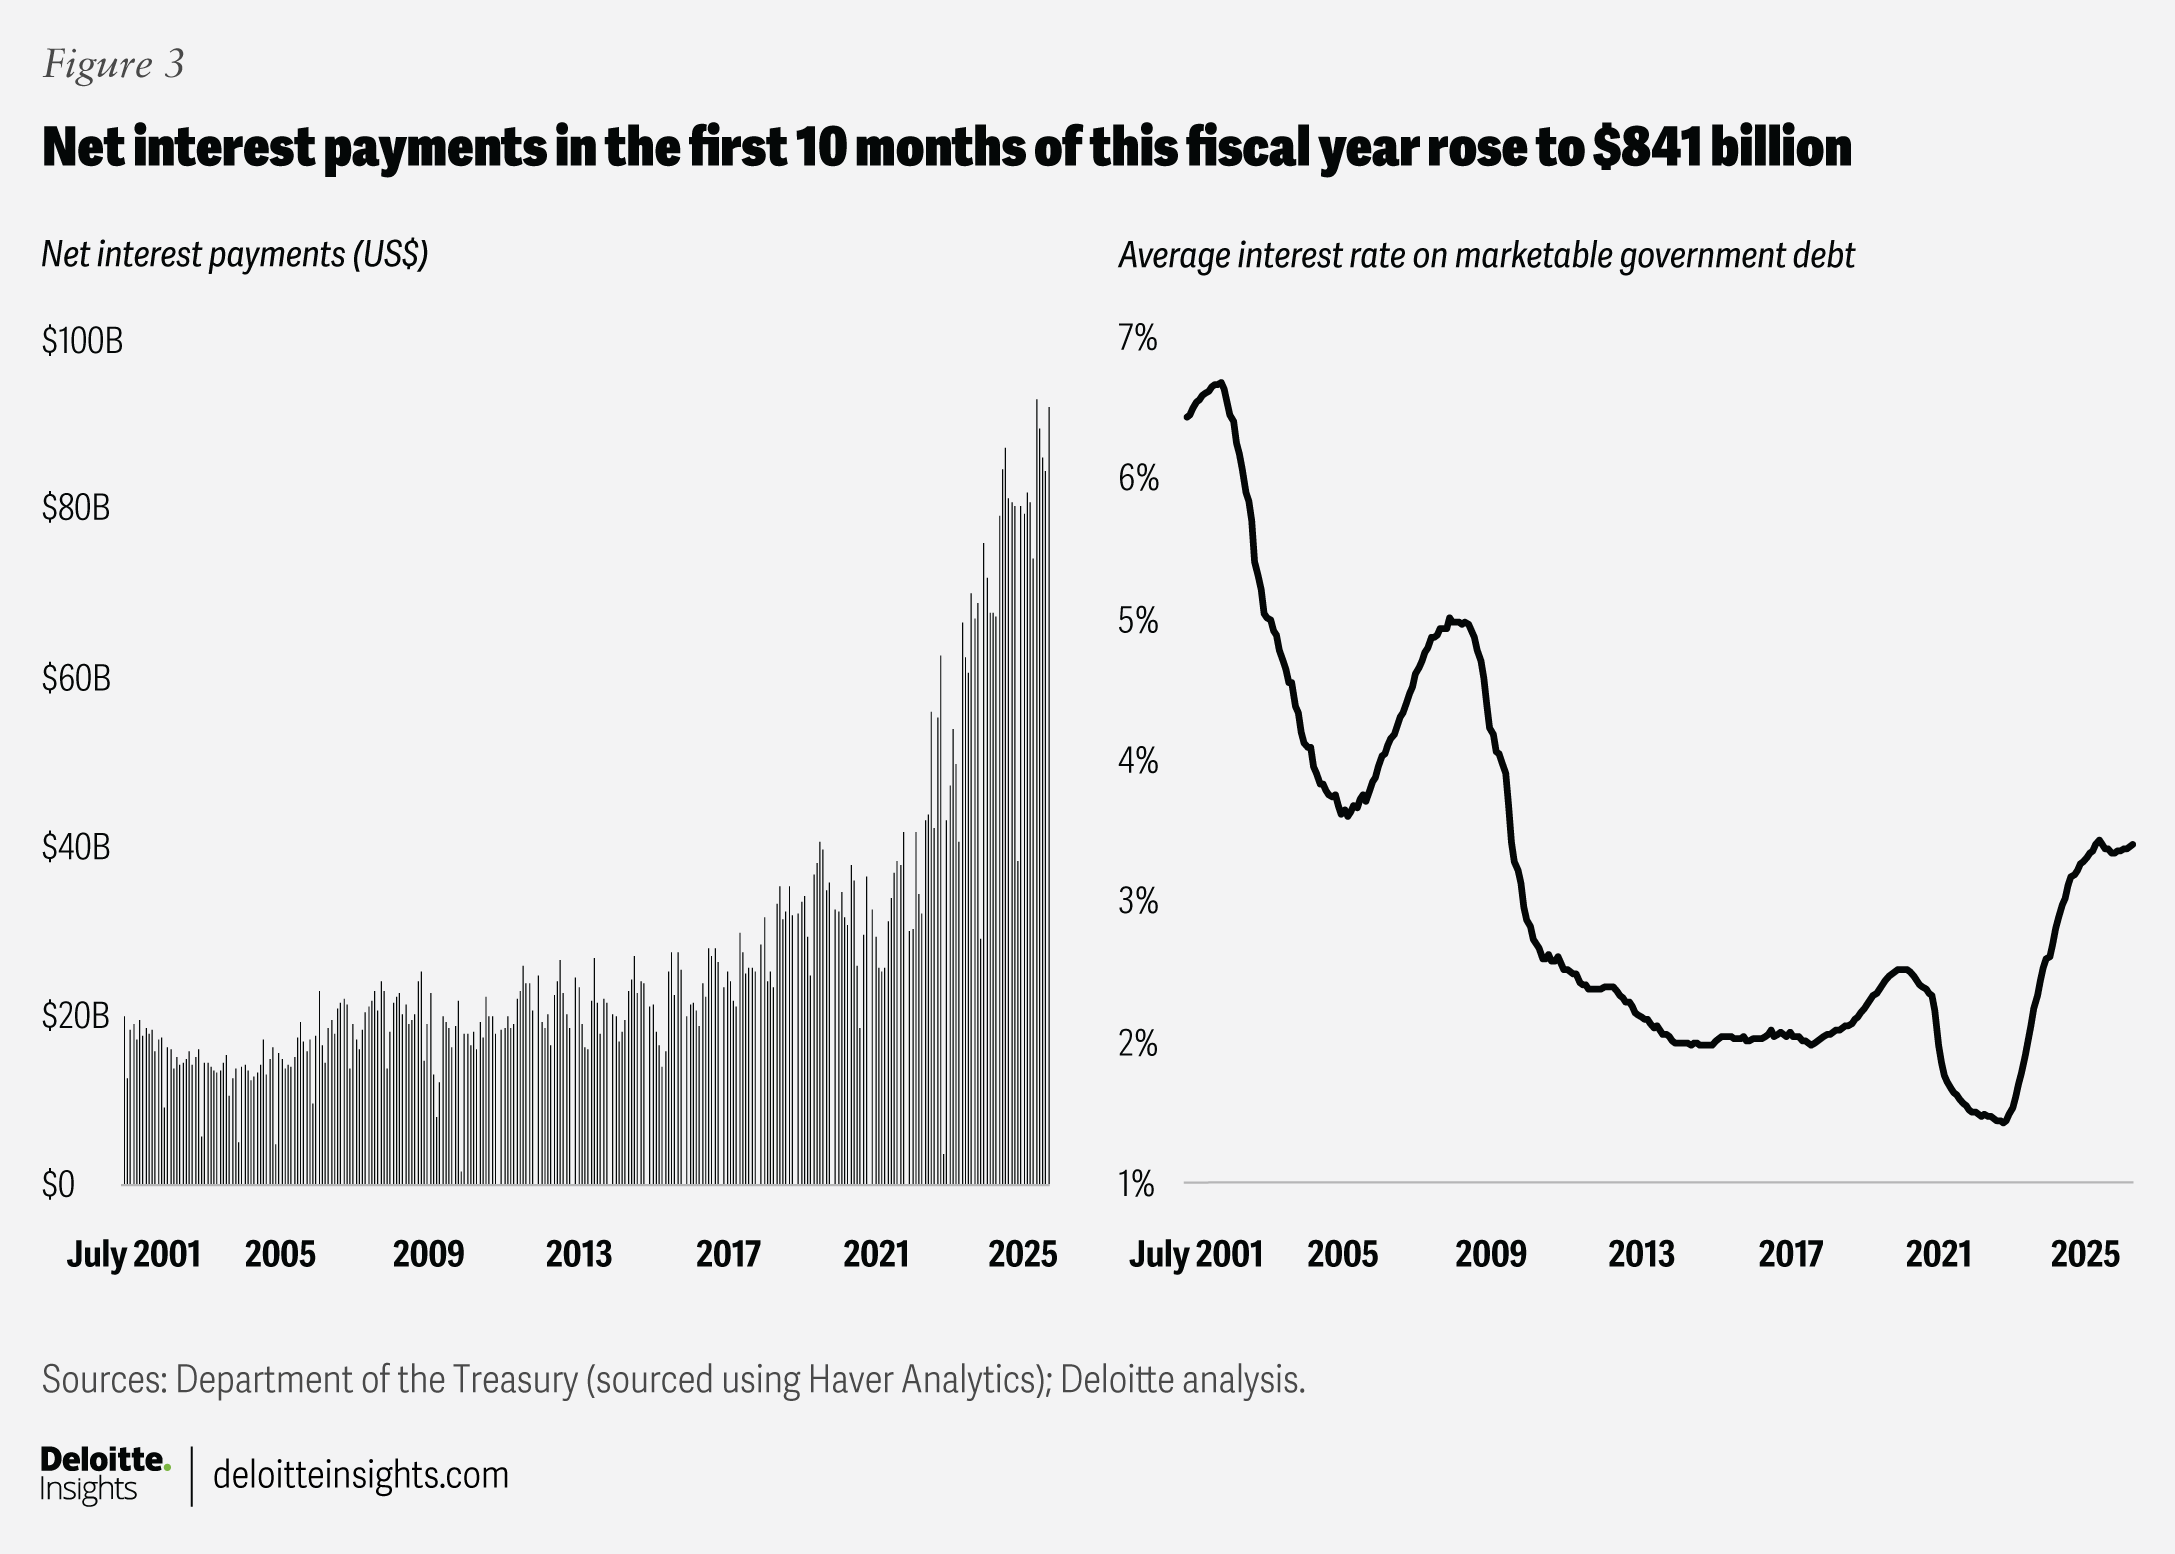
Payments to holders of market-held debt comprise cash outflows for the government. Through the first 10 months of fiscal year 2025, net interest payments reached US$841 billion—already exceeding Medicaid and second only to Social Security.9 Rising interest rates have also added to these interest payments. In July 2025, the average interest rate on marketable debt was 3.4%—more than double the level seen in early 2022 and the highest since late 2008 (figure 3).10 The CBO expects annual payments to reach US$1.8 trillion by 2035, totaling US$13.8 trillion over the next decade.11
Refinancing pressures compound the problem of fiscal management. By the end of 2025, about a third of marketable debt, worth US$9.2 trillion, would have matured, with a further US$9 trillion maturing in 2026.12 This large increase in refinancing requirements is due to a surge in short-term borrowing during the pandemic.13
On a positive note, however, the maturity of US marketable debt has been going up. In June 2025, the weighted average maturity of marketable debt was about 72 months—up from 62 months in June 2000 and far above the low of 49 months seen in March 2009.14
Shifts in US policy may have an impact on global investors
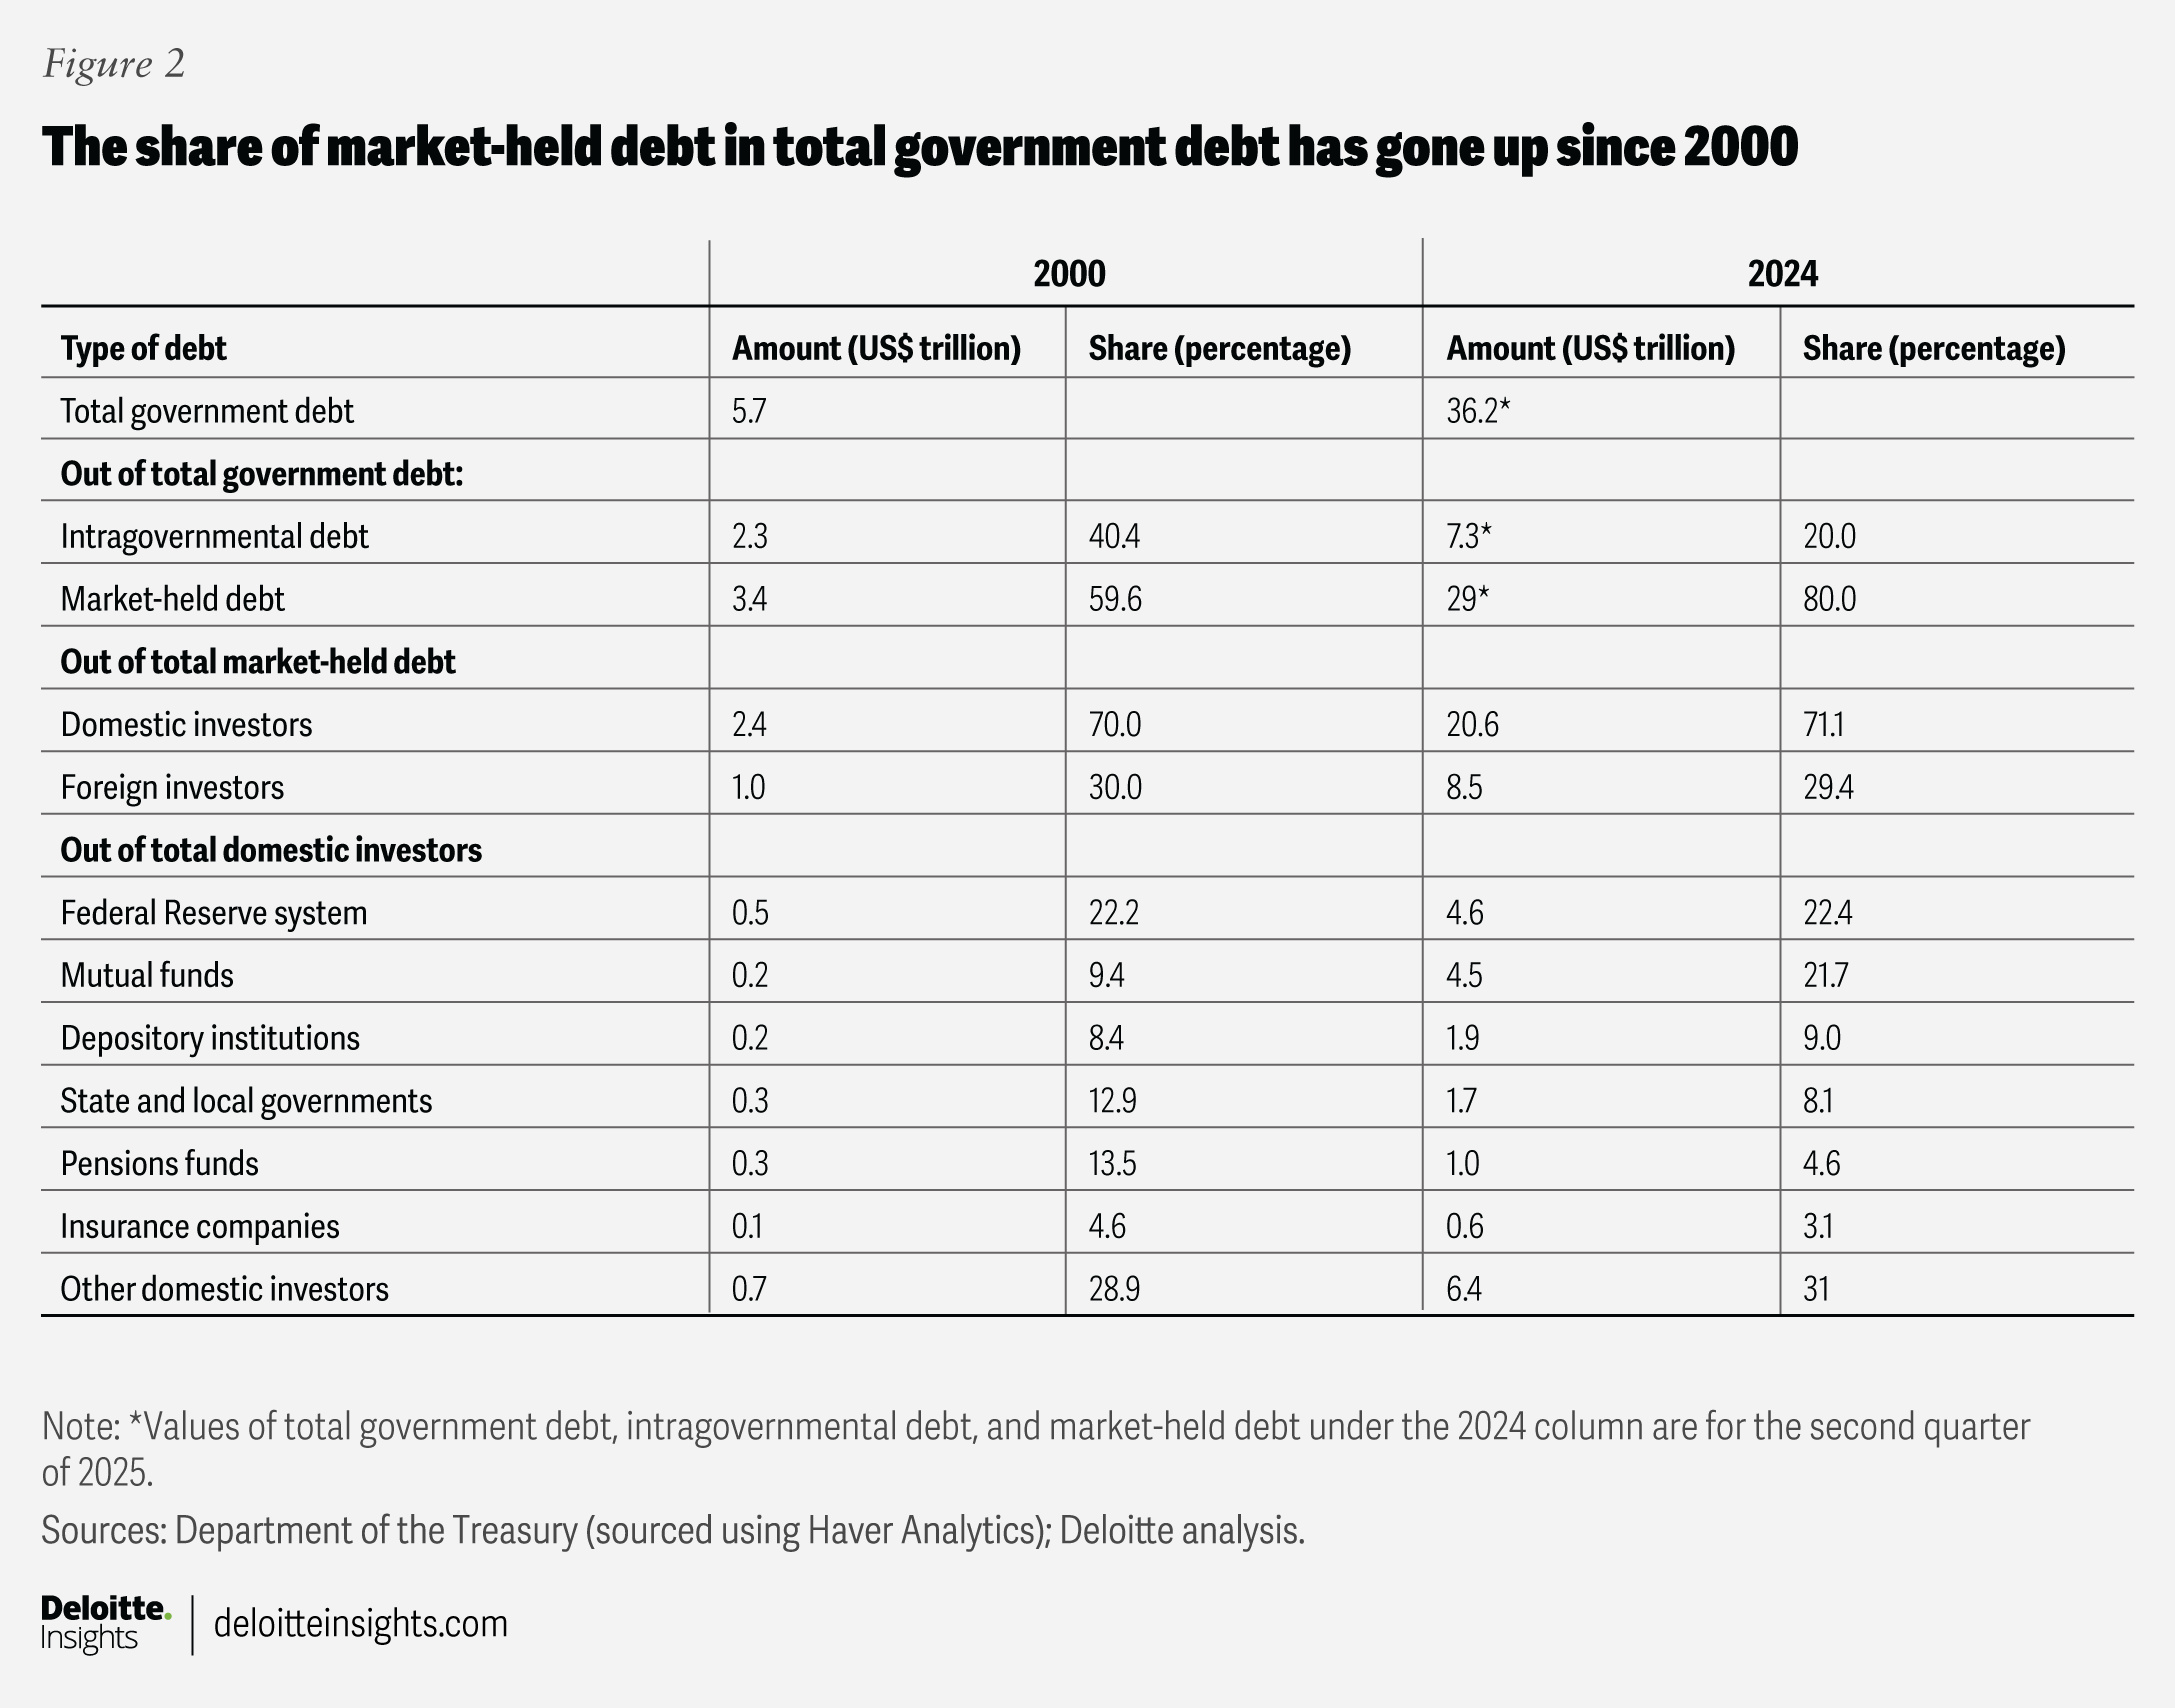
Foreign investors held about US$8.5 trillion of US Treasury bonds in 2024, accounting for 29% of the total. Japan is the largest holder at US$1.1 trillion, followed by China at US$800 billion, which is down from a peak of US$1.3 trillion it held in 2013.15 Other major holders include the United Kingdom, Canada, and Luxembourg. Foreign holders of US Treasuries include central banks and private investors like asset managers, banks, and pension funds.
A lack of fiscal consolidation in the United States, widespread tariff hikes, and uncertainty about the final tariff framework have raised risks for foreign investors. For example, tariffs on two key allies—Japan and the European Union—have been hiked sharply to 15%.16
Normally, these tariffs should have led to gains for the US dollar. Instead, the greenback has declined 6.9% against the yen and 12.7% against the euro since January.17 This trend of weakening reflects reduced confidence in the dollar: Any dip in the US dollar reduces the value of dollar-denominated holdings for foreign investors, thereby raising risks further.
These changes have amped the lure of gold, with foreign central banks ramping up purchases since 2022 and their net purchases amounting to 410 tons in the first half of 2025.18 Hence, the share of gold in global reserve assets has risen to about 20%—second only to the share of the dollar—pushing the euro into third place.19
For the United States, any global shift away from US Treasuries will be concerning. After all, US domestic savings of US$5.5 trillion in the second quarter of 2025 were well short of the country’s investment needs of US$6.5 trillion.20 This gap has widened over the years, with foreign inflows covering the shortfall. If demand for US Treasuries weakens globally, yields will have to rise to attract more capital, or investment in the economy will have to come down.
Risks to the smooth conduct of monetary policy
The role central banks play during times of economic and fiscal volatility has risen in importance since the global financial crisis of 2007 to 2009. In the United States, the Fed initiated asset purchases (quantitative easing or QE) during the last two recession phases. Due to QE, the Fed’s holdings of US Treasuries more than tripled between January 2009 and June 2011 and rose another 125% between February 2020 to February 2022, making the Fed the largest domestic holder of marketable US government debt (worth US$4.6 trillion). This may lead to three major risks.
First, the scale of the Fed’s Treasury holdings raises concerns of “fiscal dominance,” where central banks tune monetary policy to support fiscal sustainability, thereby undermining their independence and denting investor confidence.21 Recent government efforts to intervene in the Fed’s monetary policy decisions have amplified this concern.22 While, historically, this was most evident during the wartime economy of the 1940s, the current scenario is much less scary.
Second, high government debt and the Fed’s major holdings leave less room for monetary and fiscal stimulus packages, should there be a recession. In 2007, government debt was 63.8% of GDP, allowing large stimulus packages and Fed intervention in the following two years. By 2019, debt had gone up to 107.7% of GDP; yet the government was able to deploy trillions in emergency relief during the pandemic, which has further eroded its fiscal cushion.
Finally, tariffs may further complicate matters for the Fed. The average effective US tariff rate rose to 18.6% in mid-2025—the highest in 90 years—from 2.5% in 2024.23 While tariffs will aid inflows for the government, they may raise costs, potentially leading to higher inflation and limiting the Fed’s ability to ease monetary policy.
Tariffs bring some relief but may raise economic costs
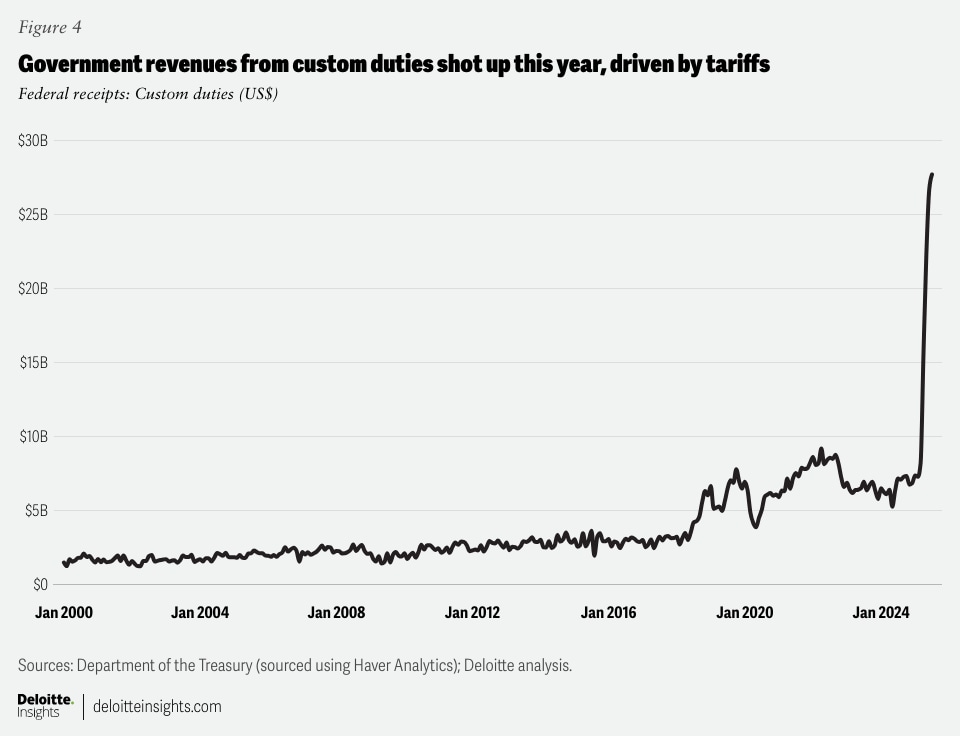
Tariffs will bring some fiscal relief. In July, customs duties stood at US$27 billion, much higher than the monthly average of US$6 billion in 2024 (figure 4). With tariff rates set to rise further, revenues, too, will likely go up.24 The Peterson Institute for International Economics estimates that tariffs will bring in US$3.9 trillion of revenue over the next decade.25 The CBO projects that tariffs imposed till August 2025 may reduce the primary deficit by US$3.3 trillion and interest costs by US$0.7 trillion over the next decade.26
These gains, however, may face headwinds from the wider economic costs of tariffs. Tariffs are taxes on imports, and these higher costs may be passed on to consumers or absorbed by businesses. Either way, they risk raising inflation, squeezing profit margins, and slowing economic growth. Moreover, the final US tariff framework is still unclear, especially given recent legal challenges.27 Given this uncertainty and other recent policy changes, Deloitte economists forecast economic growth to slow to 1.8% in 2025 and 1.4% in 2026—from 2.8% last year.28
By
Akrur Barua
The author would like to thank Rohini Sanyal and Ruhika Agarwal for their research contributions to this article, and Ira Kalish for his reviews.
Cover image by: Harry Wedel
Visit the Deloitte Global Economics Research Center
Access more insights for the consumer spending, housing, business investment, globalization & international trade, fiscal & monetary policy, sustainability, equity, & climate, labor markets and prices & inflation sectors.