Early signs of stress beneath strong US labor market data
The July Economics Insider examines sector imbalances and softening labor force signals that hint at cracks in the US job market
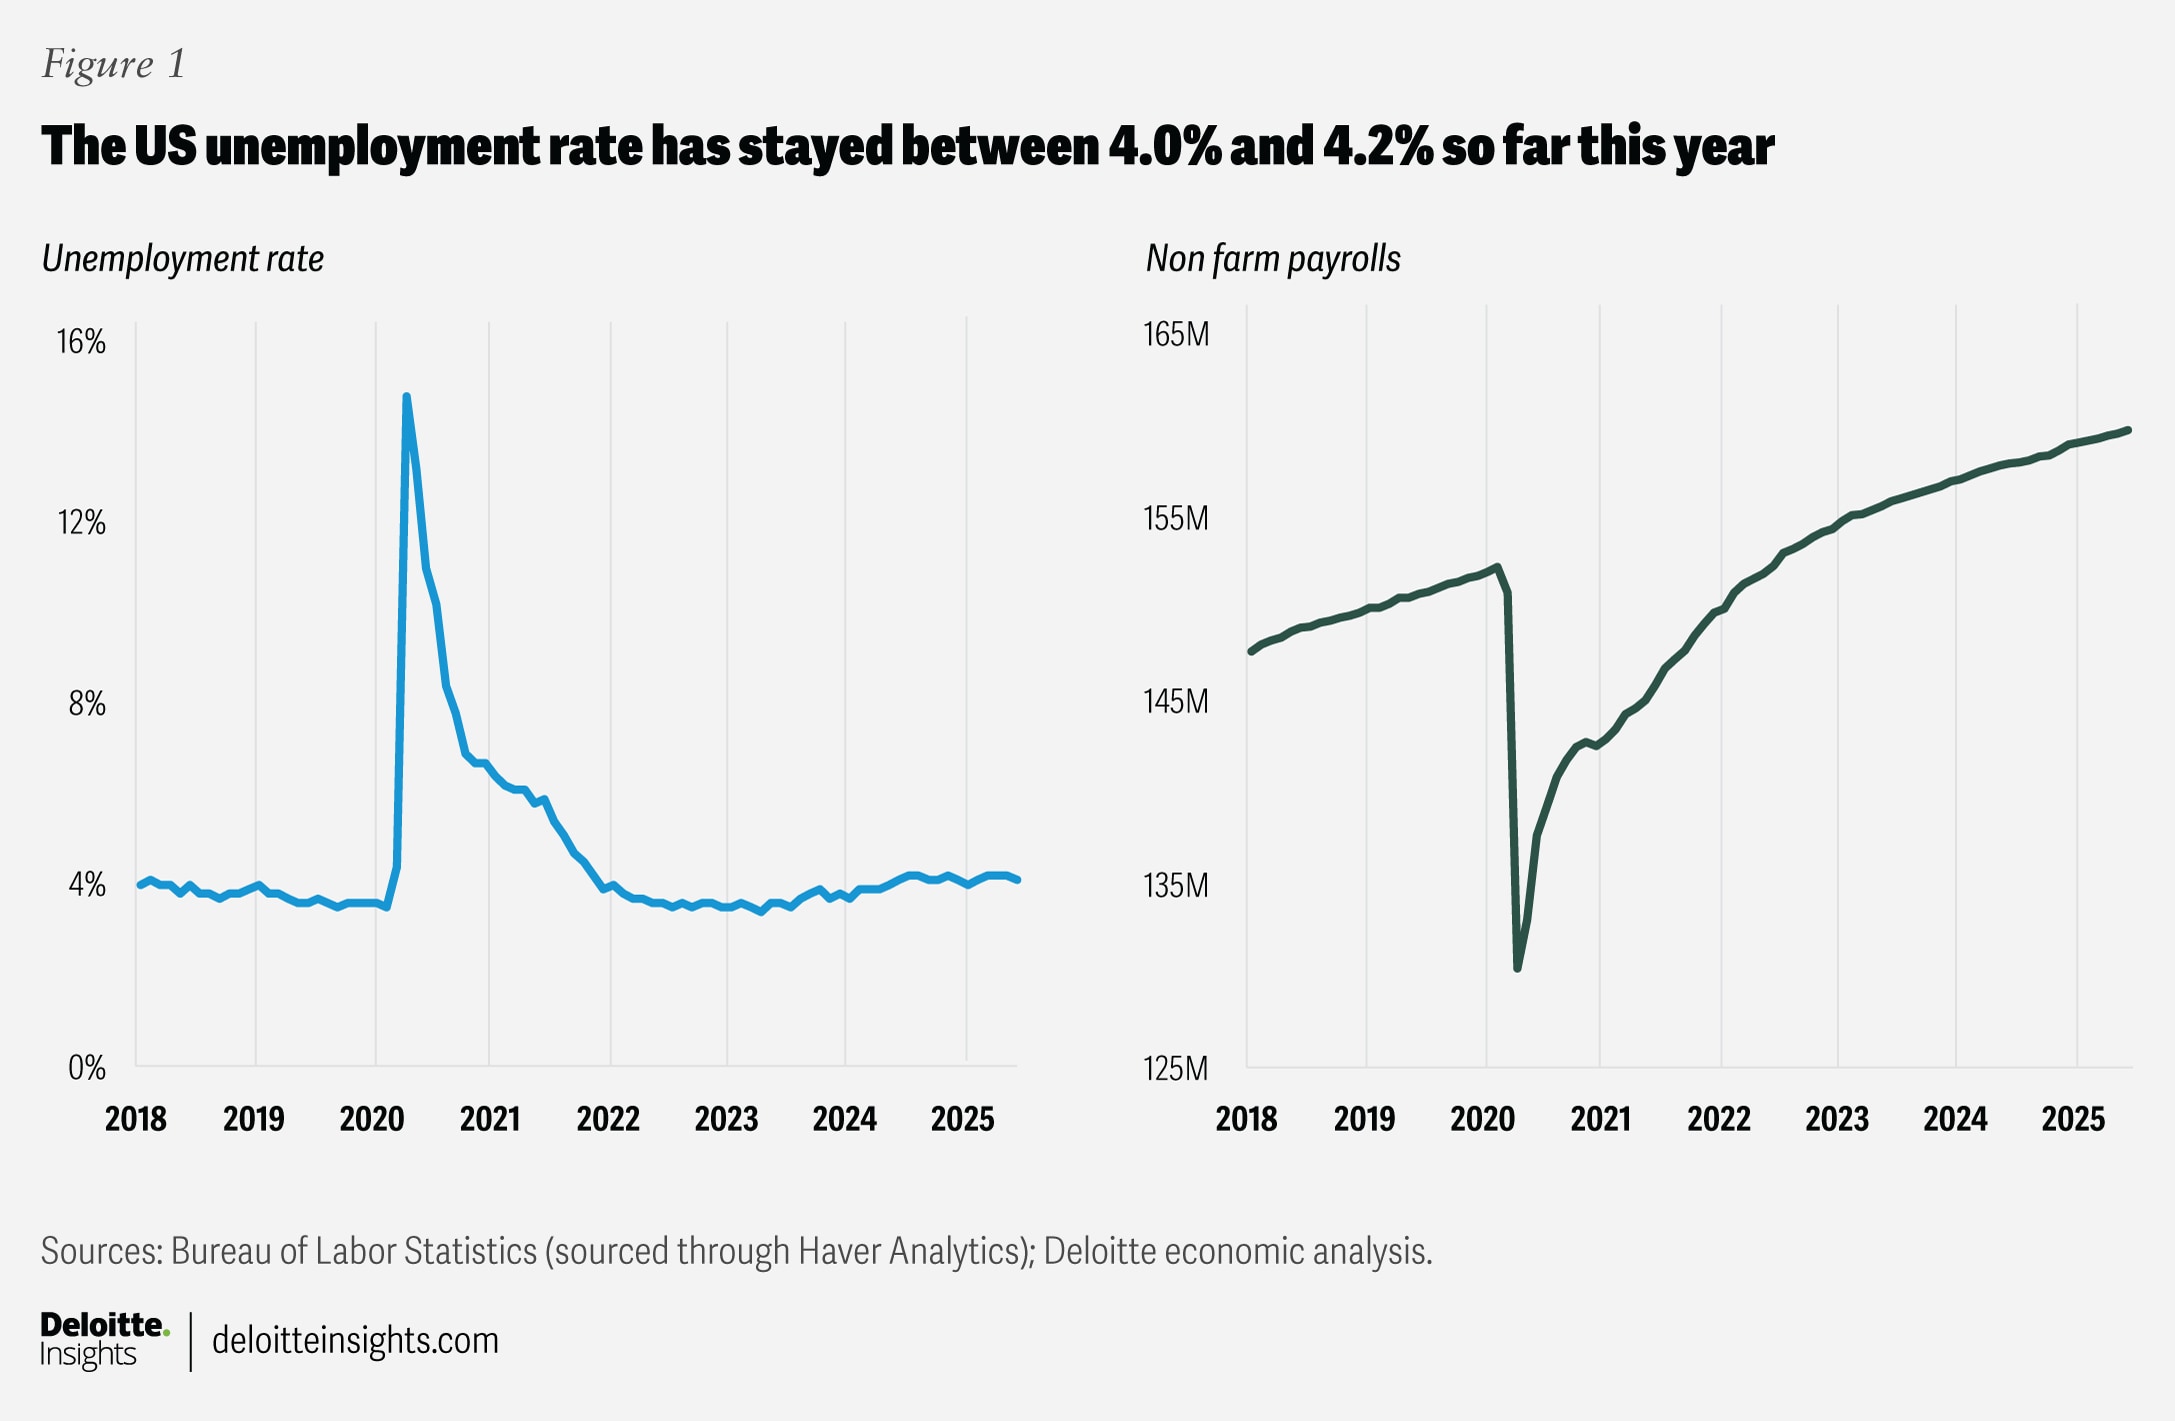
Amid rising uncertainty over tariffs, the US labor market appears to be holding its ground. Nonfarm payrolls rose by 147,000 in June, while unemployment declined slightly to 4.1%.1 This follows two and a half years of steady job growth, even as monetary policy remains tight.2 Wages too are rising briskly, with average hourly earnings growing faster than at any point in the decade before the pandemic.3 Beneath these trends, however, there are emerging signs of some slackening in the labor market, especially as the possibility of tariffs looms over inflation and economic growth.
First, much of the increase in jobs since 2023 has been concentrated in a few sectors, especially health care and social assistance, and leisure and hospitality. Second, although unemployment, including broader measures such as underemployment and the number of temporary workers, is relatively low, it has recently been edging up.4 Third, job opening and hiring rates, though still relatively stable, have slipped.5 These trends may worsen if relatively high tariff rates dent business investment and wider GDP growth.6 Finally, over the longer term, slow population growth and ageing7 will likely weigh on workforce growth and labor force participation.
Headline numbers show a resilient labor market
In the first half of 2025, total nonfarm payrolls have grown by an average of about 130,000 jobs per month. While that is lower than the average monthly gain of 168,000 in 2024, job growth is still healthy, given that the US economy appears to be operating close to its natural rate of unemployment,8 a level consistent with stable inflation. Both the National Bureau of Economic Research and the Congressional Budget Office estimate the natural rate of unemployment to be around 4.3%,9 which is close to where the actual unemployment rate has hovered this year—between 4% and 4.2% (figure 1).
Table of contents
- Resilient labor market
- Uneven job growth
- Signs of slackening
- Growth risk exposure
- Demographic pressures
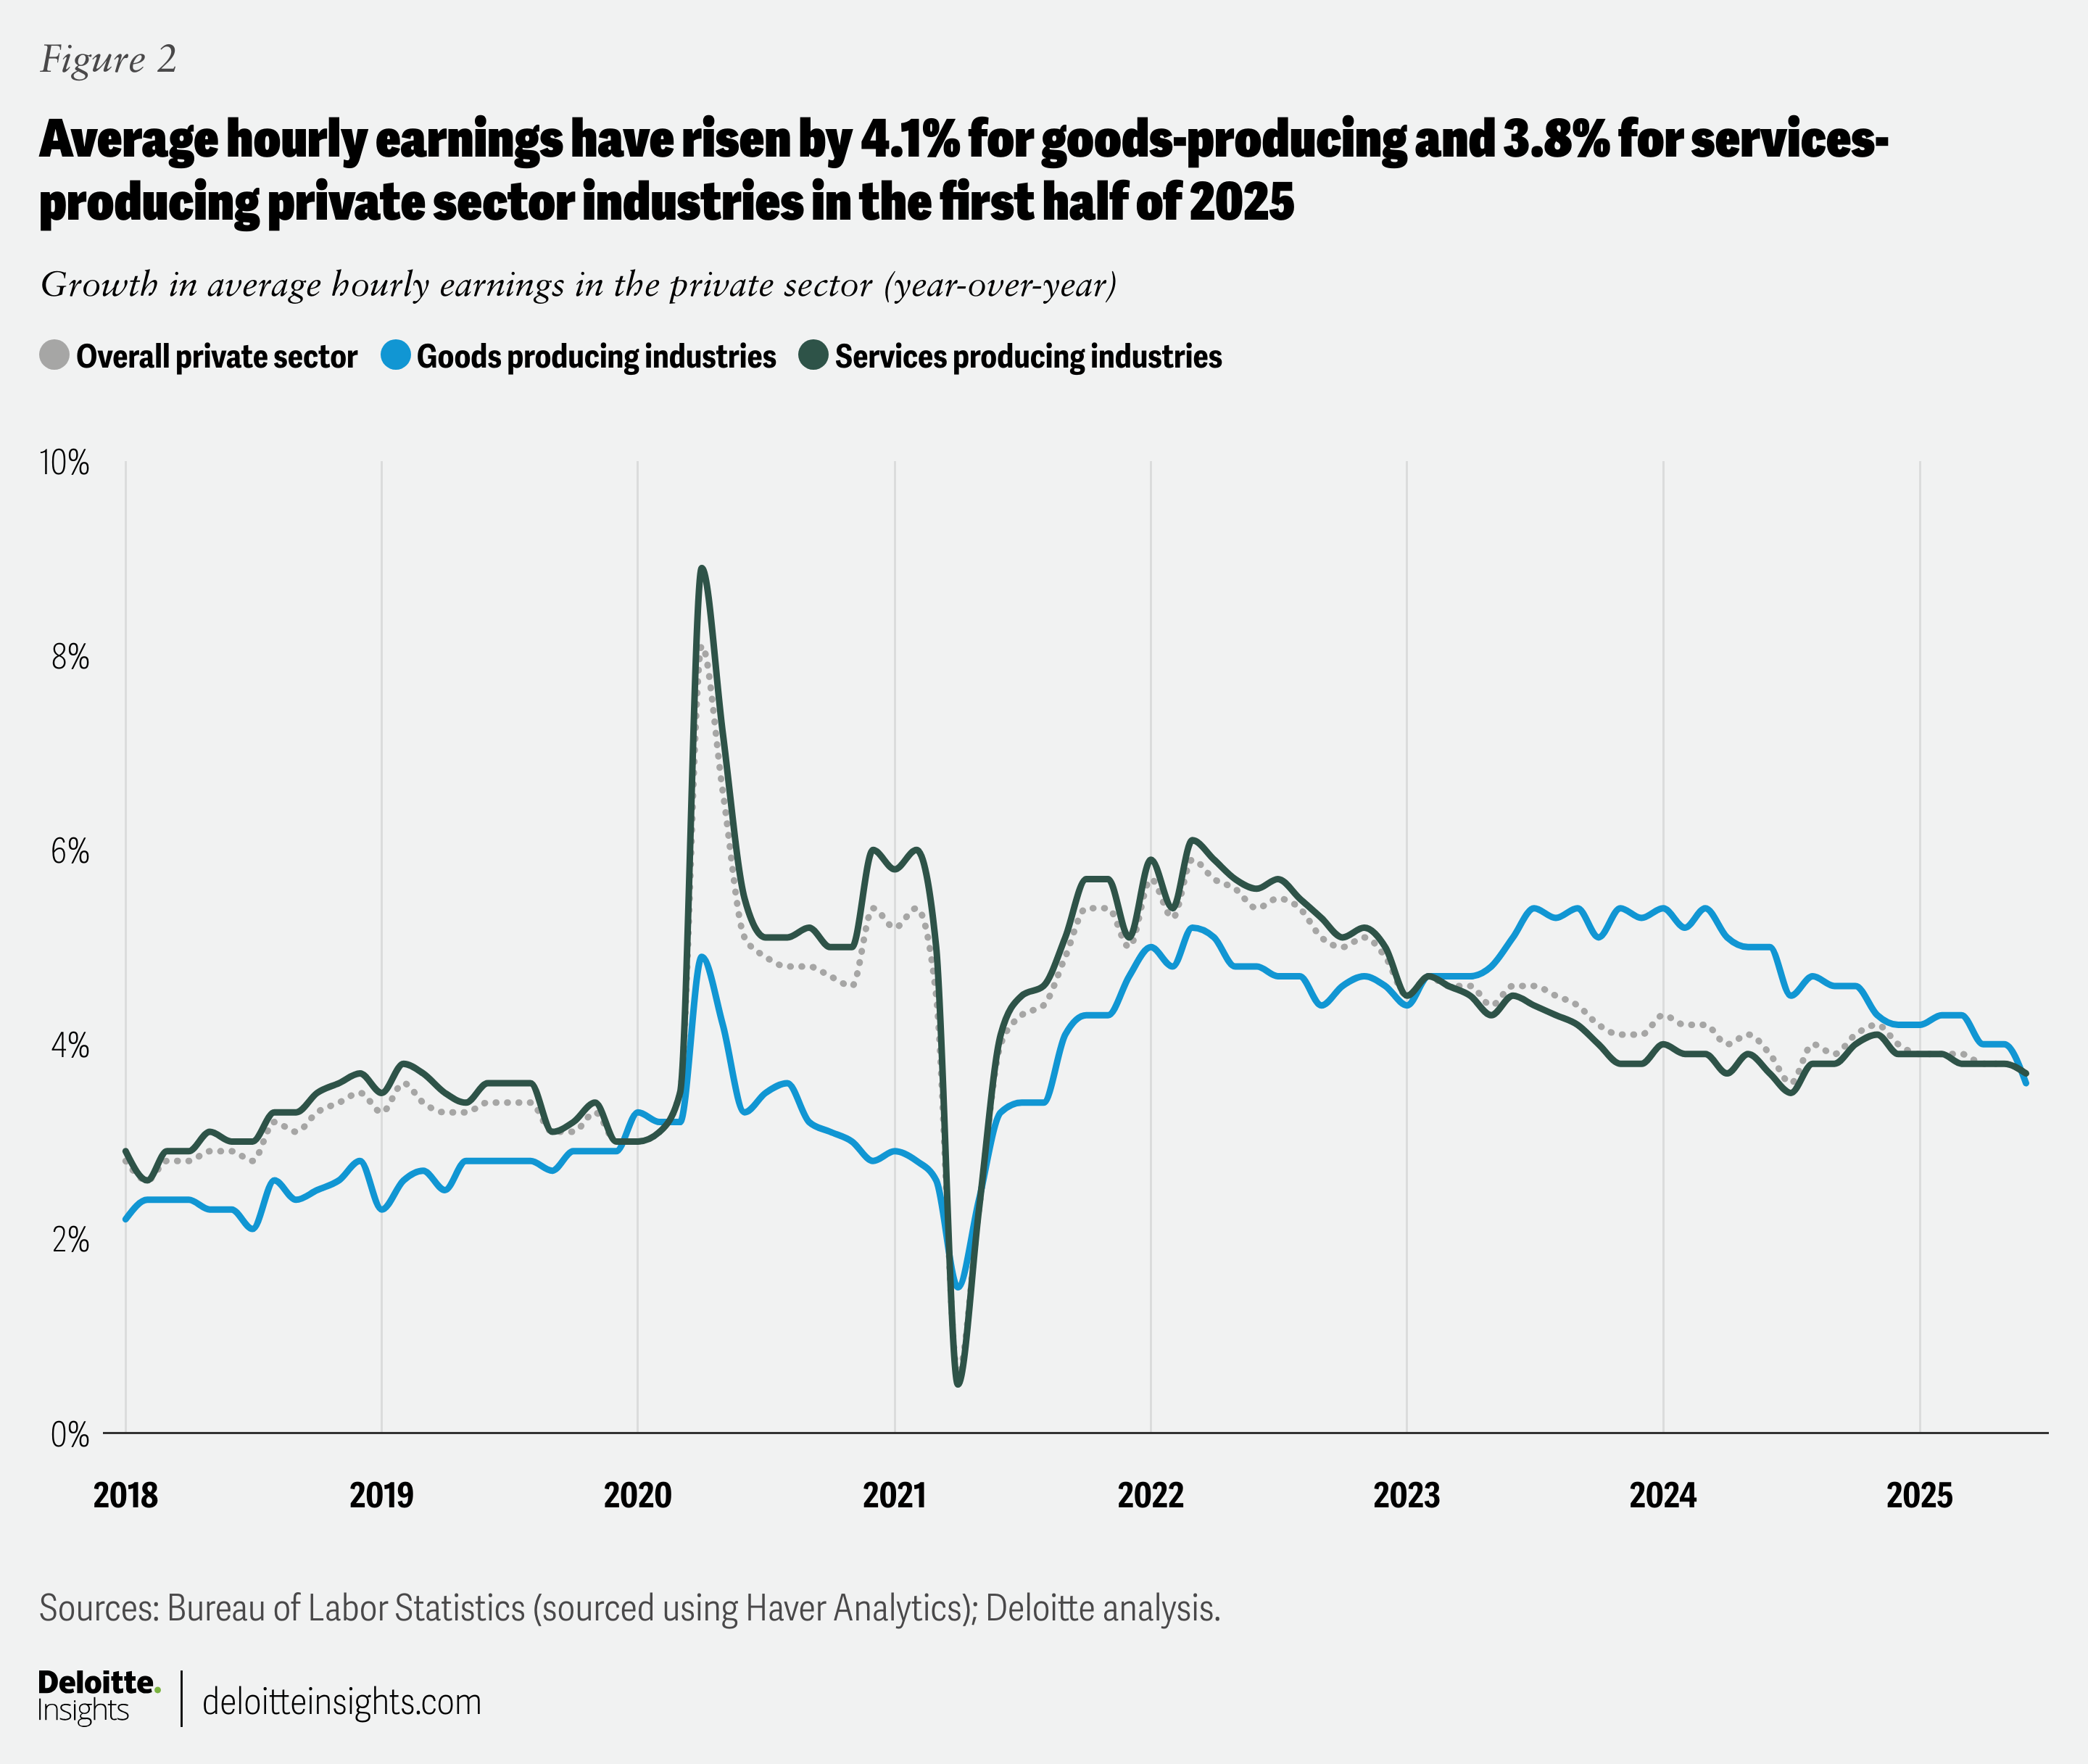
In line with a healthy labor market, wages continue to rise at a fast pace. Average hourly earnings in the private sector have grown by 3.9% this year, outpacing any annual increase in the previous decade. Wage growth remains elevated across both goods- and services-producing industries (figure 2).
But job growth hasn’t been uniform
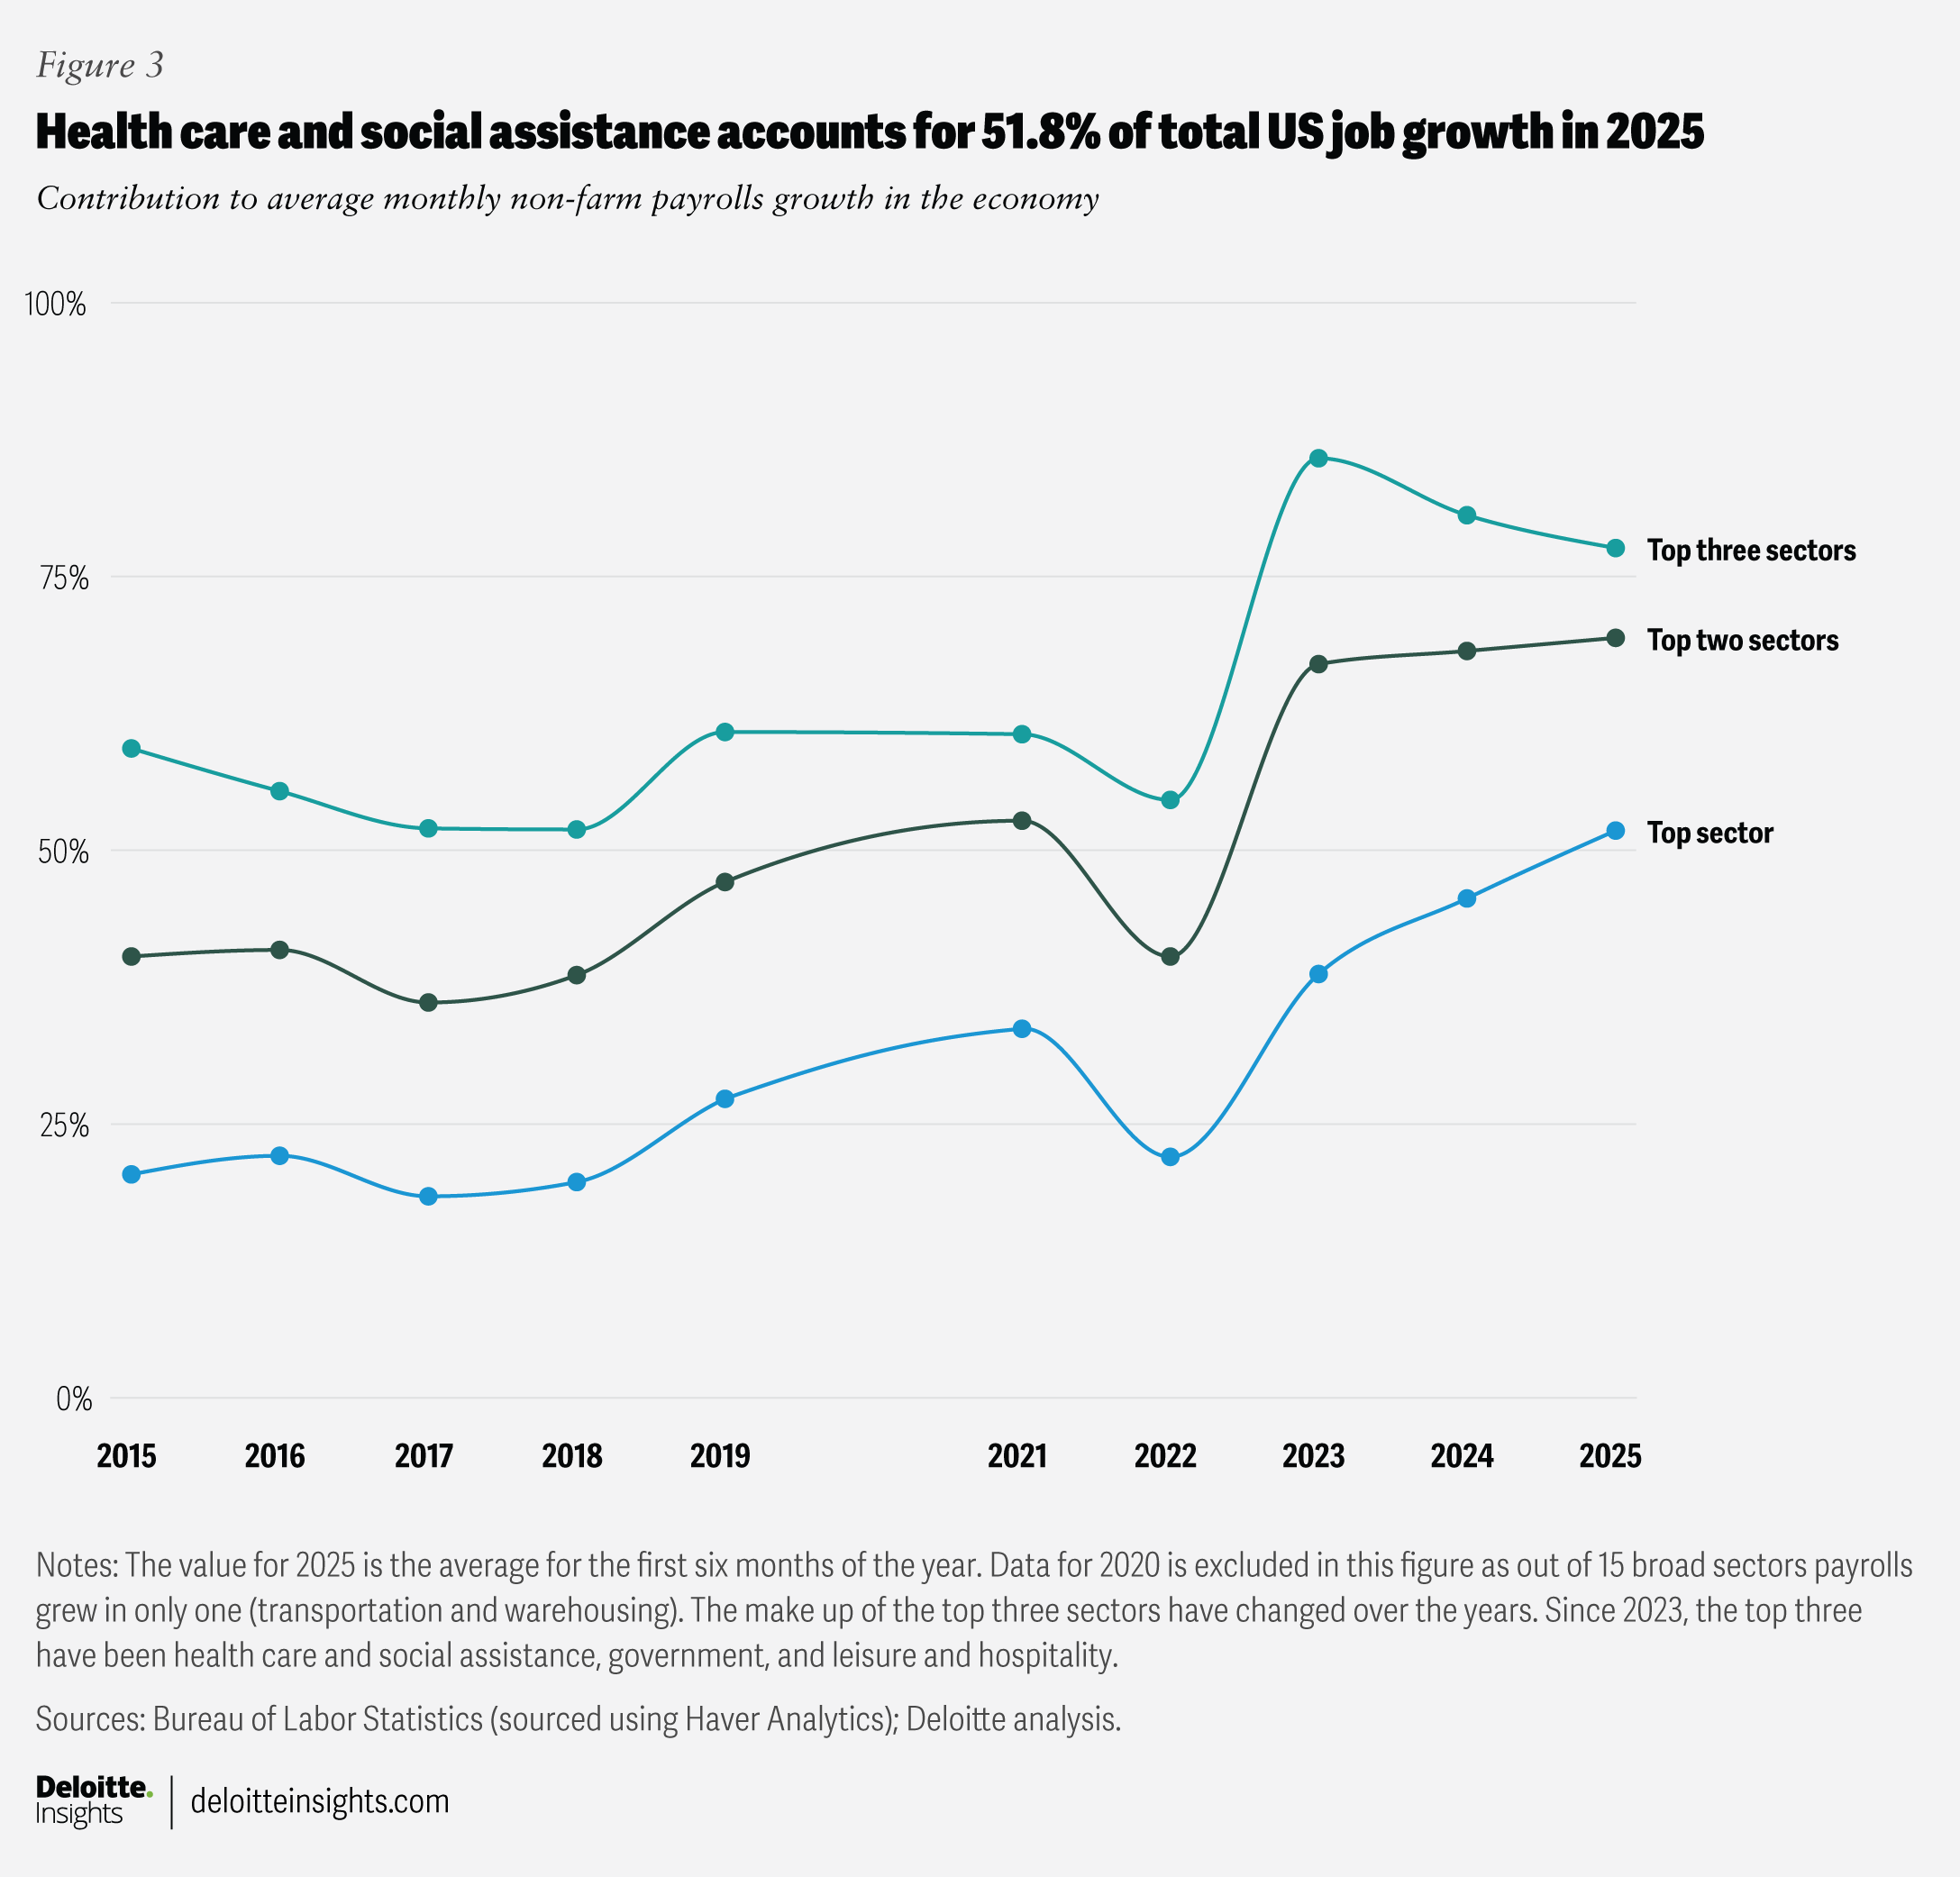
Headline numbers, however, mask some strains emerging in the labor market. Growth in nonfarm payrolls, for example, hasn’t been evenly spread out across all sectors. Since 2023, most job gains have come from just three of the economy’s 15 major sectors tracked by the US Bureau of Labor Statistics.10 Together, these three sectors have accounted for over 75% of total job growth, which is a much larger share than the 50% to 60% share typically seen for the top three sectors over 2021 to 2022 and for at least five years before the pandemic (figure 3). Of the three sectors driving job growth in the economy since 2023, two are in the private sector, namely, health care and social assistance, and leisure and hospitality. In fact, health care and social assistance accounts for more than half of the growth in total nonfarm payrolls so far this year.
The third big driver of jobs growth has been government, but with some caveats. Federal payrolls have declined by 66,000 in the first half of 2025 due to fiscal austerity measures. And while payrolls have gone up for state and local governments, much of this increase came in June. Notably, in state government, payrolls rose by 47,000 in June, primarily due to an increase of 40,000 in education, which is likely to be temporary.11
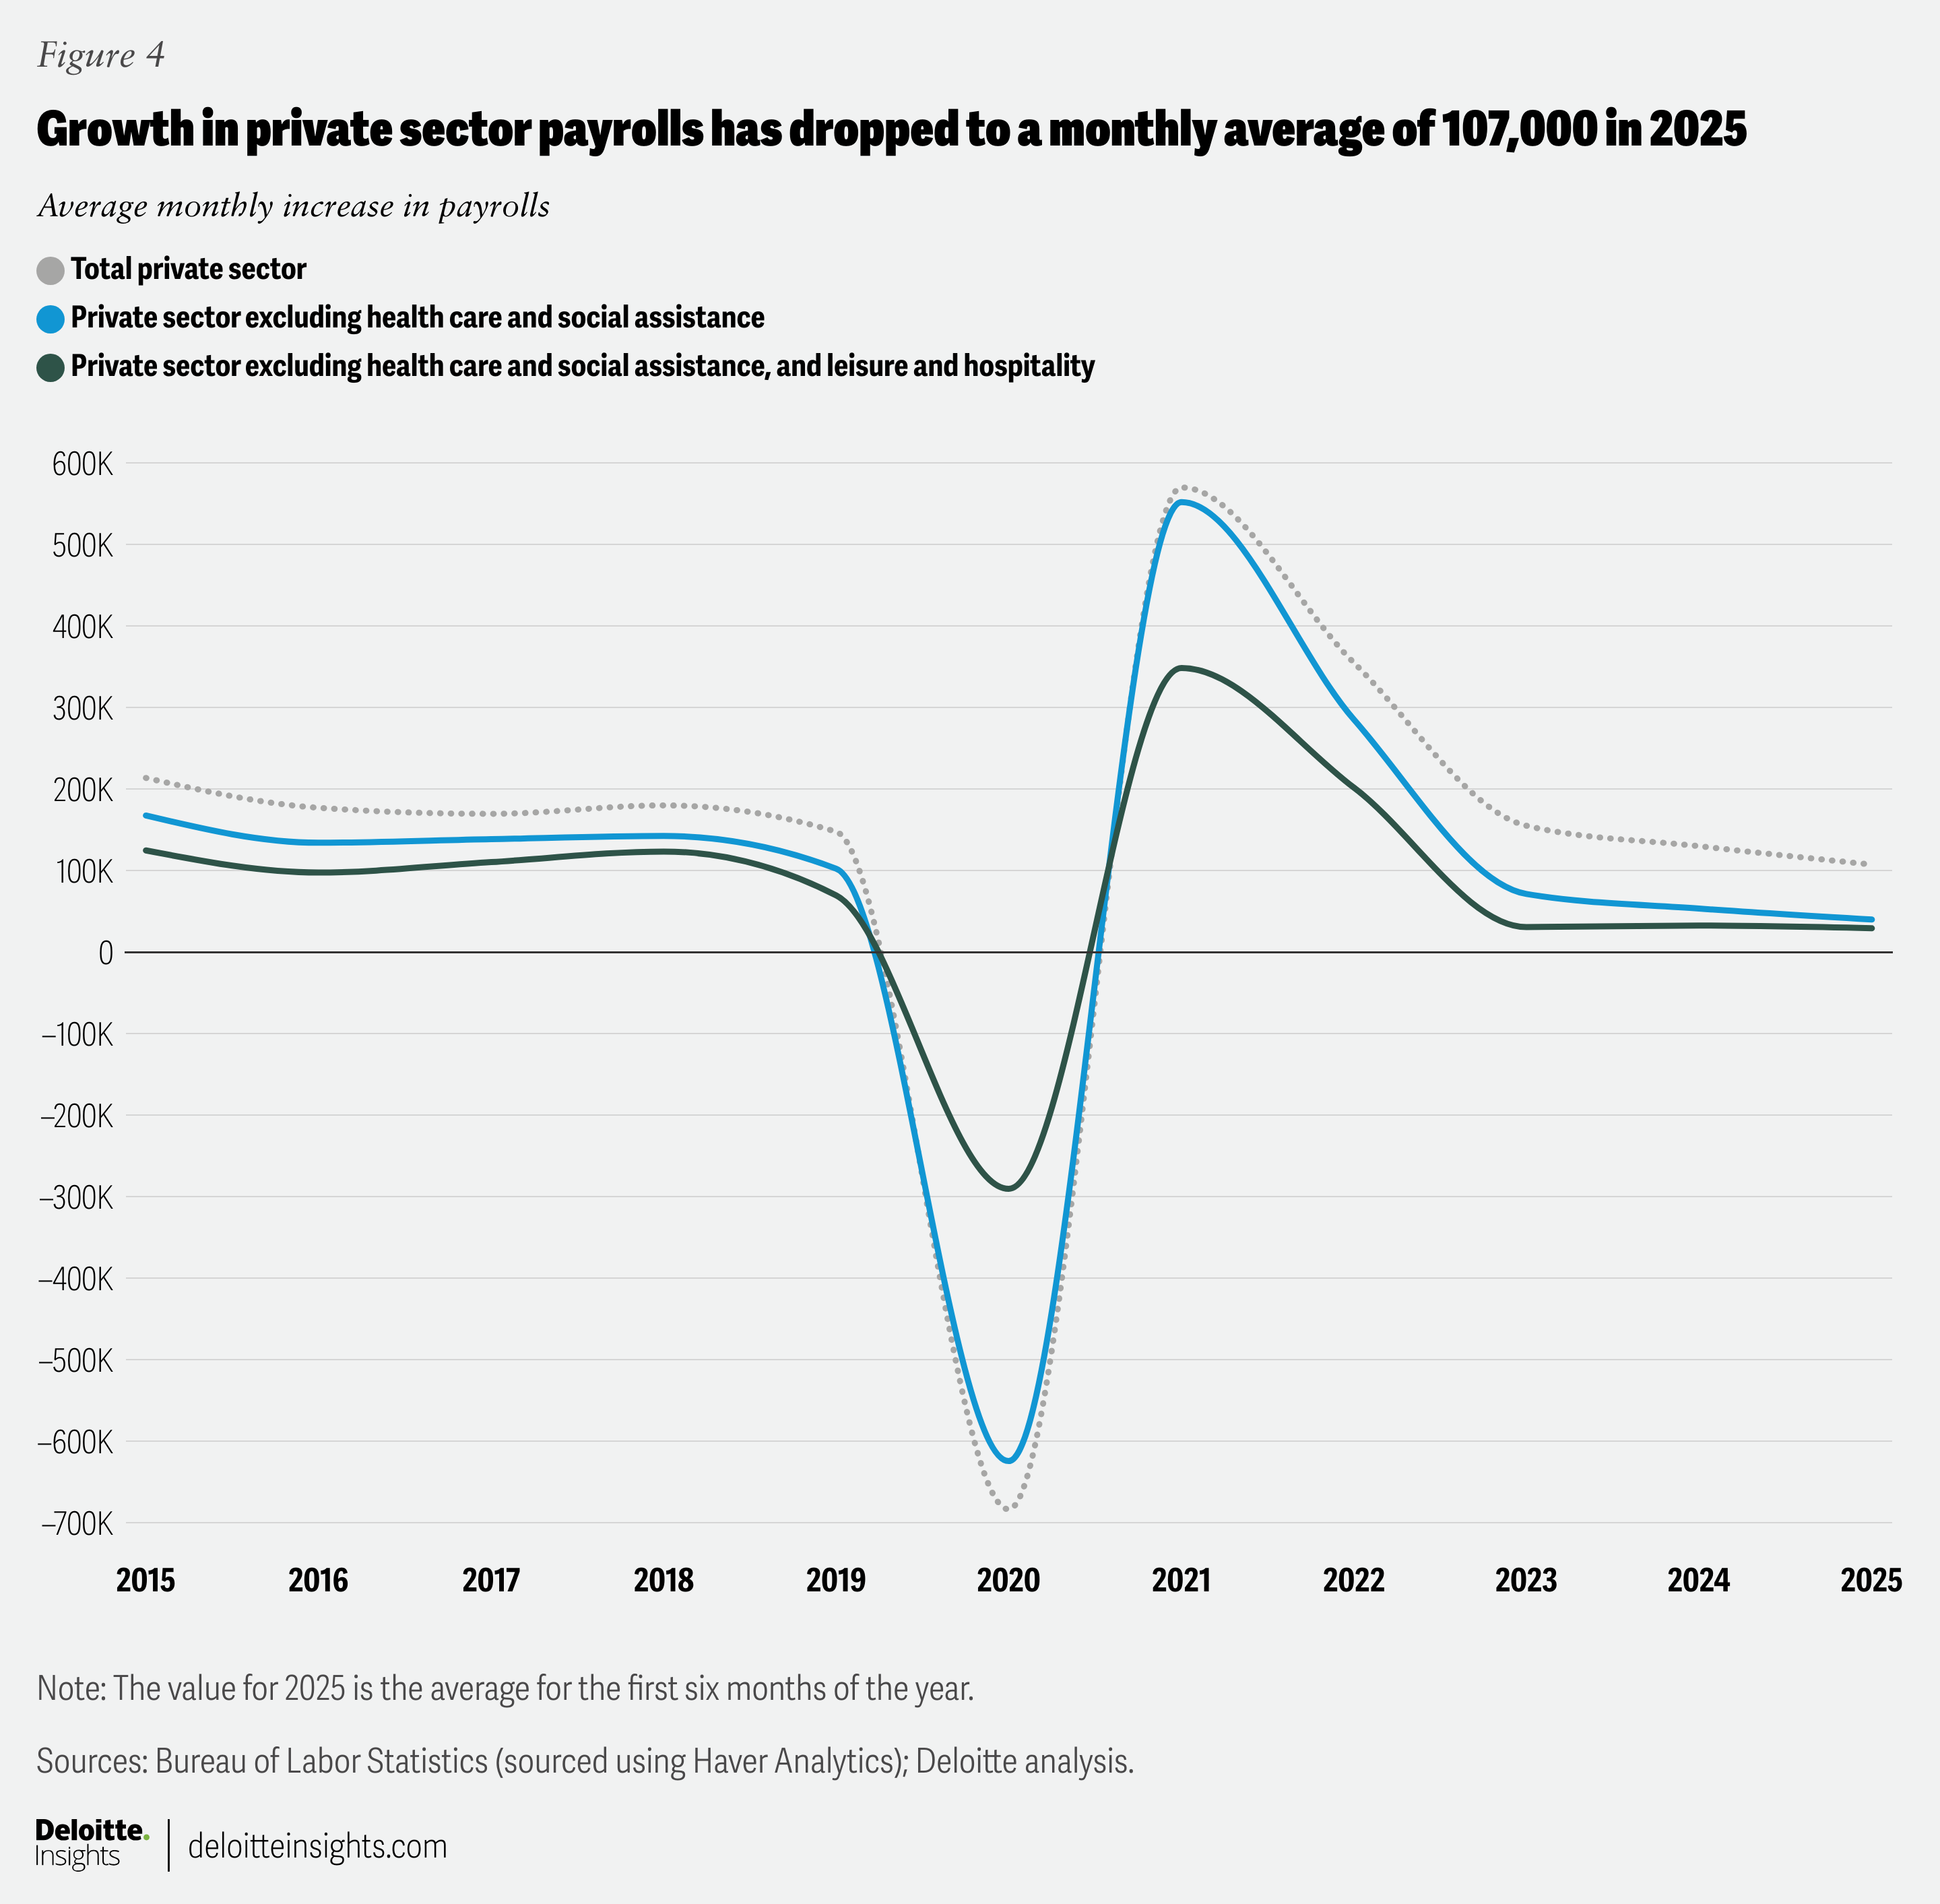
These trends indicate that private sector job growth has slowed sharply if health care and social assistance, and leisure and hospitality are not considered (figure 4). For example, excluding these two sectors, private sector payrolls actually declined in June and grew by just 29,200 on average per month this year and by 32,500 in 2024. In fact, payrolls are now lower compared with end-2022 in key sectors of the private sector economy such as professional and business services, information services, and manufacturing.
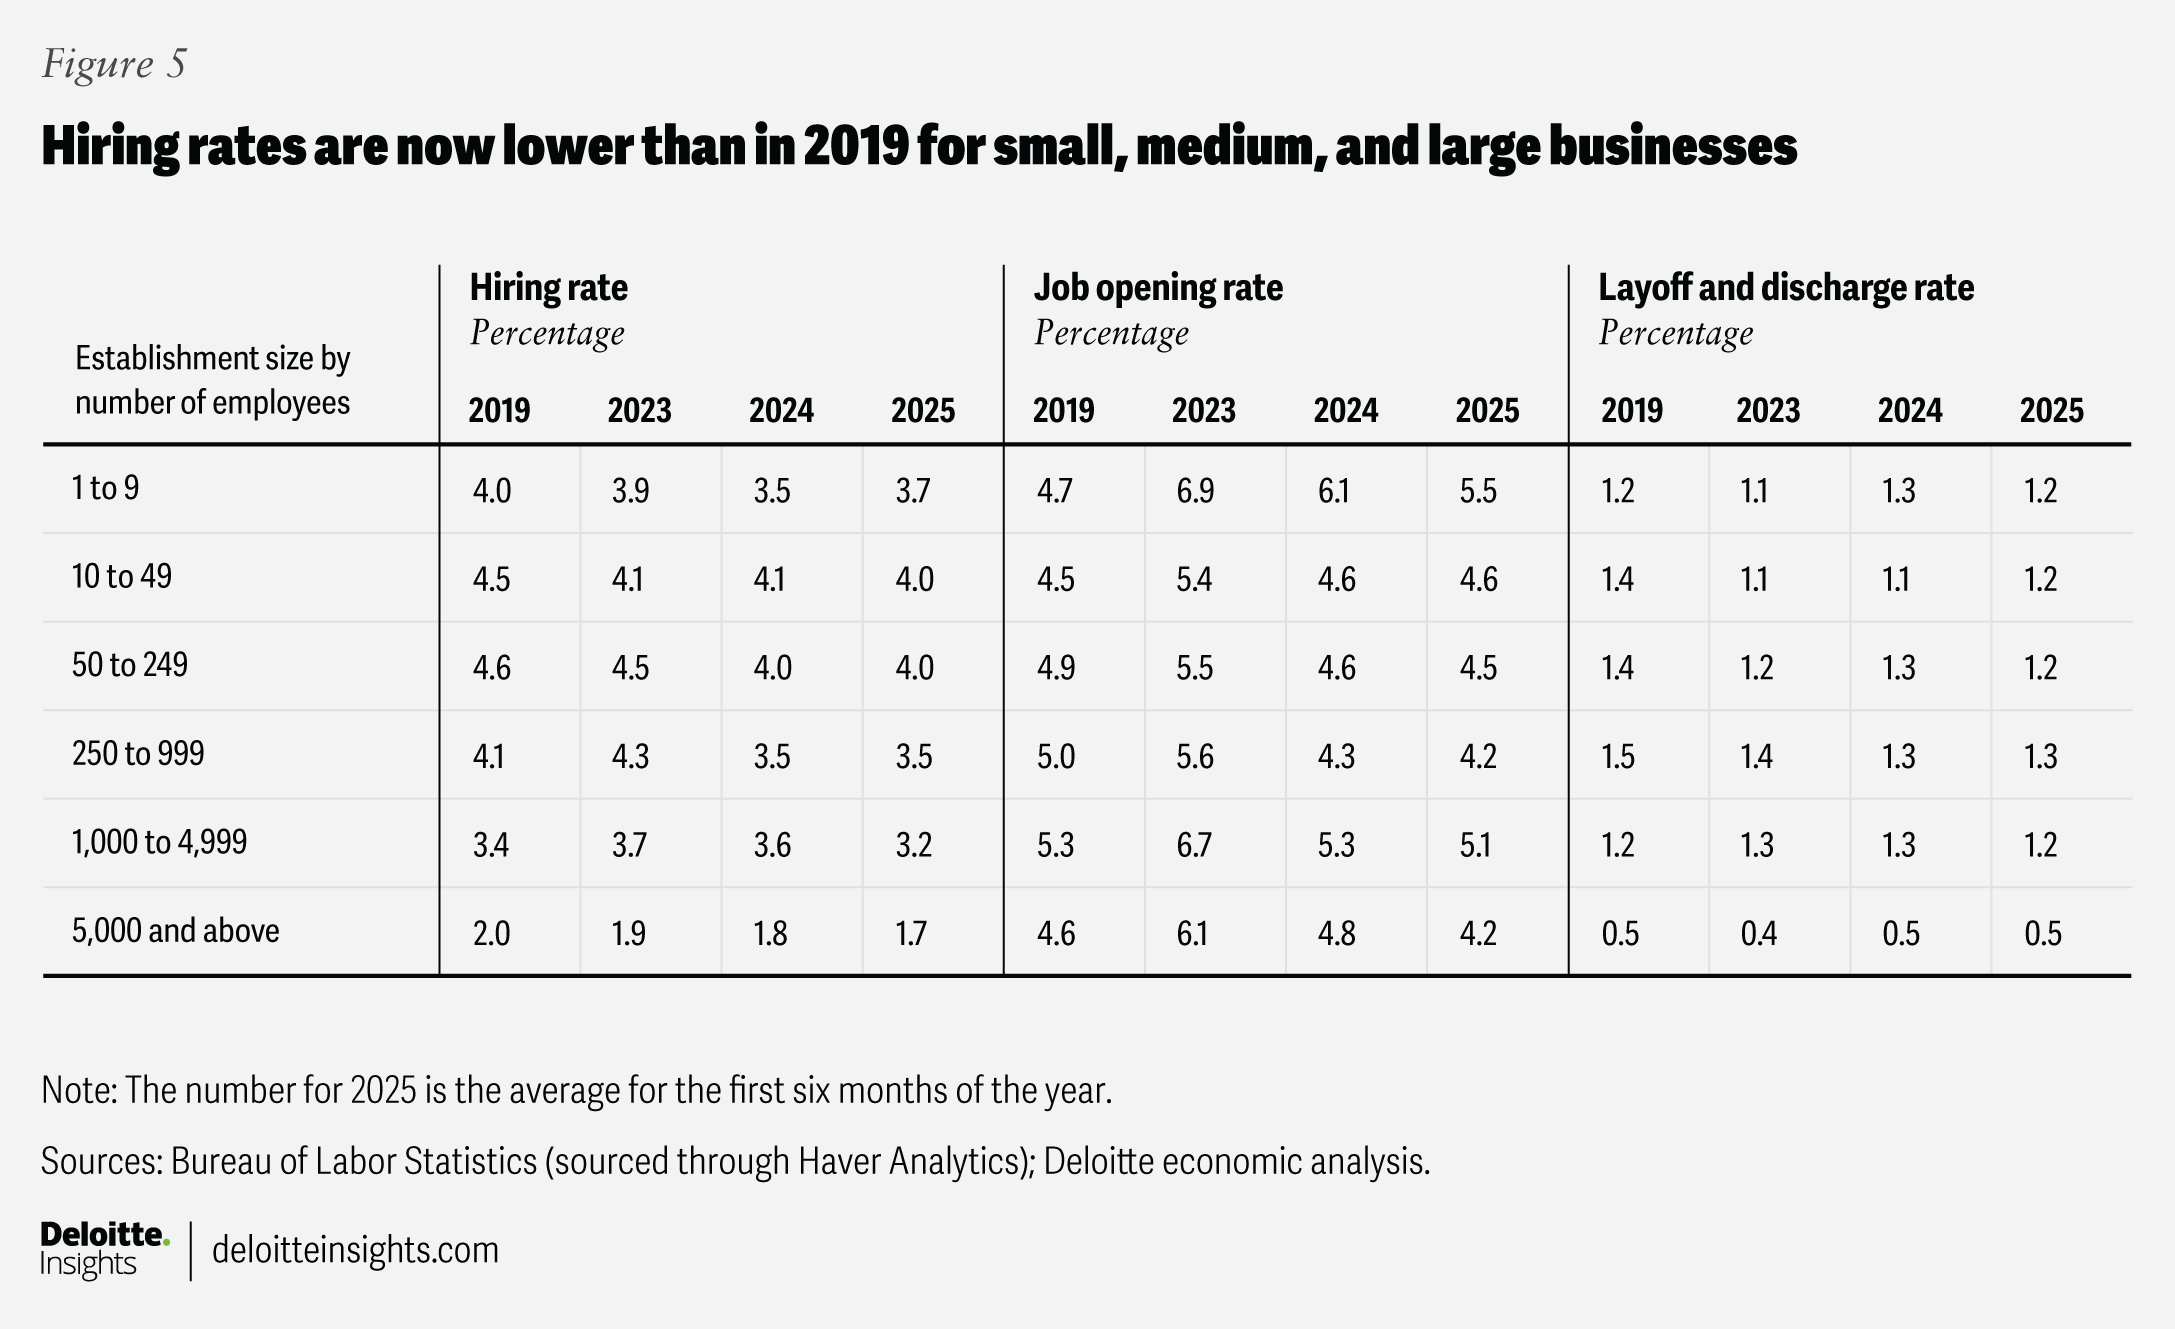
Hiring rates and broader indicators suggest some slackening in the labor market
Data from the Bureau of Labor Statistics’ job openings and labor turnover survey shows that hiring rates have been flat since 2024 and lower than they were in 2018 and 2019.12 As shown in Figure 5, which presents average rates of hiring, job openings, and layoffs and discharges by establishment size (by number of employees), hiring rates are now lower than they were before the pandemic across businesses of all sizes, with the largest declines seen in firms employing between 10 and 1,000 people. Job opening rates, too, have declined over the last two years and are now lower than in 2019 for all businesses employing 50 or more people.
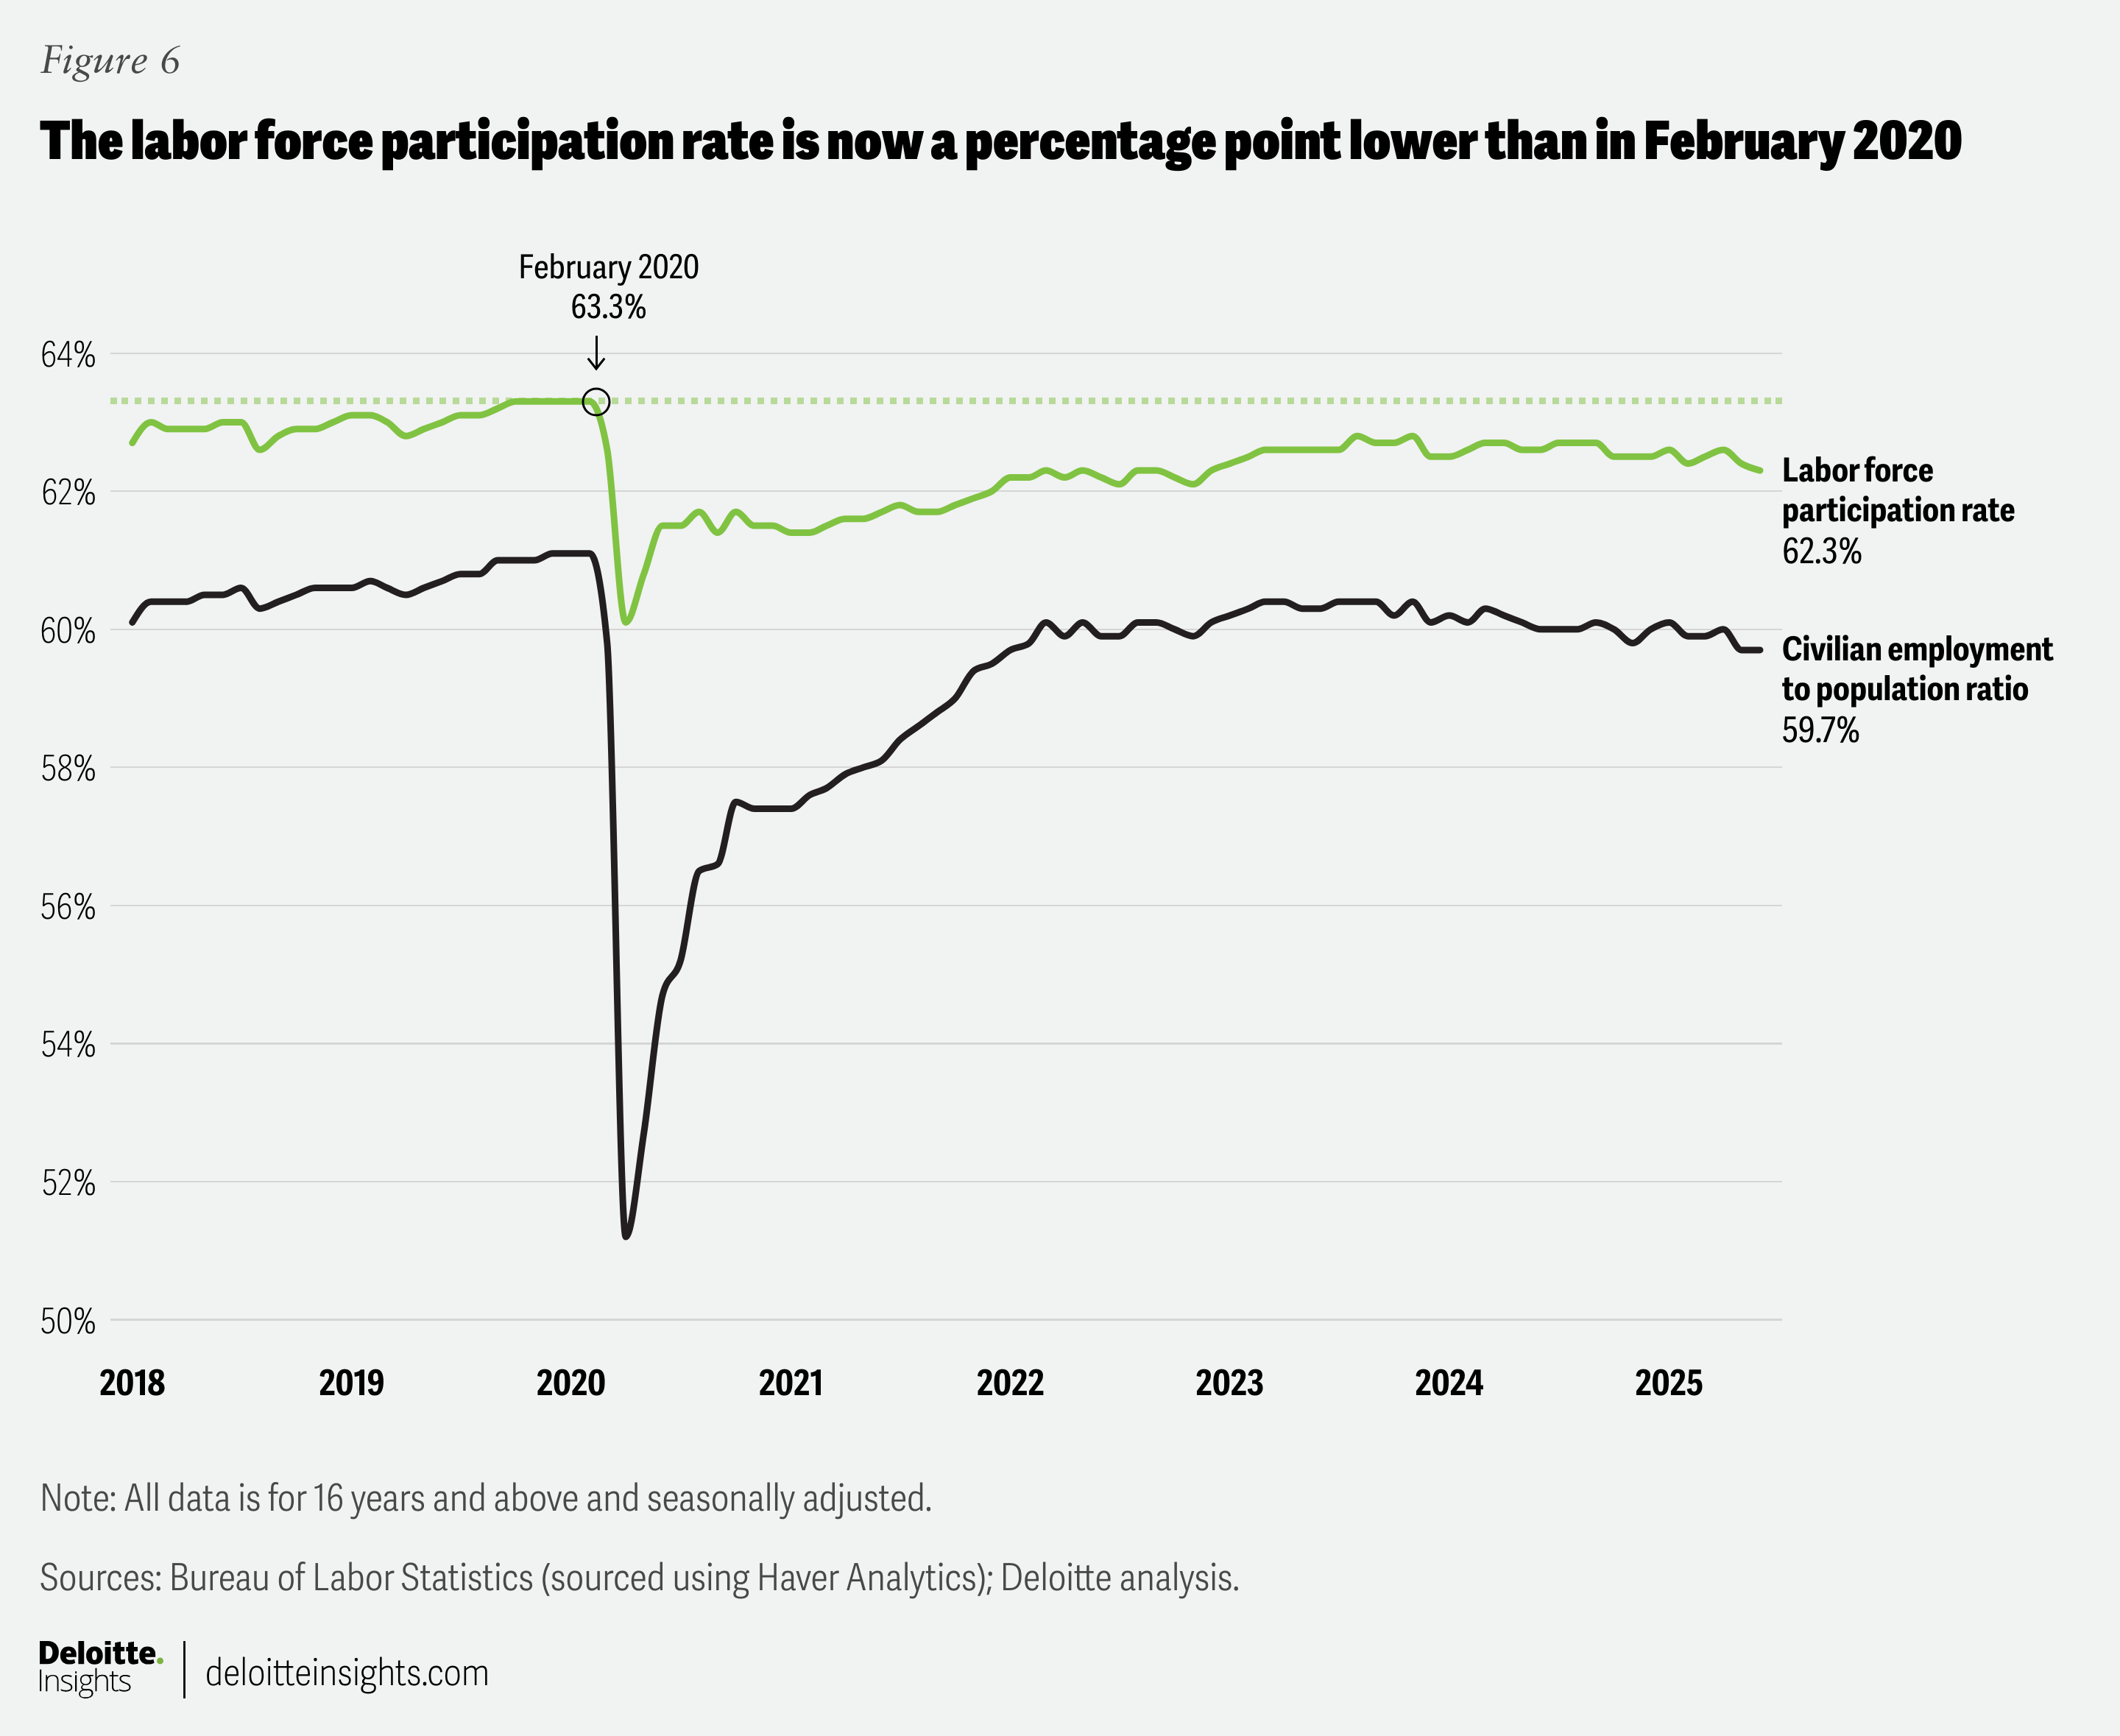
The household survey data (published by the Bureau of Labor Statistics) also shows some underlying weakness. The labor force participation rate has been edging down broadly over the last nine months, and the employment-to-population ratio has also declined in 2025 (figure 6).13
Both indicators remain below pre-pandemic levels. While the unemployment rate is still relatively low, it has risen from 3.7% in January 2024. Broader measures of unemployment also show a similar trend. For example, U6—a measure of unemployment that includes discouraged workers (those marginally attached to the labor force, and individuals working part-time for economic reasons)—was 7.7% in June, up from 7.2% in January of last year, and higher than the 7% figure right before the start of the pandemic.14
Any slowdown in economic growth will raise risks for the labor market
These emerging strains in the labor market come at a time when economic growth faces new challenges, especially from rising tariffs. In Deloitte’s baseline forecast, the average tariff rate in the United States is expected to rise to about 15% this year, up from about 3% a year back.15 This is expected to boost inflation, delaying interest rate cuts by the Federal Reserve.
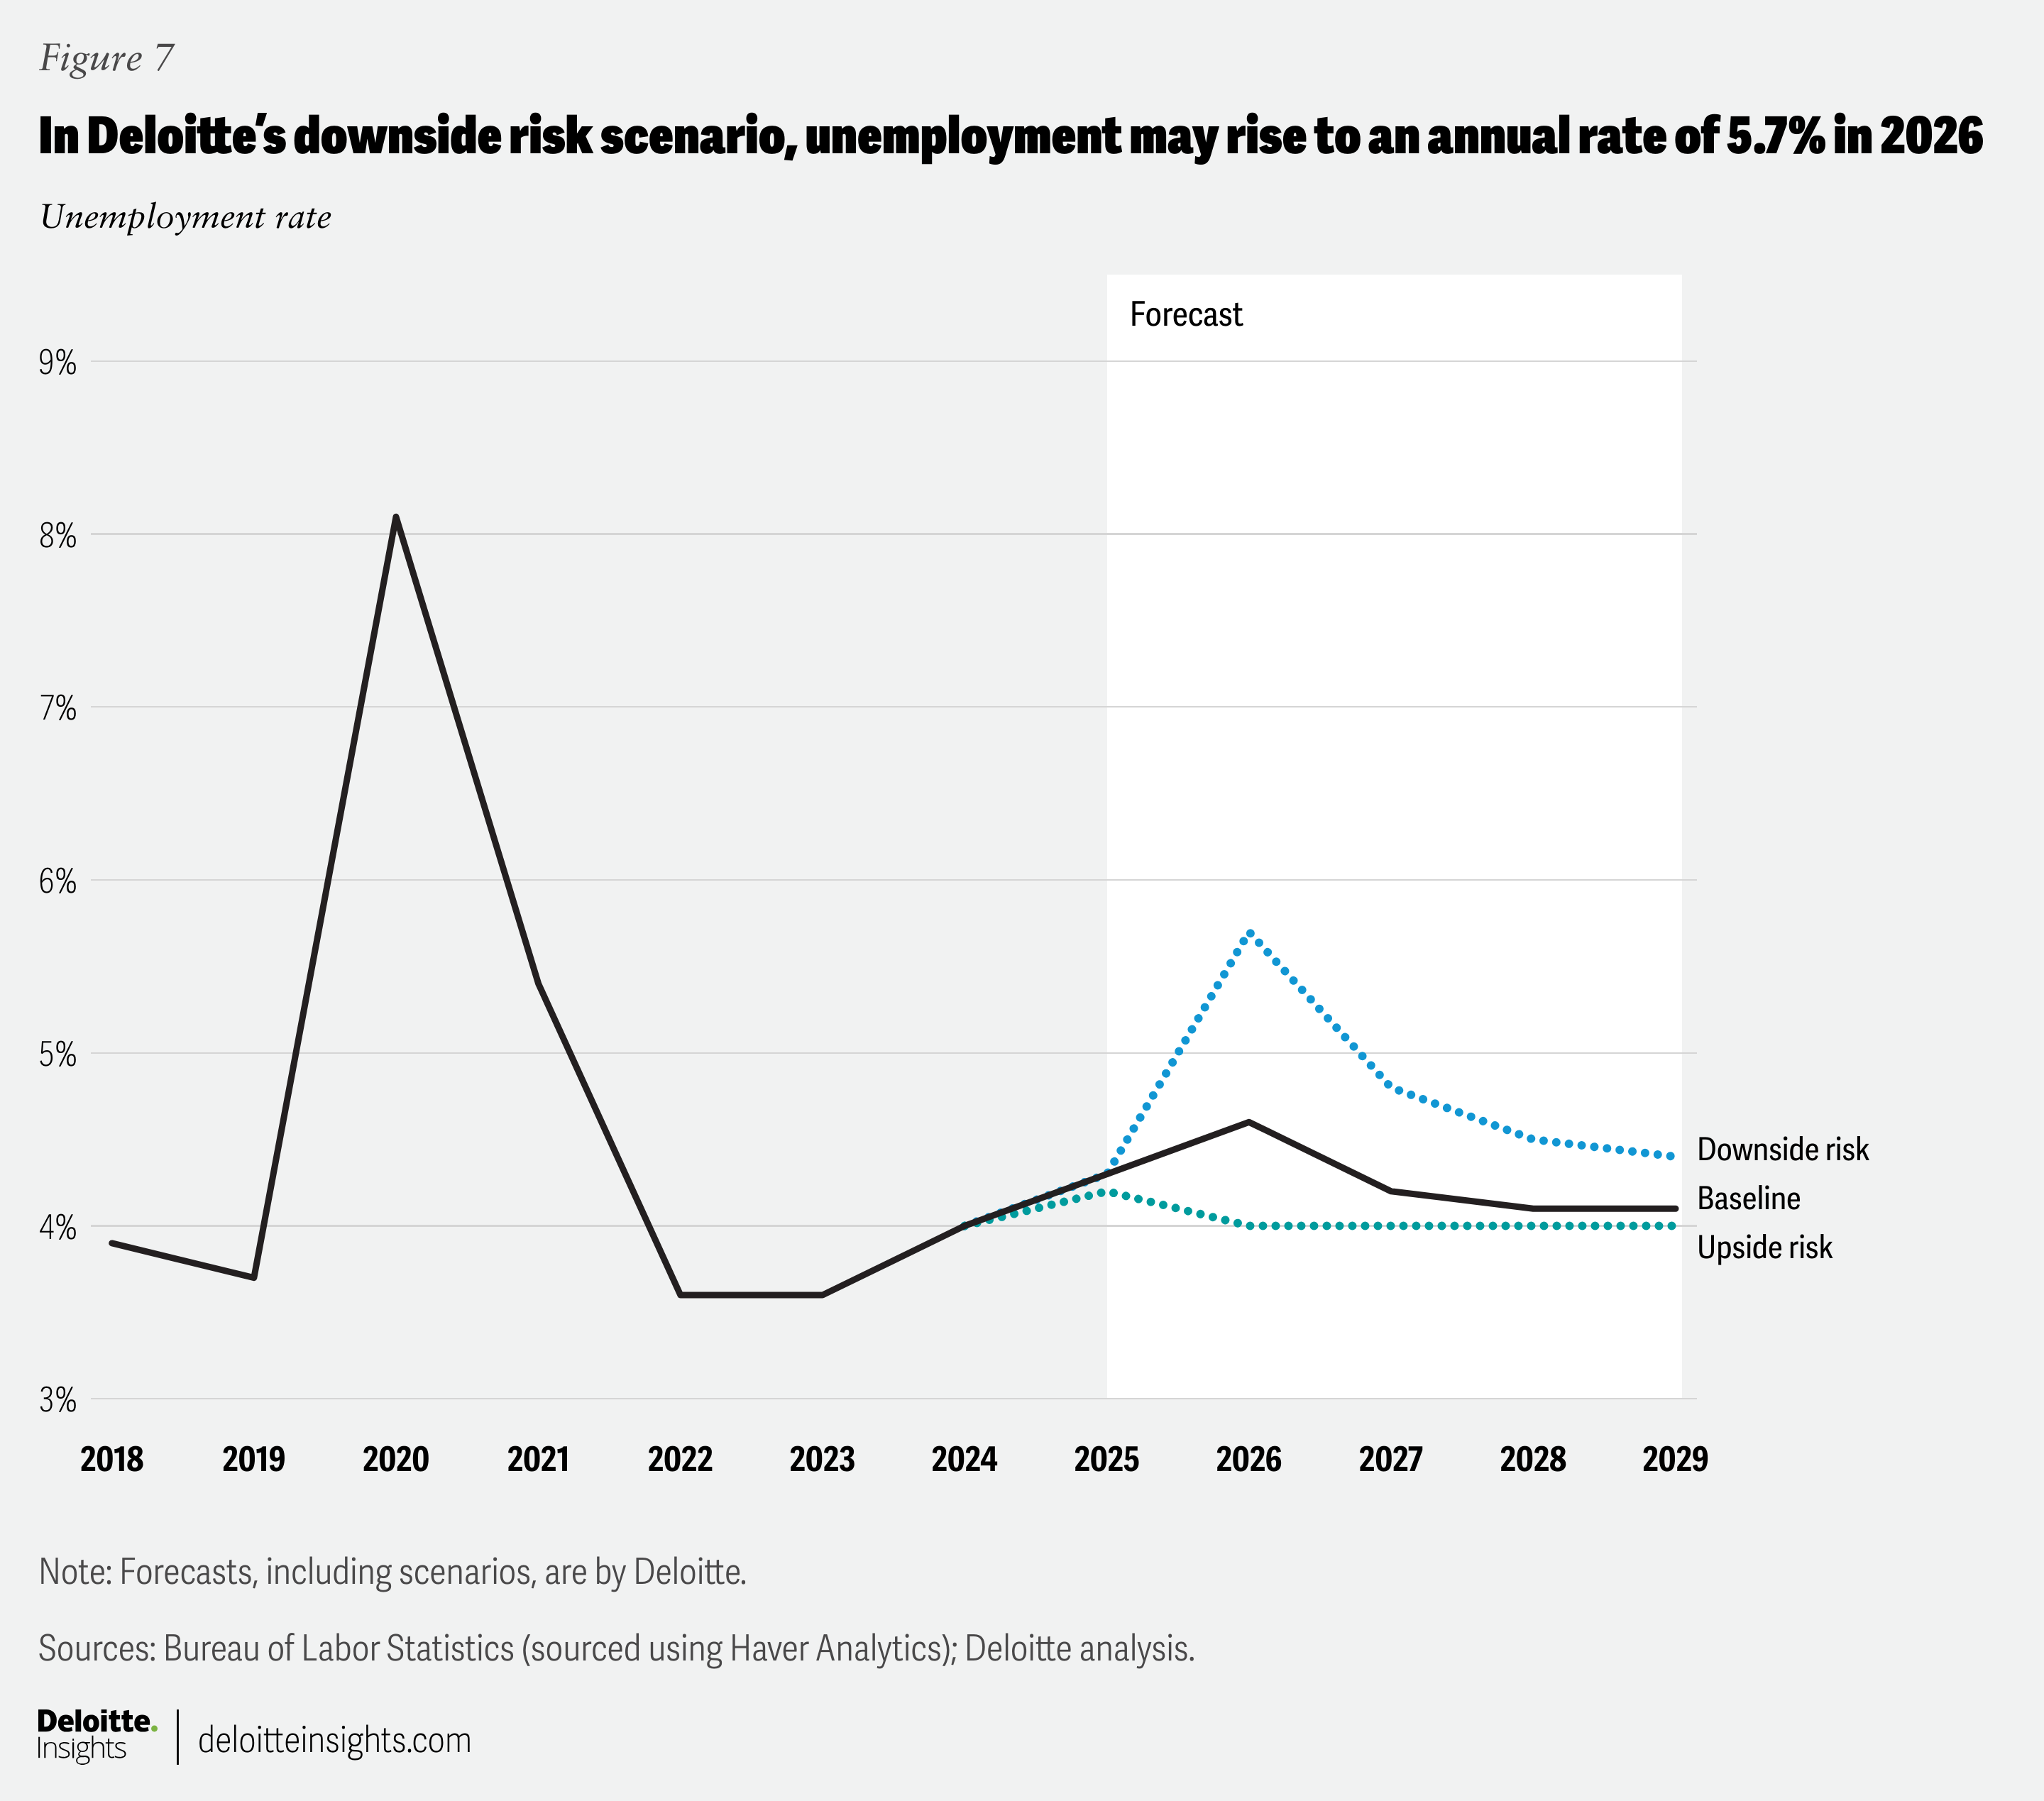
In such a scenario, economic growth is expected to slow to 1.4% in 2025 and 1.5% in 2026, down from 2.8% in 2024. Business investment growth is also expected to slow sharply this year and the next compared to 2024, thereby further weighing on the labor market. Consequently, unemployment is expected to rise to an annual rate of 4.6% by 2026 from about 4% last year.
While easing trade tensions combined with productivity growth may provide a boost to the labor market compared to what the baseline forecast suggests—an upside risk according to Deloitte economists—the opposite may happen if trade deals break down (leading to sharp rise in tariff rates) and increasing government debt leads to higher long-term borrowing costs.16 In this downside scenario, the economy may slip into a recession this year with business investment and GDP contracting in 2026. Payrolls growth will likely decline on average next year, while the unemployment rate may rise (figure 7).
Demographic shifts pose long-term risks
In addition to cyclical challenges, the labor market also faces risks from changing demographics over the long term. Between 2020 and 2024, the resident population in the United States rose at an average annual rate of 0.6%, lower than the 0.7% rise in the previous decade and half the pace of increase between 1990 and 1999.17 At the same time, the US population has also been aging: Between 1990 and 2024, the share of those below 16 years of age in the population fell to 18.8% from 23.1%, and those in the 16 to 24 years age group fell to 11.9% from 13.1%. In contrast, the share of those aged 55 years and above rose by more than 9 percentage points over the same period.
This indicates that while the shares of potential and new entrants into the labor force have fallen, shares of retirees and potential retirees have gone up. The trend is likely to continue, according to population projections by the US Census Bureau.18 This will likely keep the overall labor force participation rate in check despite rising participation among 25- to 54-year-olds since the pandemic. Projections by the Bureau of Labor Statistics suggest that the participation rate is likely to fall to 61.2% by 2033 from 62.6% in 2024.19
Restrictions on immigration, however, may push labor force growth and participation below current projections due to three key reasons. First, the share of foreign-born workers in the US labor force has been rising, reaching 19.2% in 2024 from 18.6% in 2023;20 slowing immigration will, therefore, dent labor force growth. Second, the foreign-born labor force has a greater share of people in the age group of 25 to 54 years (70.3%) compared with the native-born labor force (62.5%); this age group is the one where labor force participation tends to be highest. Indeed, the labor force participation rate in 2024 for foreign-born people was 66.5%, much higher than the 61.7% rate for native-born people. Finally, immigration restrictions will likely slow labor force growth in low- and middle-wage occupations21 like construction and maintenance, where there is a larger concentration of foreign-born workers than native-born ones.
An aging population and declining labor force participation are likely to dent employment and labor force growth over the long term. The impact of this may likely be felt through slowing consumer spending growth, thereby affecting businesses ranging from retailers to auto manufacturers and from restaurants to home builders. However, the impact won’t be limited to consumer-facing industries. As labor force and demand growth decelerate, businesses across the economy could find themselves dealing with a slower-growing economy and may have to adjust expectations and plans accordingly.
BY
Akrur Barua
The author would like to thank Ruhika Agarwal for her research contributions to this article, and Ira Kalish for his reviews.
Cover image by: Harry Wedel