Changing inflation dynamics pose new risks for the US economy
The March 2026 Economics Insider analyzes changing US inflation trends, their possible drivers, and their effects on US consumer spending
US consumers continue to struggle with inflationary pressures. In December 2025, personal consumption expenditures inflation rose to 2.9% year over year—the highest in two years.1 Core personal consumption expenditures inflation (excluding food and energy), which is closely tracked by the US Federal Reserve, was even higher, standing at 3%. Rising inflation levels, especially above the Fed’s 2% target, could complicate the easing of monetary policy and plans to deal with emerging labor-market weaknesses. For consumers, short-term borrowing costs may remain elevated compared with the period just before the last tightening cycle between 2022 and 2023.
Underlying inflation drivers have changed over 2025. Prices for essential goods and services (such as certain food items and utilities) have risen, even as housing-related costs remain elevated compared with pre-pandemic levels.2 Unfortunately, rising essentials inflation affects low-income households more than others,3 especially at a time when the labor market has eased for low-wage occupations.4 These trends, if persistent, could make consumer spending more dependent on those at the top of the income and wealth ladders and, hence, more vulnerable to asset-price shocks.
Table of Contents
- US inflation dynamics have changed
- US tariffs are not the only factor driving the price surge
- Low-income households are bearing the brunt of inflation
- Risks emerge for consumer spending
- Policy uncertainty and global events may add to consumers’ woes
US inflation dynamics have changed
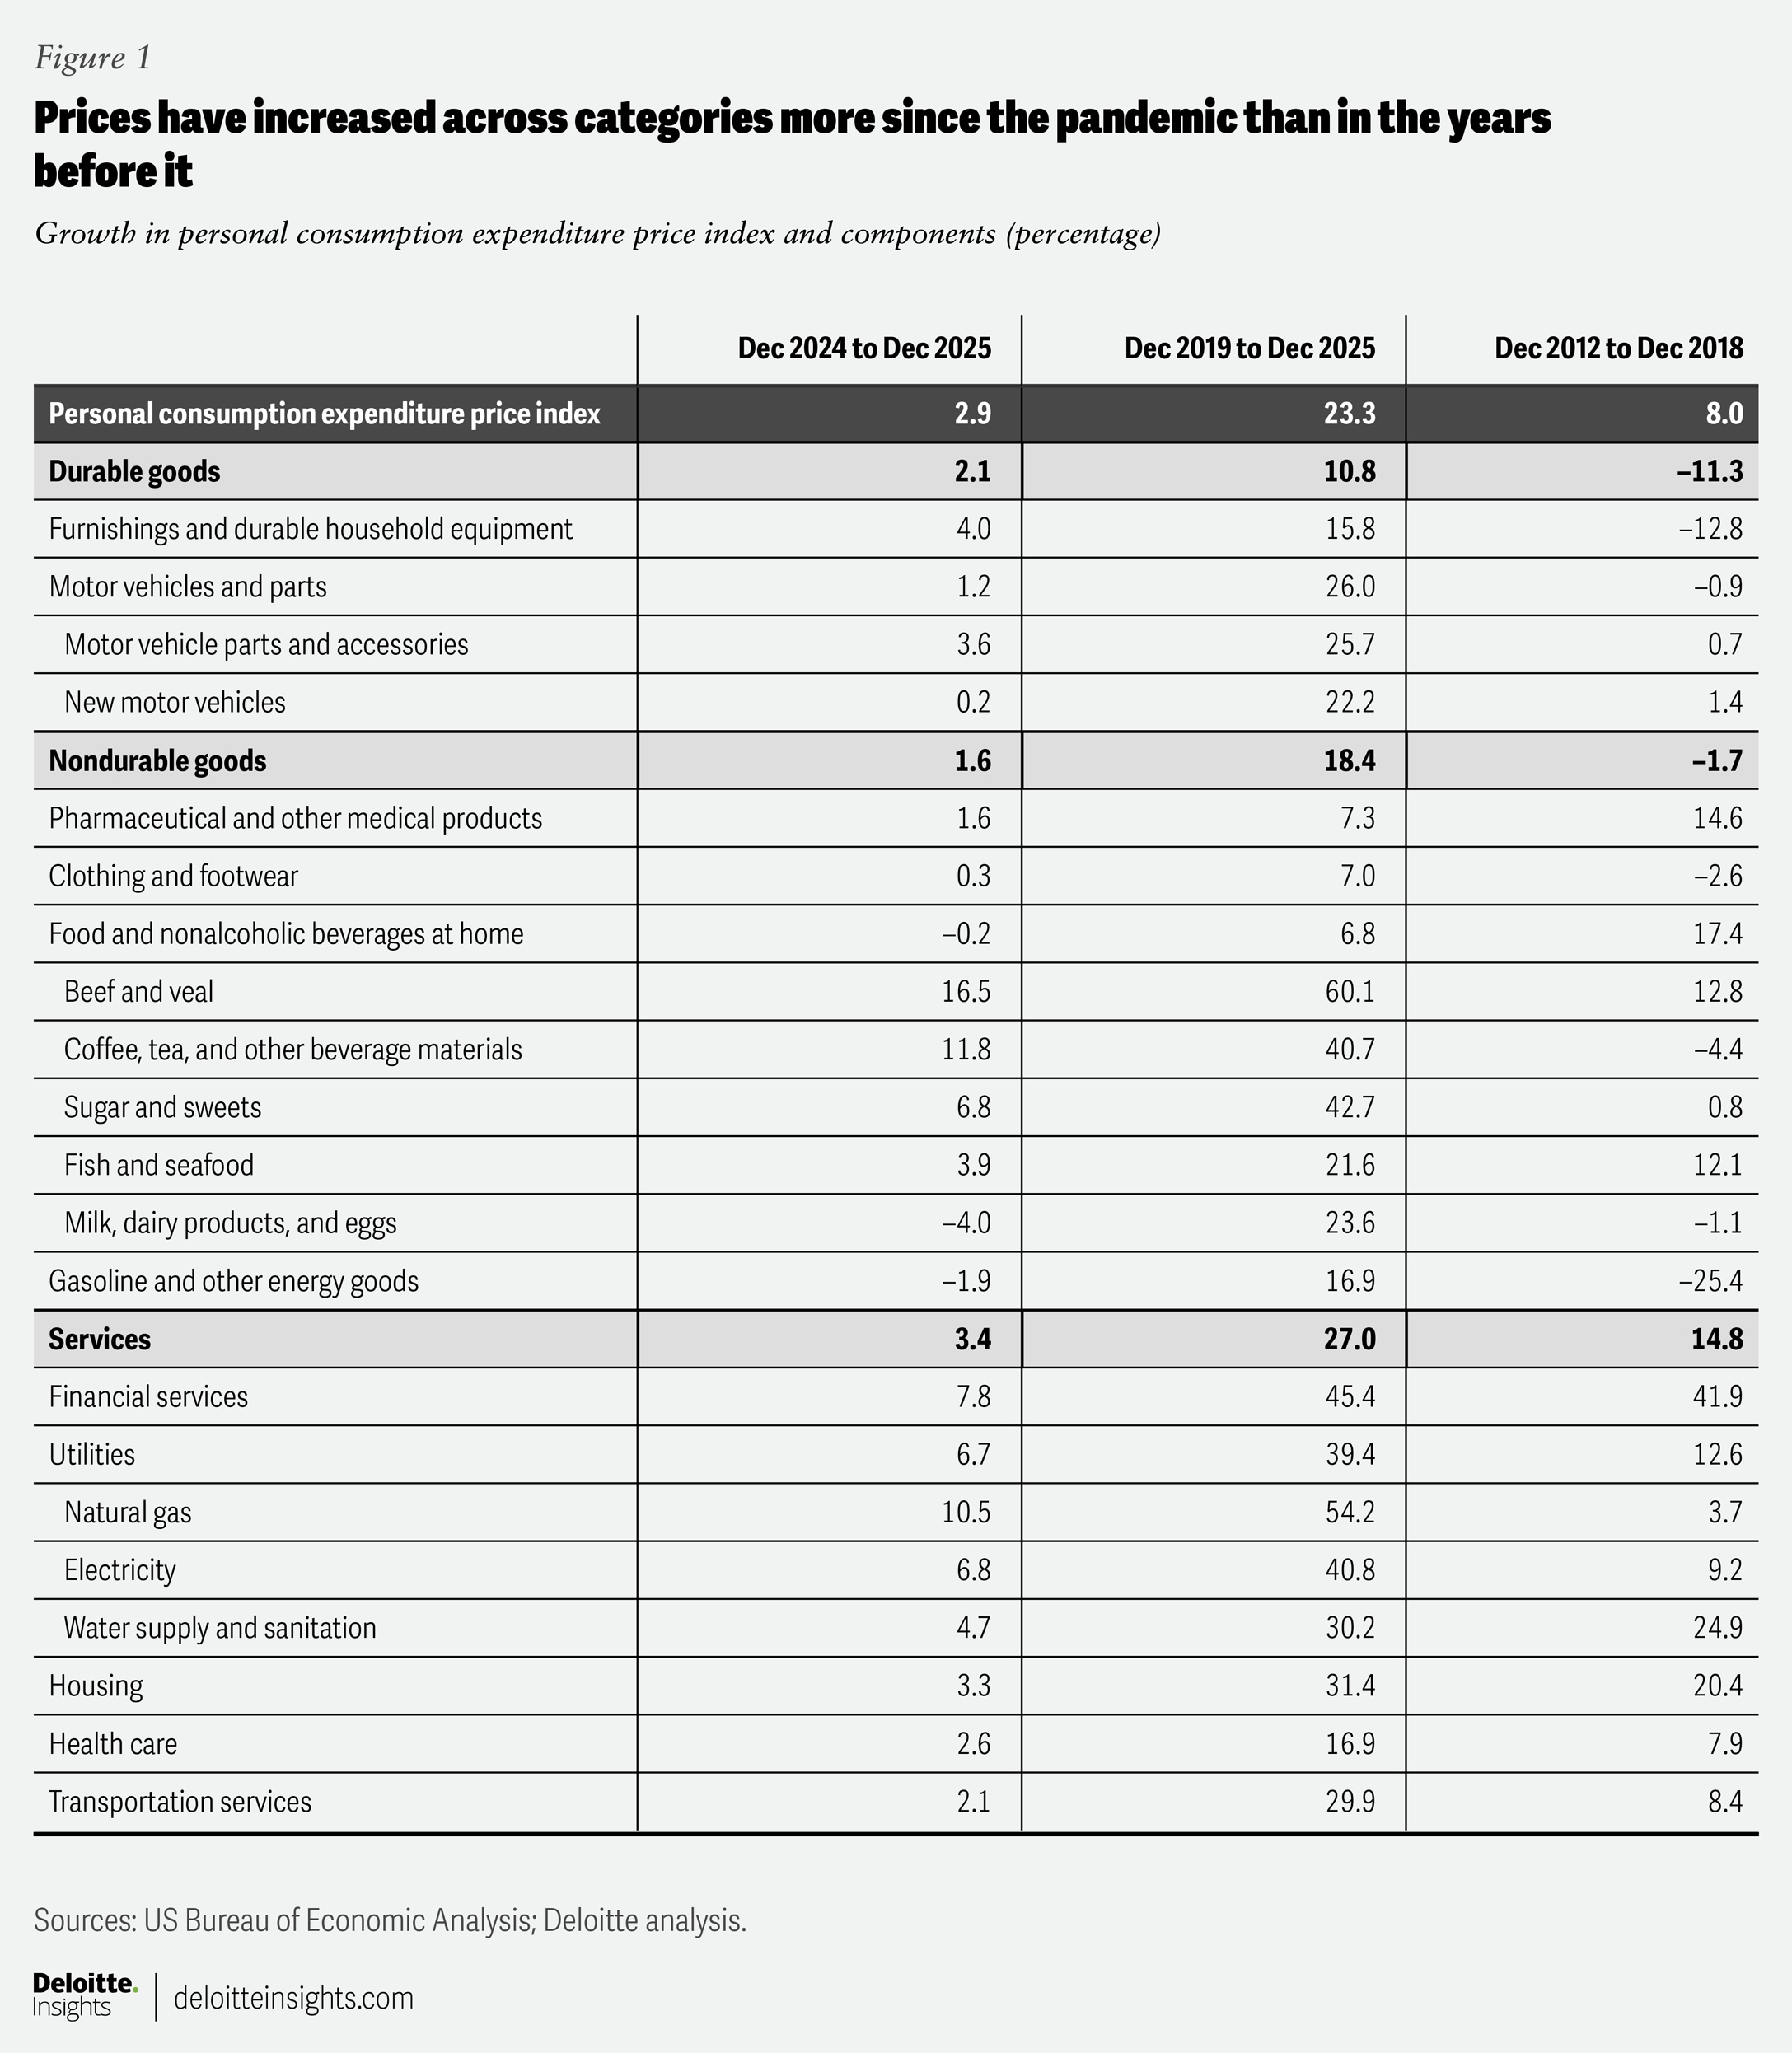
Back in 2023 and 2024, it was the services sector that predominantly contributed to overall inflation. Within services, housing kept inflation for consumer services high. Housing inflation, however, has eased since then and was 3.3% in December 2025—almost the same as before COVID-19. But households continue to face elevated housing-related prices. For example, rents for tenant-occupied nonfarm housing have increased by about 31% since end-2019—higher than the 20% rise in the previous six years (figure 1).
Within services, inflation pressures have now shifted from housing to utilities. Electricity prices, as measured by the personal consumption expenditures price index, are up 8% since mid-2024, while natural gas prices (for household utilities) have risen 13%. Inflation for key food items has also gone up over 2025: Beef and veal prices have increased by 20.9% since mid-2024, while coffee, tea, and other beverage prices have risen by 15.2%. Durable goods inflation is edging up as well, rising to 2.1% in December 2025 (the highest in three years), aided by a steady rise in the prices of furnishings and household equipment and motor vehicle parts and accessories (figure 1).
US tariffs are not the only factor driving the price surge
Tariffs are slowly making their way into durable goods prices. While a large buildup of pre-tariff inventory in the first quarter of 2025 kept durable goods inflation in check through the first six months of the year, those have likely been depleted now.5 US importers of finished products and American businesses using intermediate foreign components are likely passing on rising tariff-related costs to consumers as production costs rise and profit margins come under pressure. For example, producer-price inflation for processed intermediate materials for durables manufacturing rose to 14.4% by January 2026—starkly different from the price declines seen from September 2022 to February 2025.6 And while the recent US Supreme Court verdict against reciprocal tariffs may offer some relief, it is likely that other forms of tariffs will emerge, thereby keeping upward pressure on durables inflation.7
But there are other factors at work as well. Between 2024 and 2025, supply shocks caused by extreme climate events in Brazil and Vietnam have pushed up coffee prices.8 While a rollback in tariff rates (on Brazil) could provide some eventual relief, previous tariffs are still working their way through supply chains. With heavy rains damaging plantations in Vietnam in December 2025, global coffee supply chains may take time to normalize, keeping prices elevated in the United States.9
Climatic factors have also pushed up beef prices. American cattle herds are at their lowest levels in over 50 years due to droughts, and input costs for US ranchers have also increased.10 While the current US administration has increased quotas for Argentinian beef imports, domestic herds will take time to grow.11 Consumers, therefore, might not see major near-term relief.
Retail electricity prices are being driven by a combination of factors, including supply chain constraints, fuel costs, weather-related events, and tightening capacity conditions. Power equipment supply constraints, along with tariffs and other trade measures on imported equipment, are increasing capital and procurement costs, adding upward pressure on prices.12 Nationally, residential prices rose by approximately 6% year over year to 17.24 cents per kilowatt-hour in December 2025, from 16.27 cents a year earlier.13 Across markets, changes ranged from a 14% decline to a 27% increase, reflecting wholesale cost pass-through, particularly for natural gas and capacity as well as utility-specific expenses.
Large load growth, particularly from AI data centers, is an increasingly important factor in electricity pricing dynamics in some markets. The impact varies depending on site decisions, the presence of large-load tariffs, and local capacity market conditions.14
Low-income households are bearing the brunt of inflation
Utilities, food, some consumer durables, and housing are essential components of a household’s budget. With prices of these goods and services either rising steadily or remaining elevated, low-income households have been affected more than others. According to data from the consumer expenditure survey by the US Bureau of Labor Statistics, the average annual expenditure on food at home, utilities (electricity and natural gas), and shelter amounted to nearly 88% of average annual pretax income for the bottom 20% of households (by income).15 That ratio goes down as household income increases (figure 2).
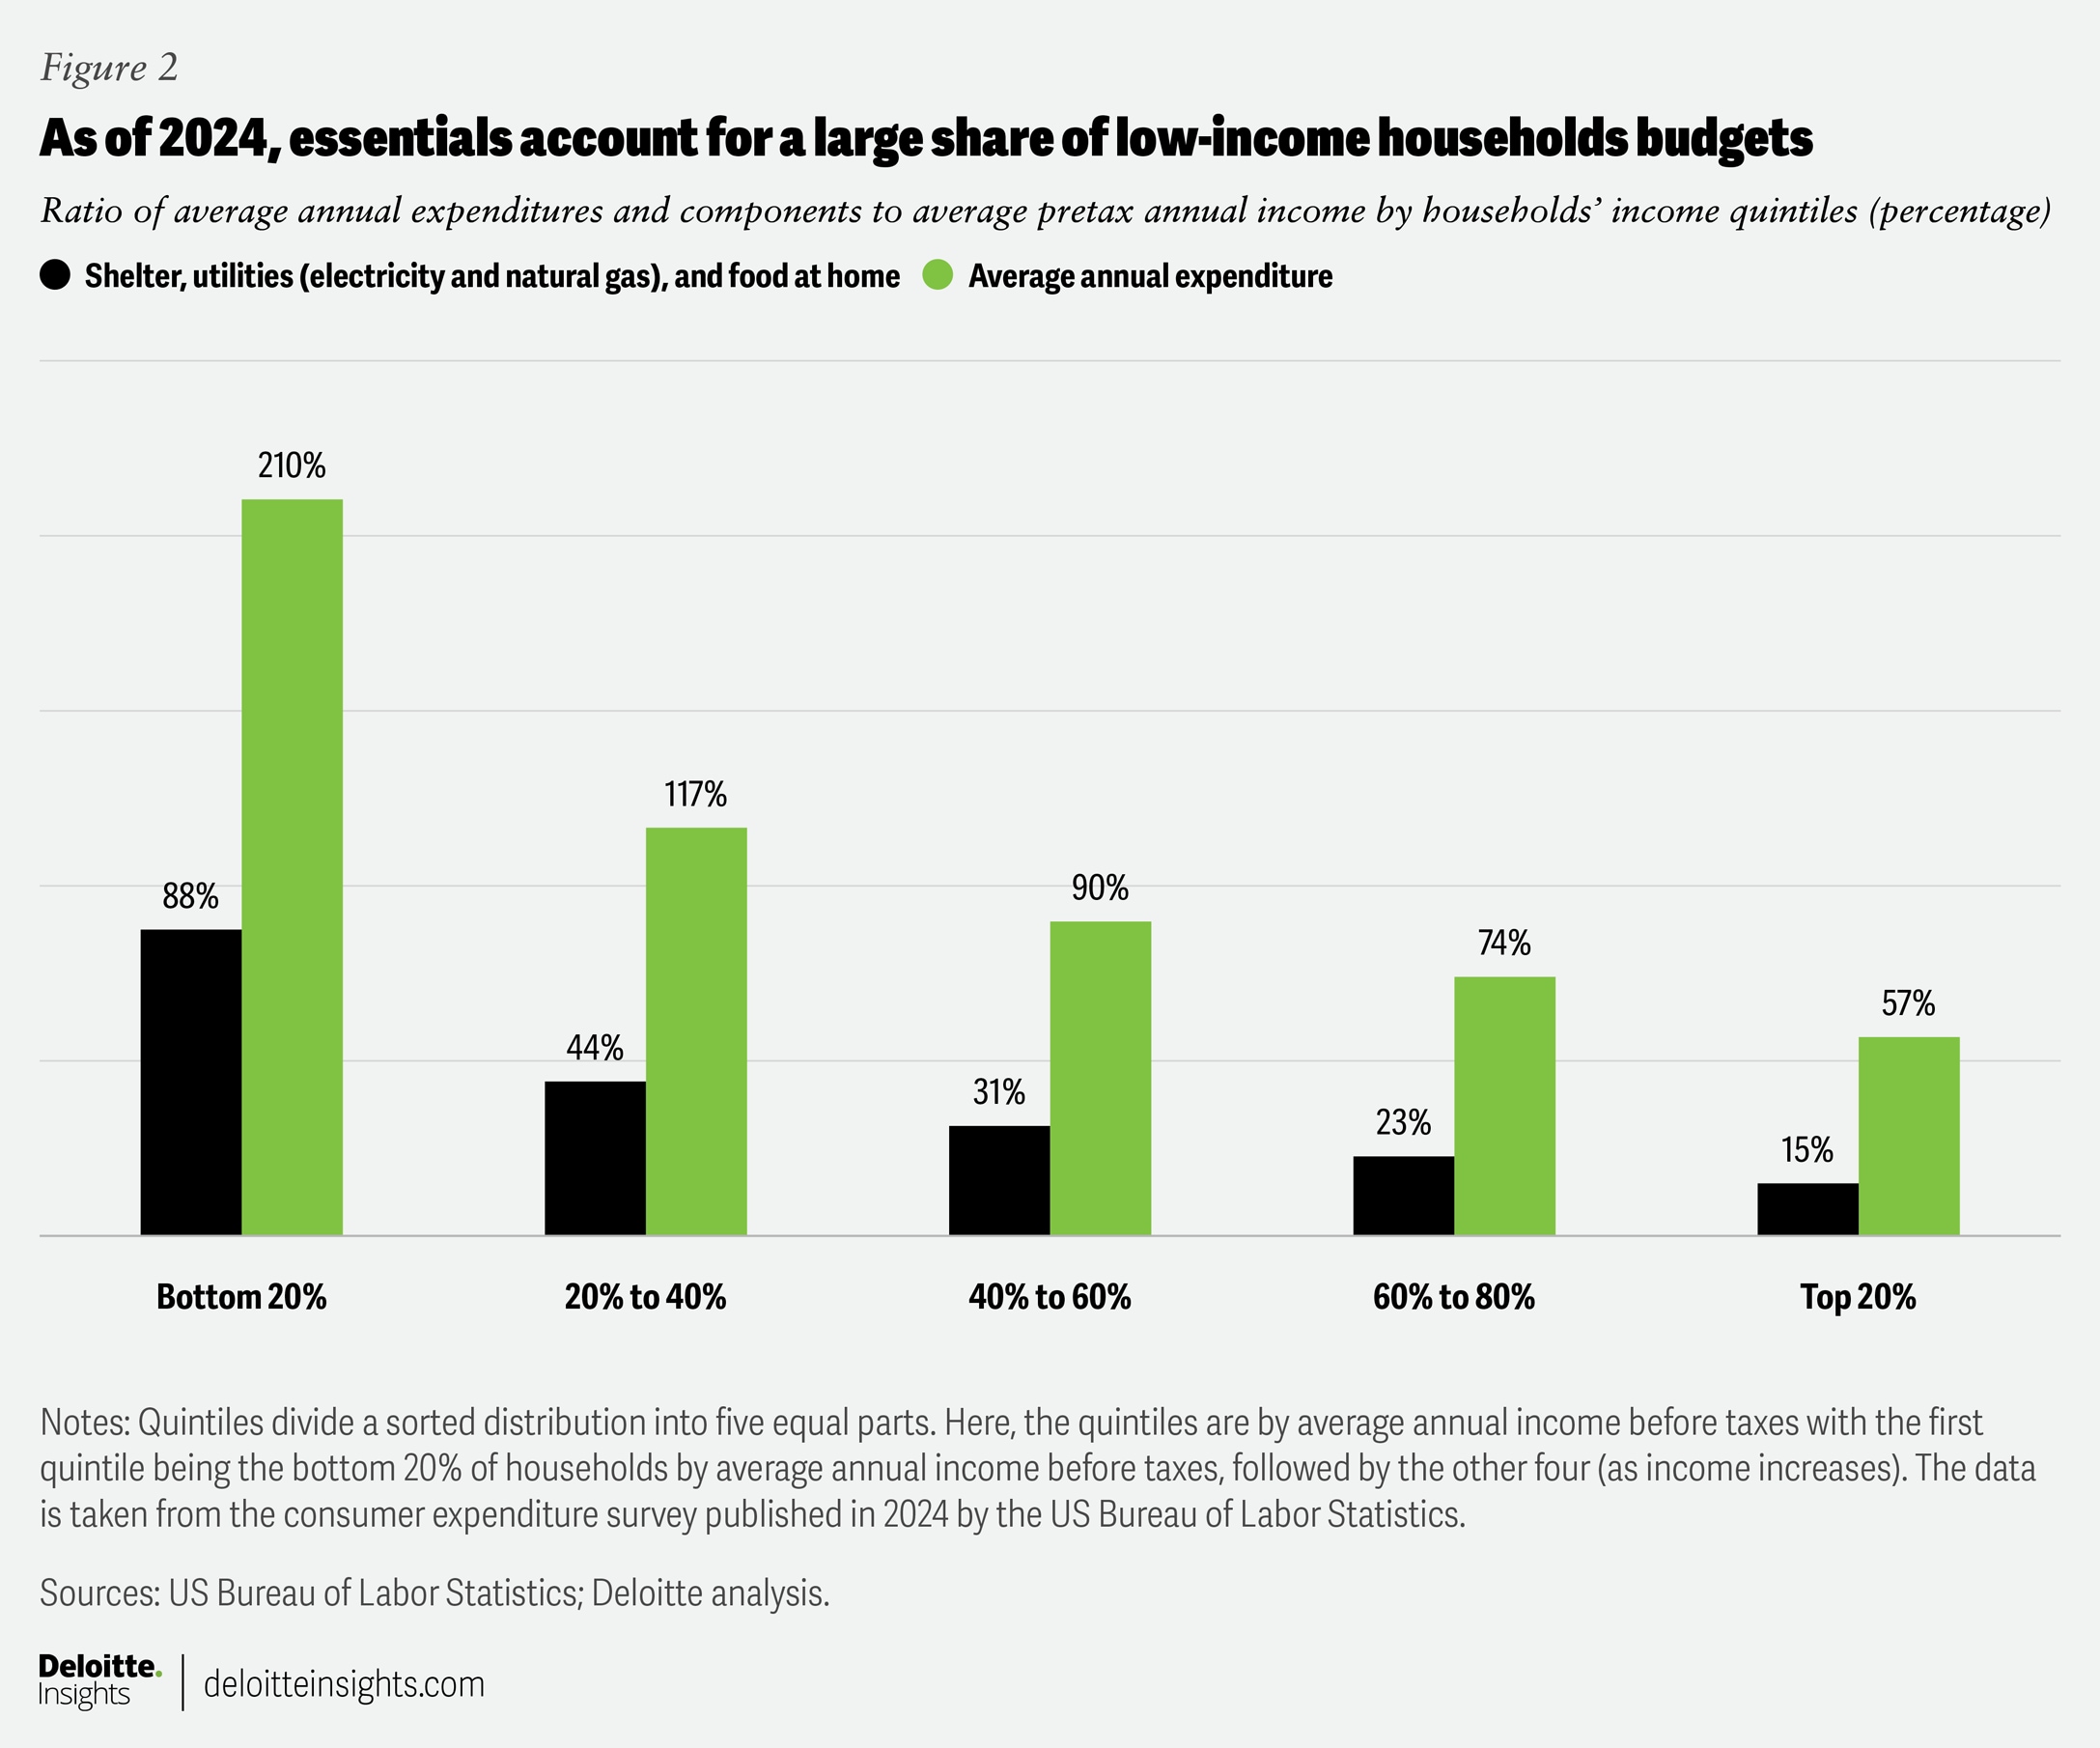
In fact, the average total expenditure of the bottom 40% of households is higher than their pretax income, forcing them to depend on handouts or borrowing.16 Low-income households are accumulating more debt, especially on their credit cards. Economists at the Federal Reserve Bank of Boston analyzed data between June 2015 and April 2025 and found that low-income consumers have been racking up credit card debt at a faster pace since the pandemic compared with their high-income counterparts.17 As such debts add up, delinquencies too have grown, with the fastest pace of increase among subprime, near-prime, and low-income borrowers.18 Subprime and near-prime borrowers are also driving up overall auto-loan delinquencies.19
That low-income families are under stress is also evident from trends in utility bill payments. Analyses by the Century Foundation and Protect Borrowers show that the average overdue balance on utility bills has gone up by 32% since 2022, with deep-subprime and subprime households being the most affected.20 Nearly 1 in 20 American households is now stuck with utility debt so severe that utility providers have referred (or will likely refer in the near term) these households to third parties to recover the amounts.21
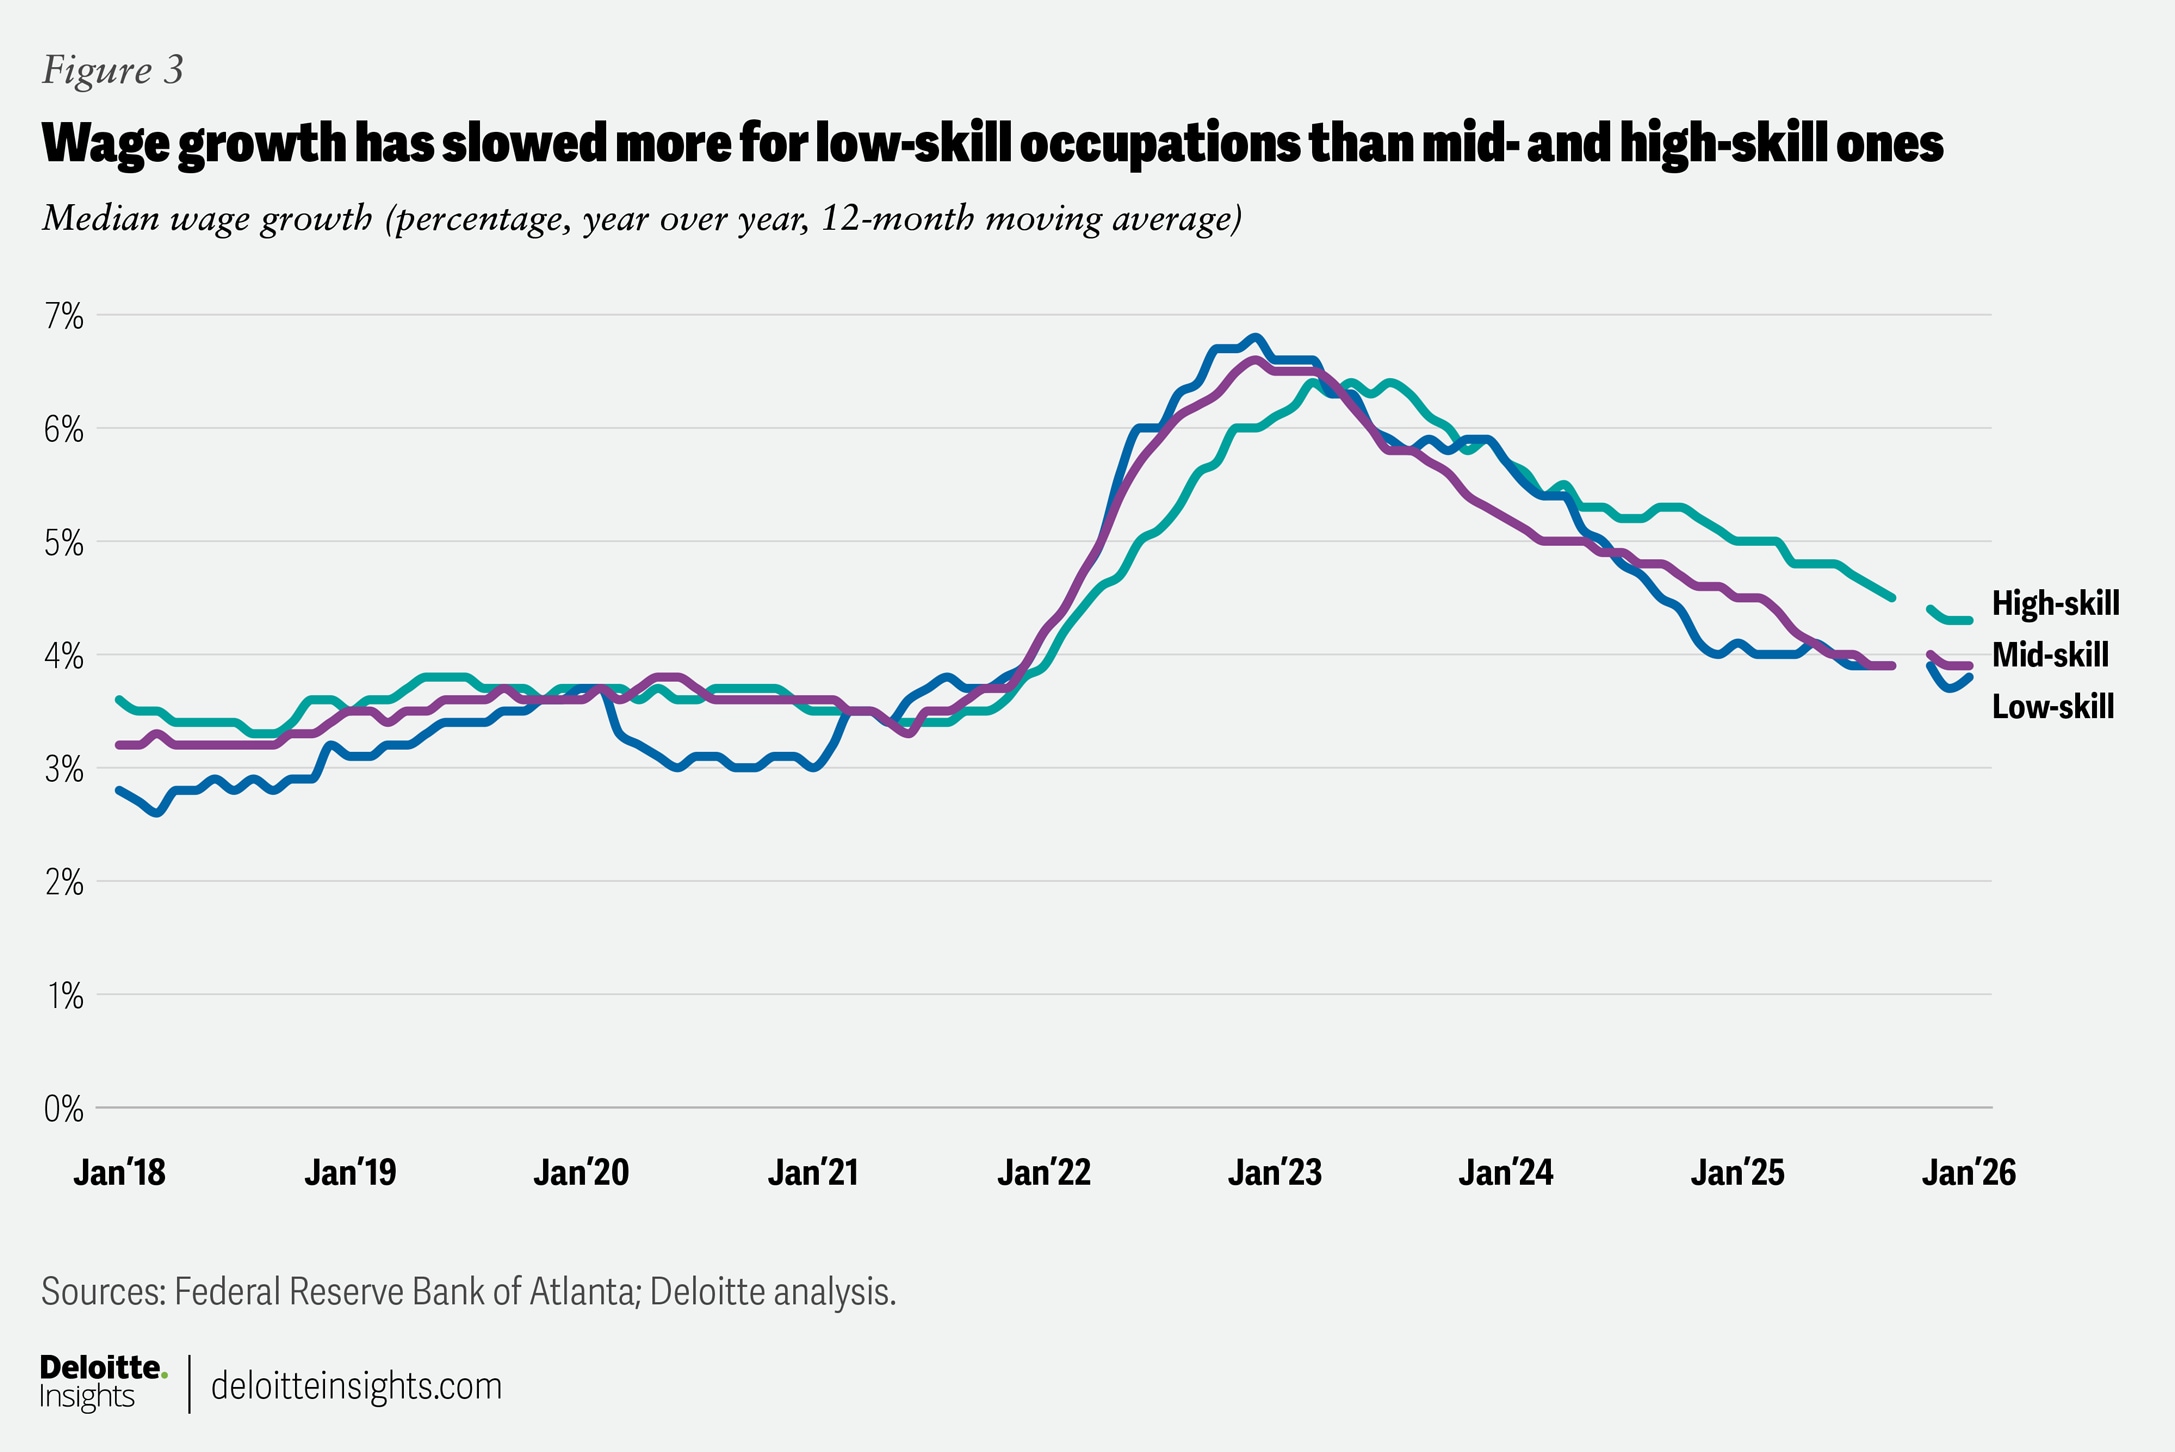
For low-income households, rising costs and overdue payments have coincided with a slowing labor market. Low-wage occupations, collectively, have fared worse than their high- and medium-wage counterparts. Since July 2025, employment in low-wage occupations has declined 2.4%; in contrast, employment has gone up in high-wage (1.8%) and medium-wage (0.3%) occupations.22 In addition, the Federal Reserve Bank of Atlanta’s wage growth tracker shows that wage growth has slowed more for low-skill occupations (which tend to have lower wages) than for mid- and high-skill ones (figure 3).23
Risks emerge for consumer spending
Rising inflation, a slowing labor market, and debt-related stress have impacted consumer sentiment. US consumers’ financial well-being dropped in 2025, according to Deloitte’s financial well-being index, reversing some of the gains of the previous two years.24 Despite the drop in 2025, well-being seems to be up for high-income individuals compared with 2023. The lowest-earning 60% of Americans are no better off than they were three years back (figure 4).25
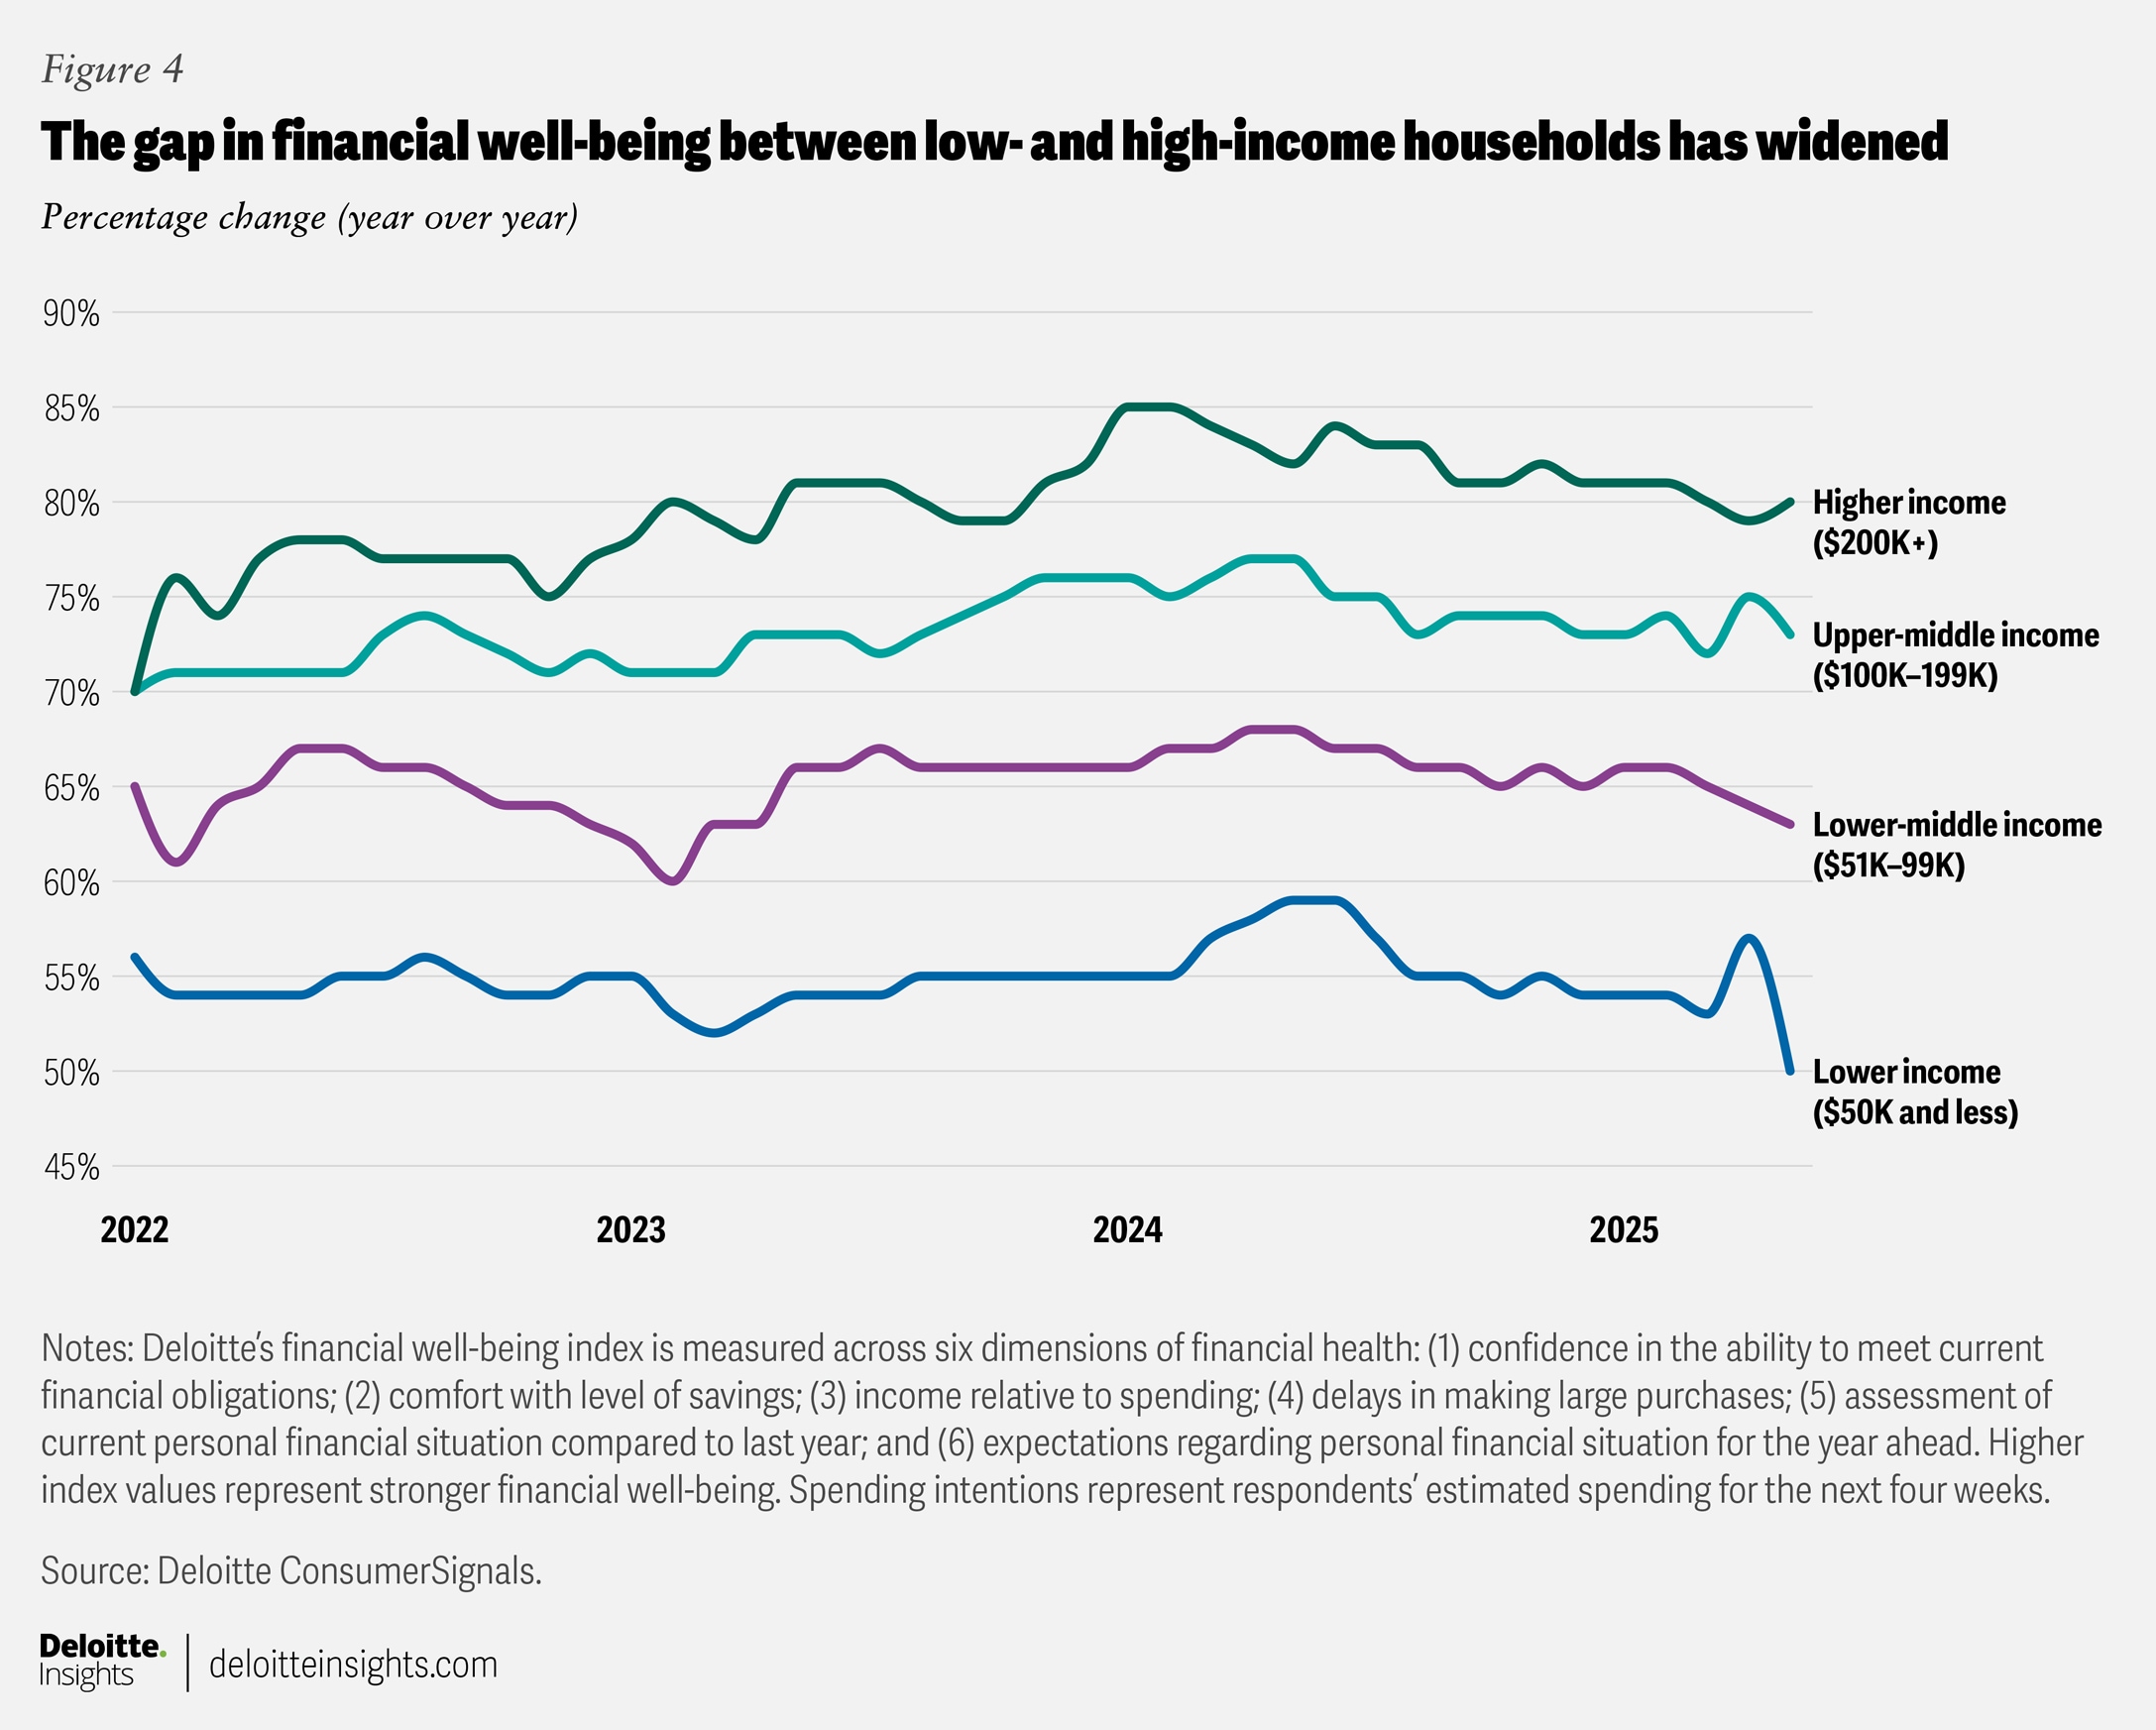
Diverging trends for different income groups are also evident in other indicators. According to the University of Michigan’s consumer sentiment index, high–net worth and high-income individuals are more upbeat than those at the bottom of the income and wealth pyramid.26
These trends pose four key risks for consumer spending and the wider economy.
- First, spending by low- and middle-income households will likely be impacted by rising inflation and slowing job growth, as they are most likely to cut spending on discretionary goods.27 The Fed’s Beige Book for January 2026 highlights that low- and moderate-income consumers are becoming more price-sensitive and exercising greater caution in spending on nonessentials.28 This may intensify the degree of value-seeking on the part of consumers—defined in a Deloitte study as those who exhibit cost-conscious, deal-driven, or convenience-sacrificing behaviors across grocery, retail, restaurants, leisure travel, and automotive—among low- and middle-income households as they navigate higher prices and slowing real income growth.29 Overall, these trends will impact not only the overall level of consumer spending in the economy but also the spending mix.
- Second, pressure on low- and middle-income households leaves overall US consumer spending even more reliant on those with high incomes and wealth. According to the economic heterogeneity indicators used by the Federal Reserve Bank of New York, real consumer spending has grown since 2023 for high-income households but has remained flat for middle-income households and declined for low-income households (albeit with some variation).30 Similarly, analysis of credit card spending by economists at the Federal Reserve Bank of Boston shows that high-income consumers have been driving growth in spending in recent years.31 Recent data from the January 2026 Beige Book shows a similar trend.32
- Third, the increasing role of wealthier and high-income households in total US consumer spending makes the economy more vulnerable to income and wealth shocks.33 Research by Gamber and others indicates that rising asset prices have been a key driver of increased spending by high-income households over the past five years.34 But the marginal propensity for consumption out of wealth has declined for these households.35 As a result, the net wealth effect on consumption is smaller for high-income households compared with others.
Wealth gains, however, have been more concentrated in high-income and high–net worth households than among others. In 2025, the top 20% of income earners accounted for 80.1% of total growth in wealth, and that share has gone up in the last three years.36 Hence, any sharp decline in asset prices due to financial or economic shocks will dent overall consumer spending through a negative wealth effect. It may also influence more value-seeking among even high-income households, especially among young families with six-figure median incomes.37 Perceptions about the economy, retirement readiness, and lifestyle maintenance may be affected by asset price shocks, which in turn play a major role in value-seeking behavior among such households.38 - Finally, elevated price pressures in the economy are expected to keep the Fed cautious as it tries to chart the course for monetary policy. Deloitte economists expect only two rate cuts this year (totaling 50 basis points), as the Fed tries to strike a balance between rising inflation and a softening labor market.39 That means the federal funds rate will likely remain higher this year than it was before the last tightening cycle in 2022 to 2023 and before the pandemic. For households struggling with higher bills and high variable-rate debt (like auto loans and credit card debt), any major relief in borrowing costs is therefore unlikely.
Policy uncertainty and global events may add to consumers’ woes
After the Supreme Court struck down reciprocal tariffs, the US administration announced a universal 10% tariff rate under Section 122 of the Trade Act of 1974,40 which may go up to 15% soon but will expire within 150 days of announcement.41 Regardless, tariffs will likely remain in some form (under other sections of the Trade Act),42 keeping rates higher than 2024 levels. For consumers, this means any recent tariff relief may be short-lived. US importers and manufacturers will continue to face uncertainty, which may impact their investment decisions and dent job growth in certain sectors.
Consumers’ other major worry is the outbreak of hostilities in the Middle East, which has led to a sharp rise in crude oil prices and has almost halted oil and gas exports from the region.43 Prolonged disruptions to shipping lanes in the Strait of Hormuz will also affect trade in other goods such as fertilizers, which in turn will hit food production in Asia44 and may push global food prices up. These price shocks will likely raise domestic inflation in the United States. This will likely make the Fed even more cautious when cutting interest rates. Consumers may, therefore, face a period of relatively higher inflation and elevated borrowing costs for longer than previously anticipated.
By
Akrur Barua
The author would like to acknowledge Dr. Ira Kalish, Chief Global and US Economist, for his reviews, and Ruhika Agarwal from the Economics team for her research and analysis for this piece. He would also like to thank Stephen Rogers, Justin Cook, and Daniel Han from the Consumer Industry Center for their inputs on US consumer trends, including “value-seeking” behavior; and Jaya Nagdeo from the Power, Utilities, and Renewables team for initial ideation and inputs on consumer price trends in utilities.
Editorial (including production and copyediting): Arpan Saha, Sayanika Bordoloi, Anu Augustine, and Pubali Dey
Design: Harry Wedel and Govindh Raj
Audience development: Pooja Boopathy
Cover image by: Harry Wedel
Knowledge services: Agni Wagh
Visit the Deloitte Global Economics Research Center
Access more insights for the consumer spending, housing, business investment, globalization & international trade, fiscal & monetary policy, sustainability, equity, & climate, labor markets and prices & inflation sectors.