The value-seeking consumer
Competitors could lose out to brands offering more than low prices
It is a challenging time for consumer companies, with compressing margins across industry segments, from retailers to restaurants and consumer goods to car companies. Some of the challenges include persistent cost inflation, shifting consumer behaviors, and competitive pressures, all of which could be exacerbated by ongoing demographic, political, environmental, technological, and cultural shifts.1
These headwinds come at a time when it can be particularly challenging to appeal to consumers. Some households still bear scars from the shock of inflation, which has affected consumers’ belief that they are getting fair prices and good value. And they are worried about the future: Sentiment surveys recently experienced large drops or increased volatility as households surveyed could be anticipating economic weakness and a possible resurgence of inflation.2
Consumer value seeking may be becoming more pervasive and intense. Consumers want more value for their money, but what constitutes value may not be obvious. Consider two hypothetical grocery brands:
- Brand A’s stores are compact and no-frills; selections are produce-centric and vary from month to month based on which products can be acquired inexpensively, allowing the stores to offer low prices.
- Brand B’s stores have shiny, clean aisles, soft music, a global array of specialty foods, and various prepared options. But these features come with somewhat higher prices.
Price is often thought of as “what you pay,” and value, “what you get.” But in consumers’ eyes, which offers better value for the money—the no-frills, budget-oriented brand or the higher-end, higher-priced brand? Our extensive research into consumers’ views and behaviors concerning value suggests that the answer is more complicated than it may seem.
Despite being separate concepts, price and value are inherently intertwined. In fact, price perception can predict a great degree of perceived value. That said, as will be demonstrated, as much as 40% of consumer perceptions of a brand’s value stem from factors other than price.3 Certain brands enjoy higher perceptions of value than would be predicted based on their prices, suggesting they are especially good at providing this excess value.
These “more-value-for-the-price” brands, or MVPs, are winning share in the marketplace: Consumers have been more likely to start buying from them and to say they intend to buy more from them in the future than from their “lower-value-for-the-price” (LVP) peers. MVPs exist at all price points and across consumer industry segments, suggesting that brands across the whole consumer spectrum have options to bolster their perceived value and strengthen their competitive positions while opening new pathways to margin expansion.
Table of Contents
- Value headwinds
- Value seekers
- Differentiating between price and value
- Brands aim to offer 'more-value-for-the-price'
- How can brands offer more value?
- Winning on price and value
Methodology
We examined value seeking from the consumer’s perspective.
- Using three years of HundredX™ survey data ending February 2025, we analyzed over 900,000 consumer data points across 290 consumer brands as consumers experience them in the marketplace—assessing relative price and value perceptions, the factors that drive those perceptions, and net purchase intent for related brand groupings. As context, HundredX™ survey participants self select brands to evaluate based on their past purchase experiences and future intent.
- The financial performance of brands as an indicator of success can be challenging to assess, as their corporate owners/parents often do not report results at an individual brand level. A Converge™ by Deloitte panel of approximately 5 million credit card transactions, covering the three years through February 2025, enabled us to track brand-level shifts in consumer purchases and compare the performance of brands with more and less perceived value relative to their perceived prices.
- Companies also discuss their brand strategies in earnings calls and annual reports. We used AlphaSense™ to analyze over 300 company transcripts and reports to identify common strategic capabilities across similarly performing brand groupings.
- Data from 43,560 consumers who took Deloitte’s TrustID™ survey allowed for brand performance assessments on the four factors of trust: capability, reliability, transparency, and humanity.
- Survey data from 9,000 US consumers, collected through the Deloitte ConsumerSignals platform from September 2024 through May 2025, was used to track consumer value-seeking prevalence, intensity, demographics, correlated precursors, and downstream effects on spending intent.
Value headwinds
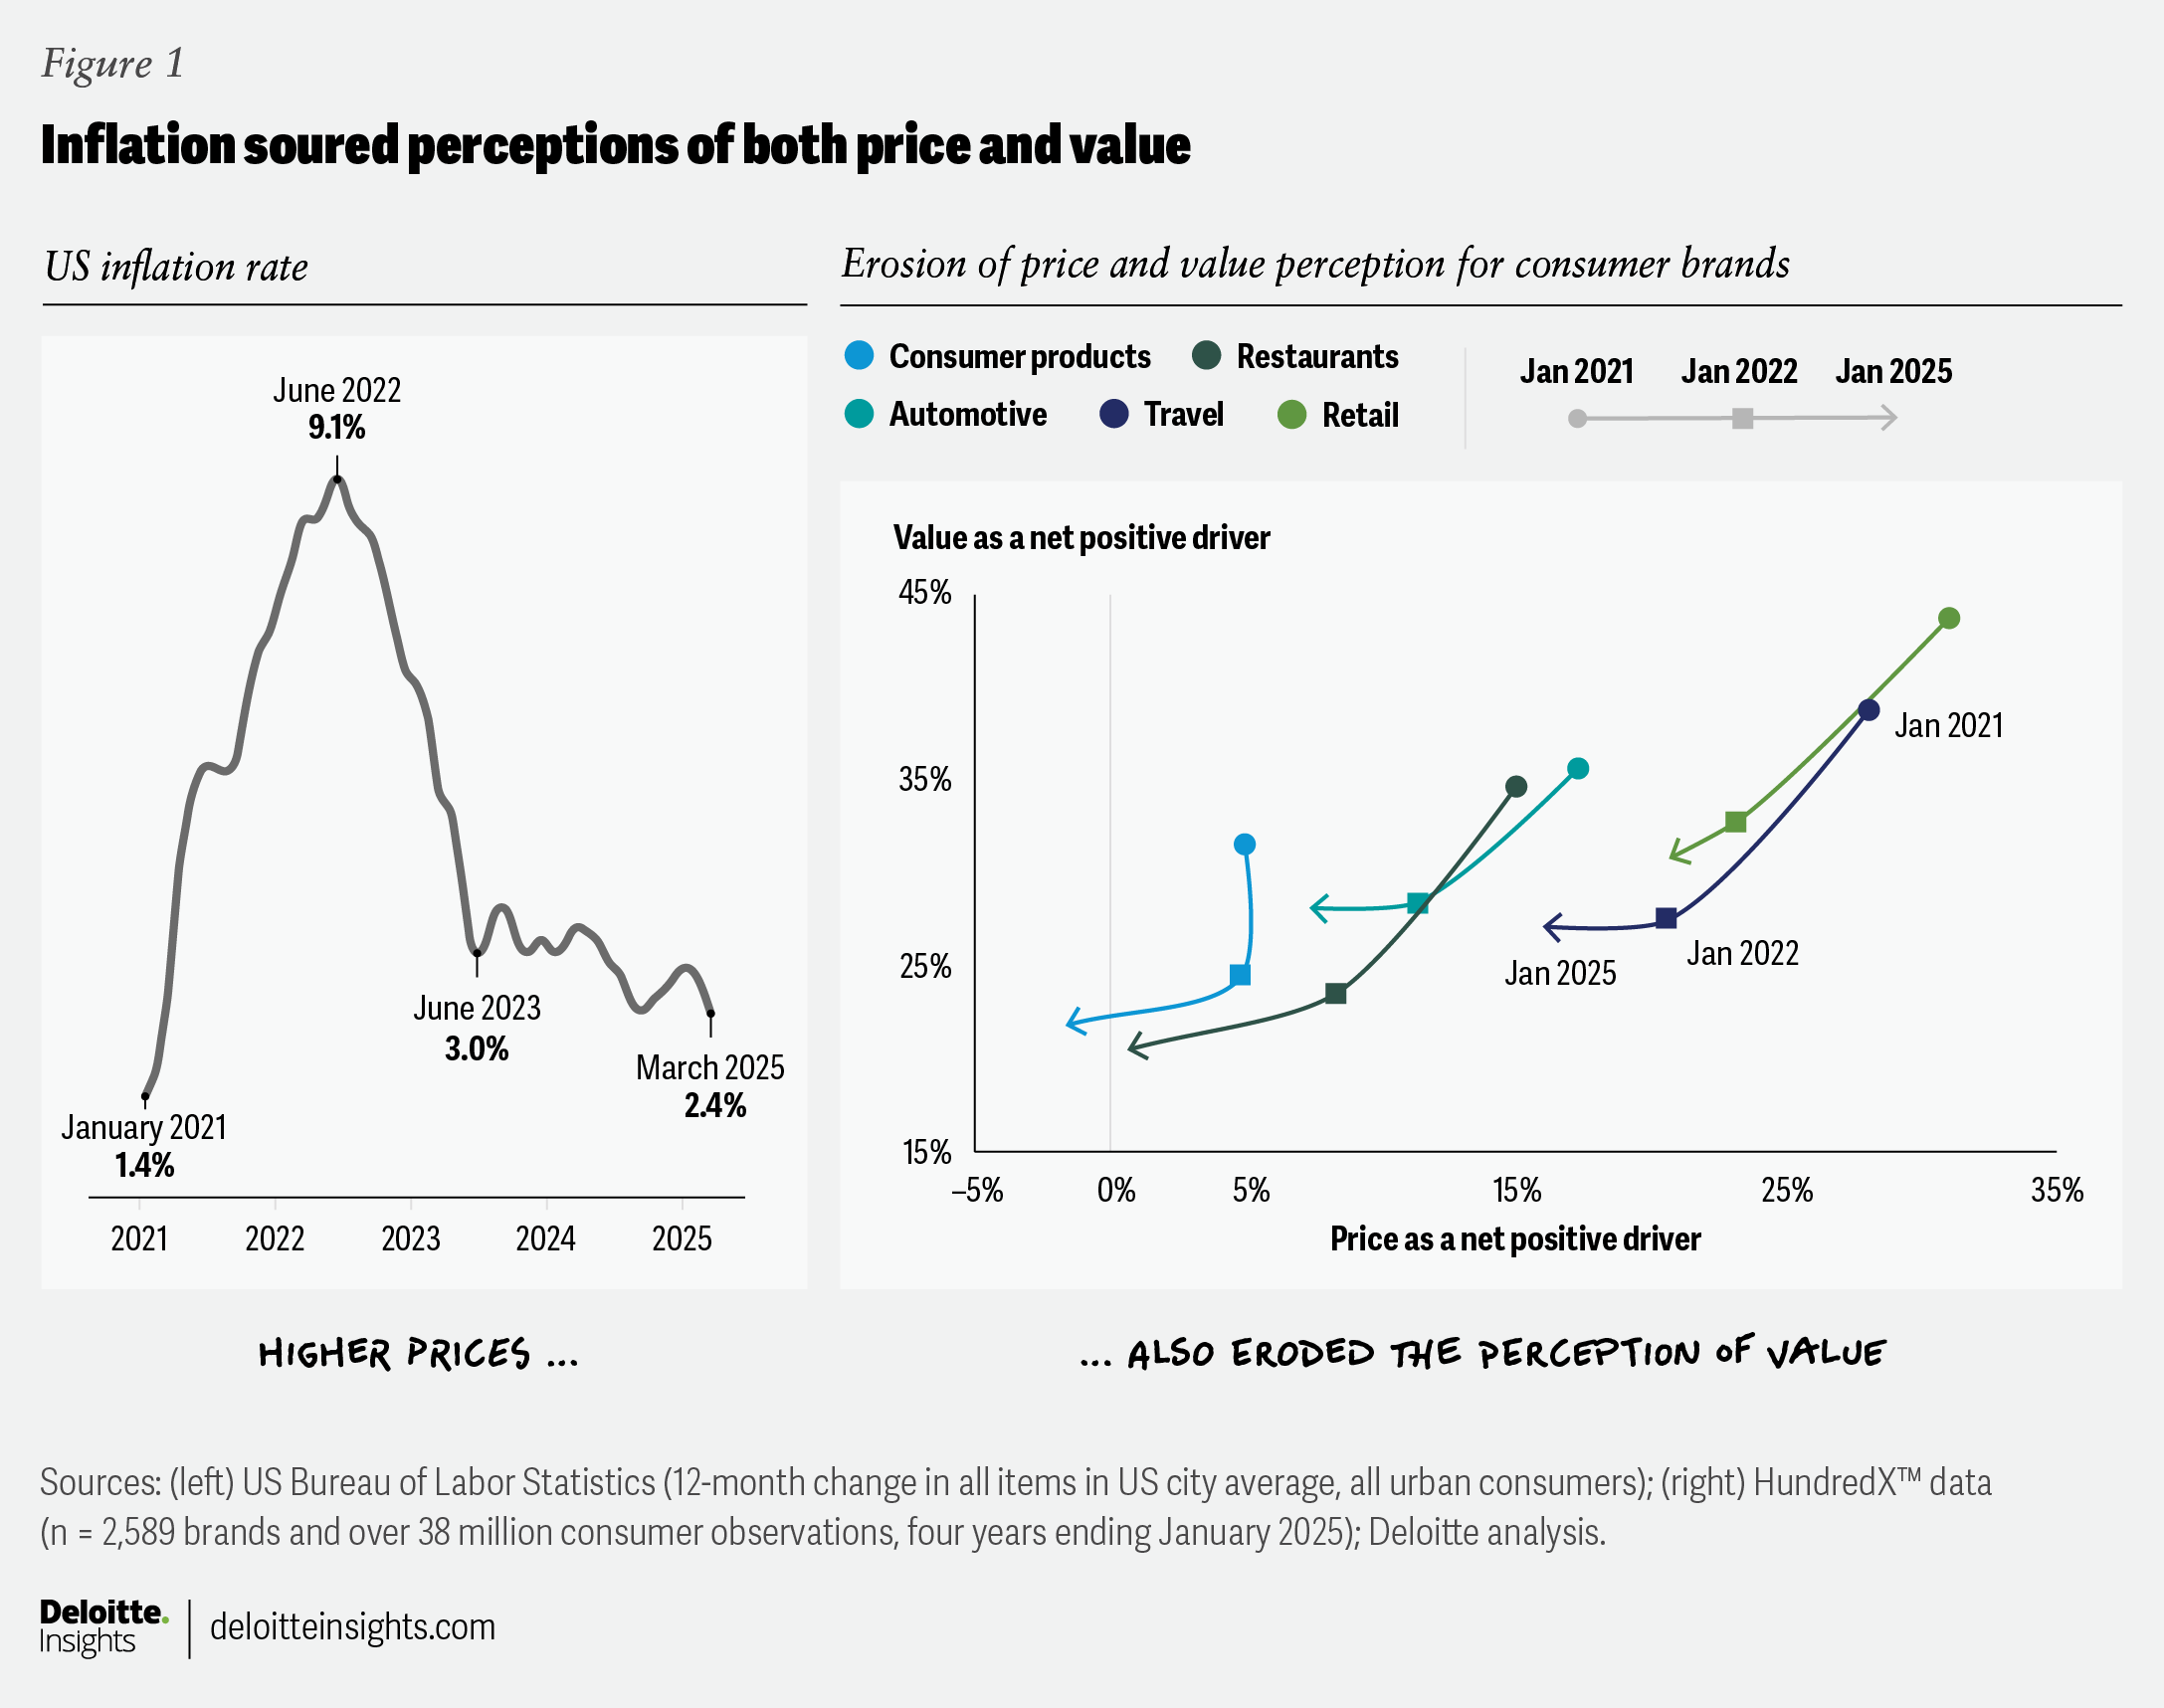
The rise in inflation that peaked in 2022 appears to have taken a toll on the mindsets of consumers surveyed, in addition to their pocketbooks. This mindset change is reflected in eroding price and value perceptions (figure 1). The chart on the right shows the extent to which consumers said price and value were net positive drivers of their purchasing decisions.4 The farther right a dot is on the chart, the more they said price was a positive driver; the higher the dot, the more they said value was a positive driver.
“Visited yesterday. Clothing prices seemed to be high compared to the value I used to get.”
Across multiple consumer sectors, the inflationary price shock that peaked in 2022 corresponds with the dramatic drop in perceptions of both the prices companies charge and the value they provide. Those perceptions haven’t recovered even as inflation declined, creating a headwind for consumer brands to navigate.
With value headwinds already blowing, several indicators suggest consumer concerns about value and price may grow. April brought the steepest three-month percentage decline in University of Michigan’s expectations index since the 1990 recession.5 Meanwhile, year-ahead inflation expectations jumped from 2.6% in November 2024 to 6.6% in May 2025.6
“This restaurant has good food but the portion sizes for the price you pay are not a very good value.”
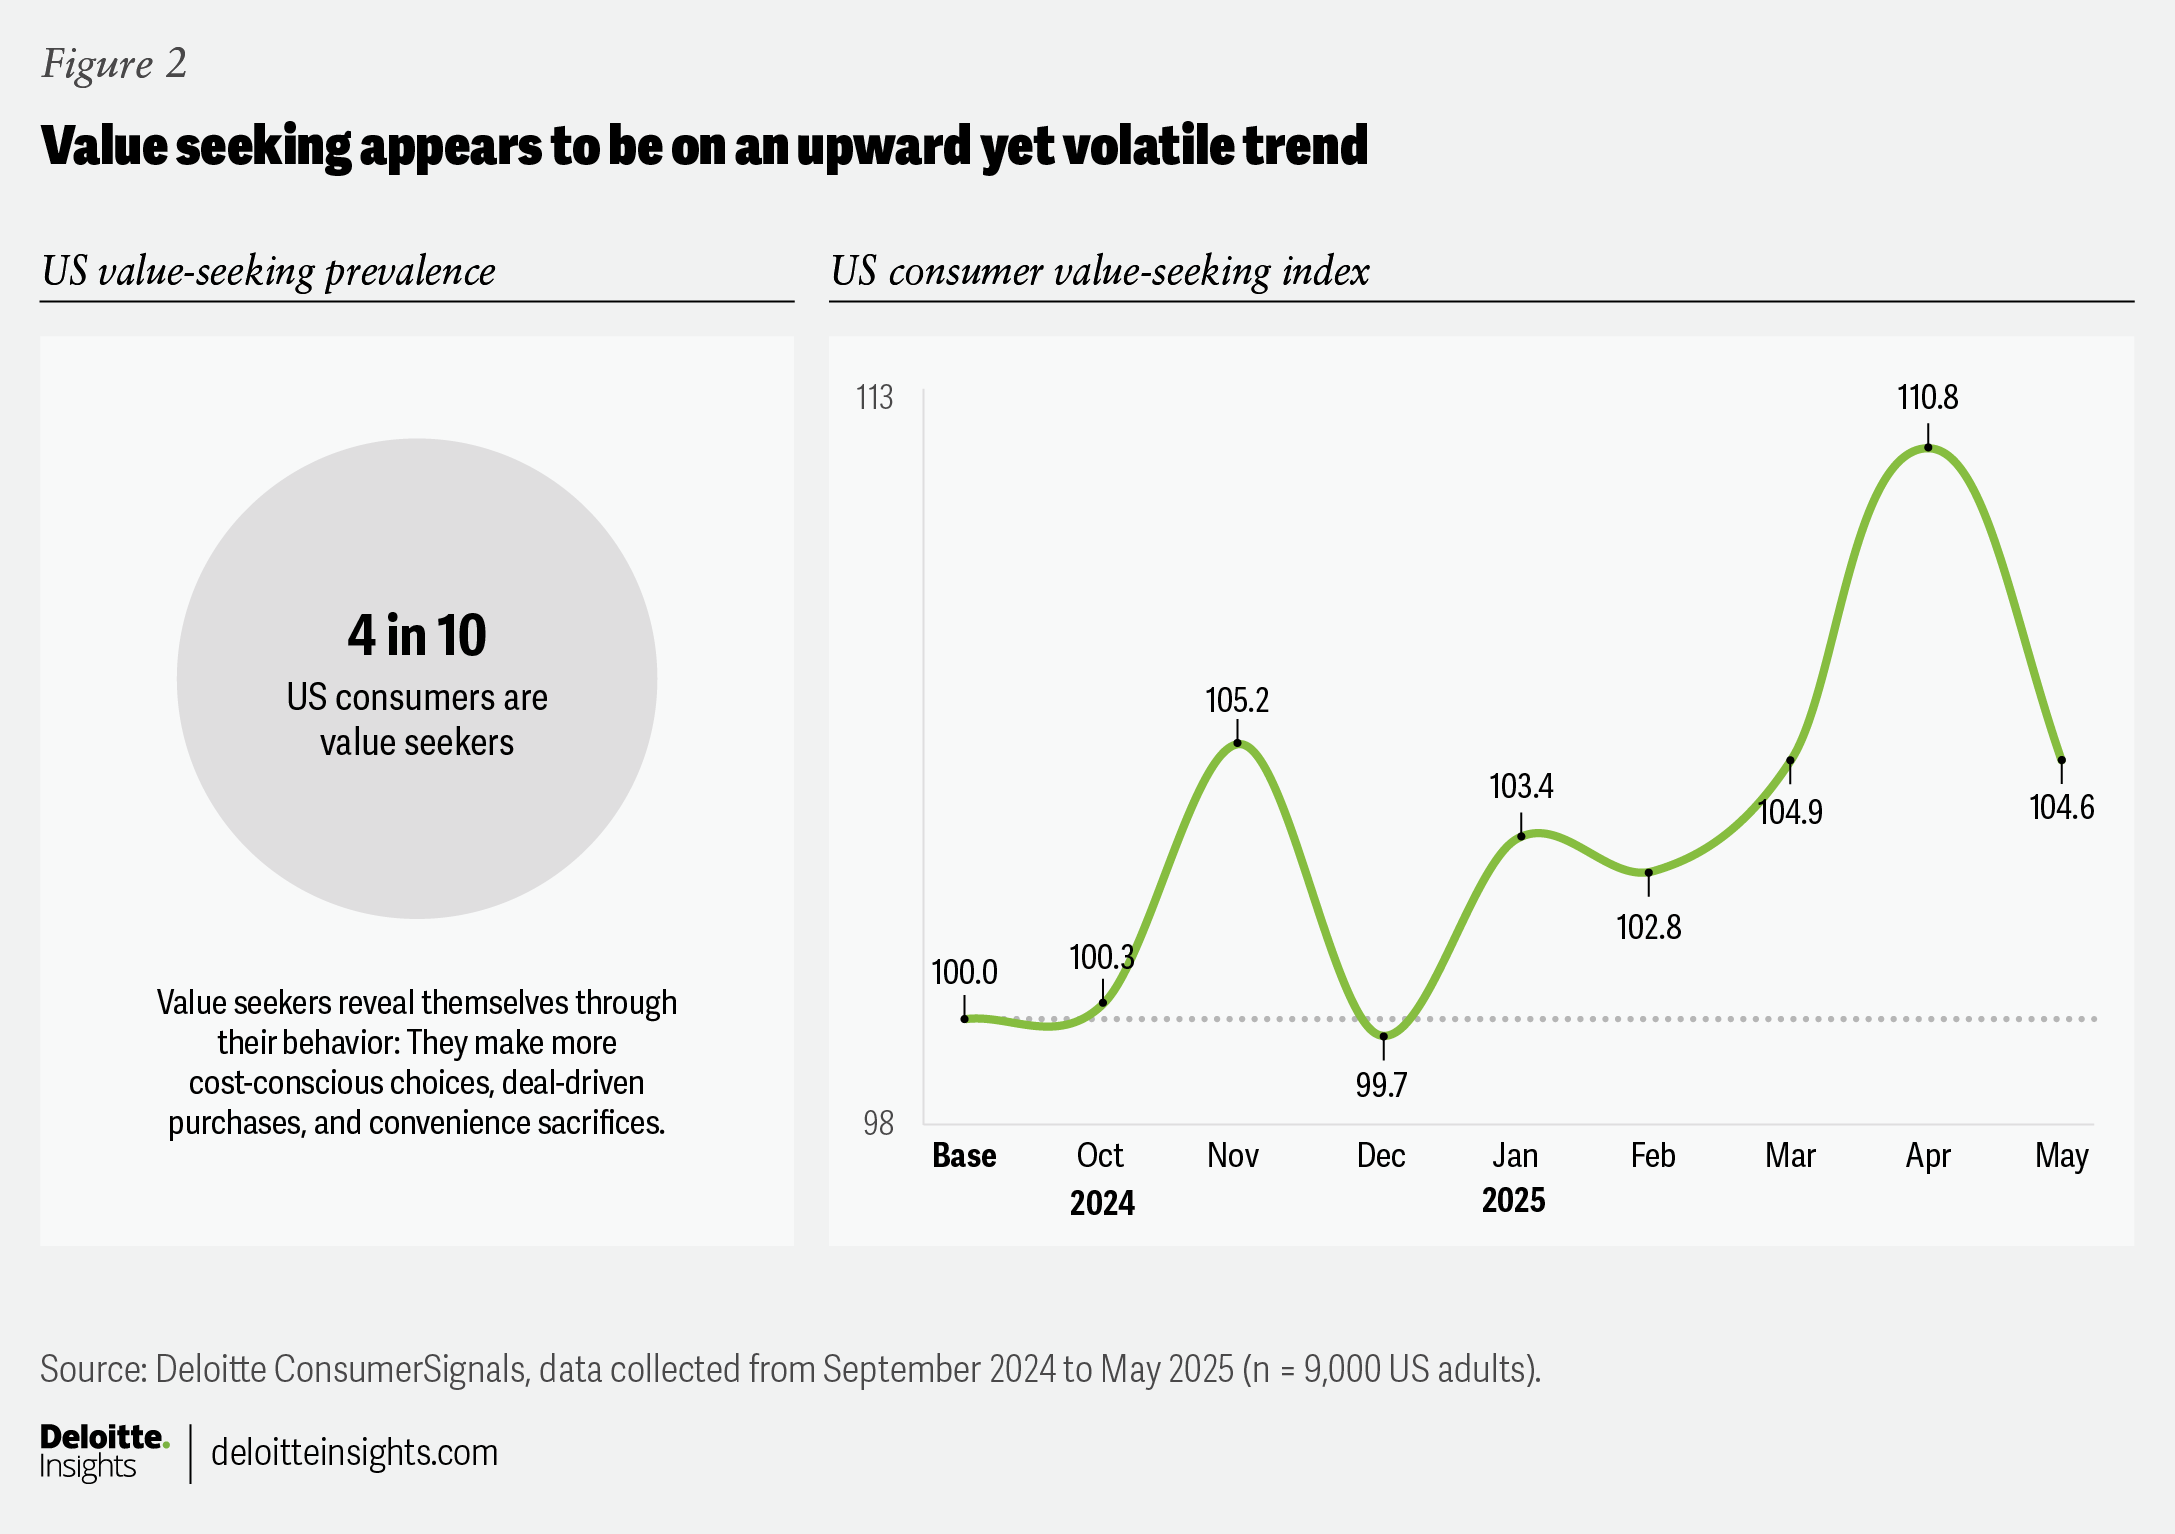
Today, 4 in 10 Americans are value seekers—defined as surveyed consumers who exhibit three or more cost-conscious, deal-driven, or convenience-sacrificing behaviors each month across grocery/retail, restaurants, leisure travel, and automotive.7 Over recent months, value seeking appears to be on an upward yet volatile trend (figure 2). During select periods, consumers may have temporarily relaxed their search for value due to buying ahead of tariffs, worries about potential price increases, or concerns about possible shortages of imported goods—whether or not any misgivings actually materialized.
Who are the value seekers?
Value seekers span ages as well as income groups. Millennials and Generation Z may be more financially strapped, on average, but baby boomers and Generation X lead the way, as nearly half of the members of these older generations are value seekers.8
“They are a little inconvenient for me, but the value is typically worth it.”
And if you assumed they all have low incomes, you’d be wrong. Nearly 3 in 10 value seekers are part of young families with six-figure median incomes. While income limitations may motivate lower-earning and fixed-income households, a wider range of factors contribute to higher-income consumers seeking value—including their take on the economy, job opportunities, retirement readiness, housing affordability, maintaining lifestyle, and desire to travel.9
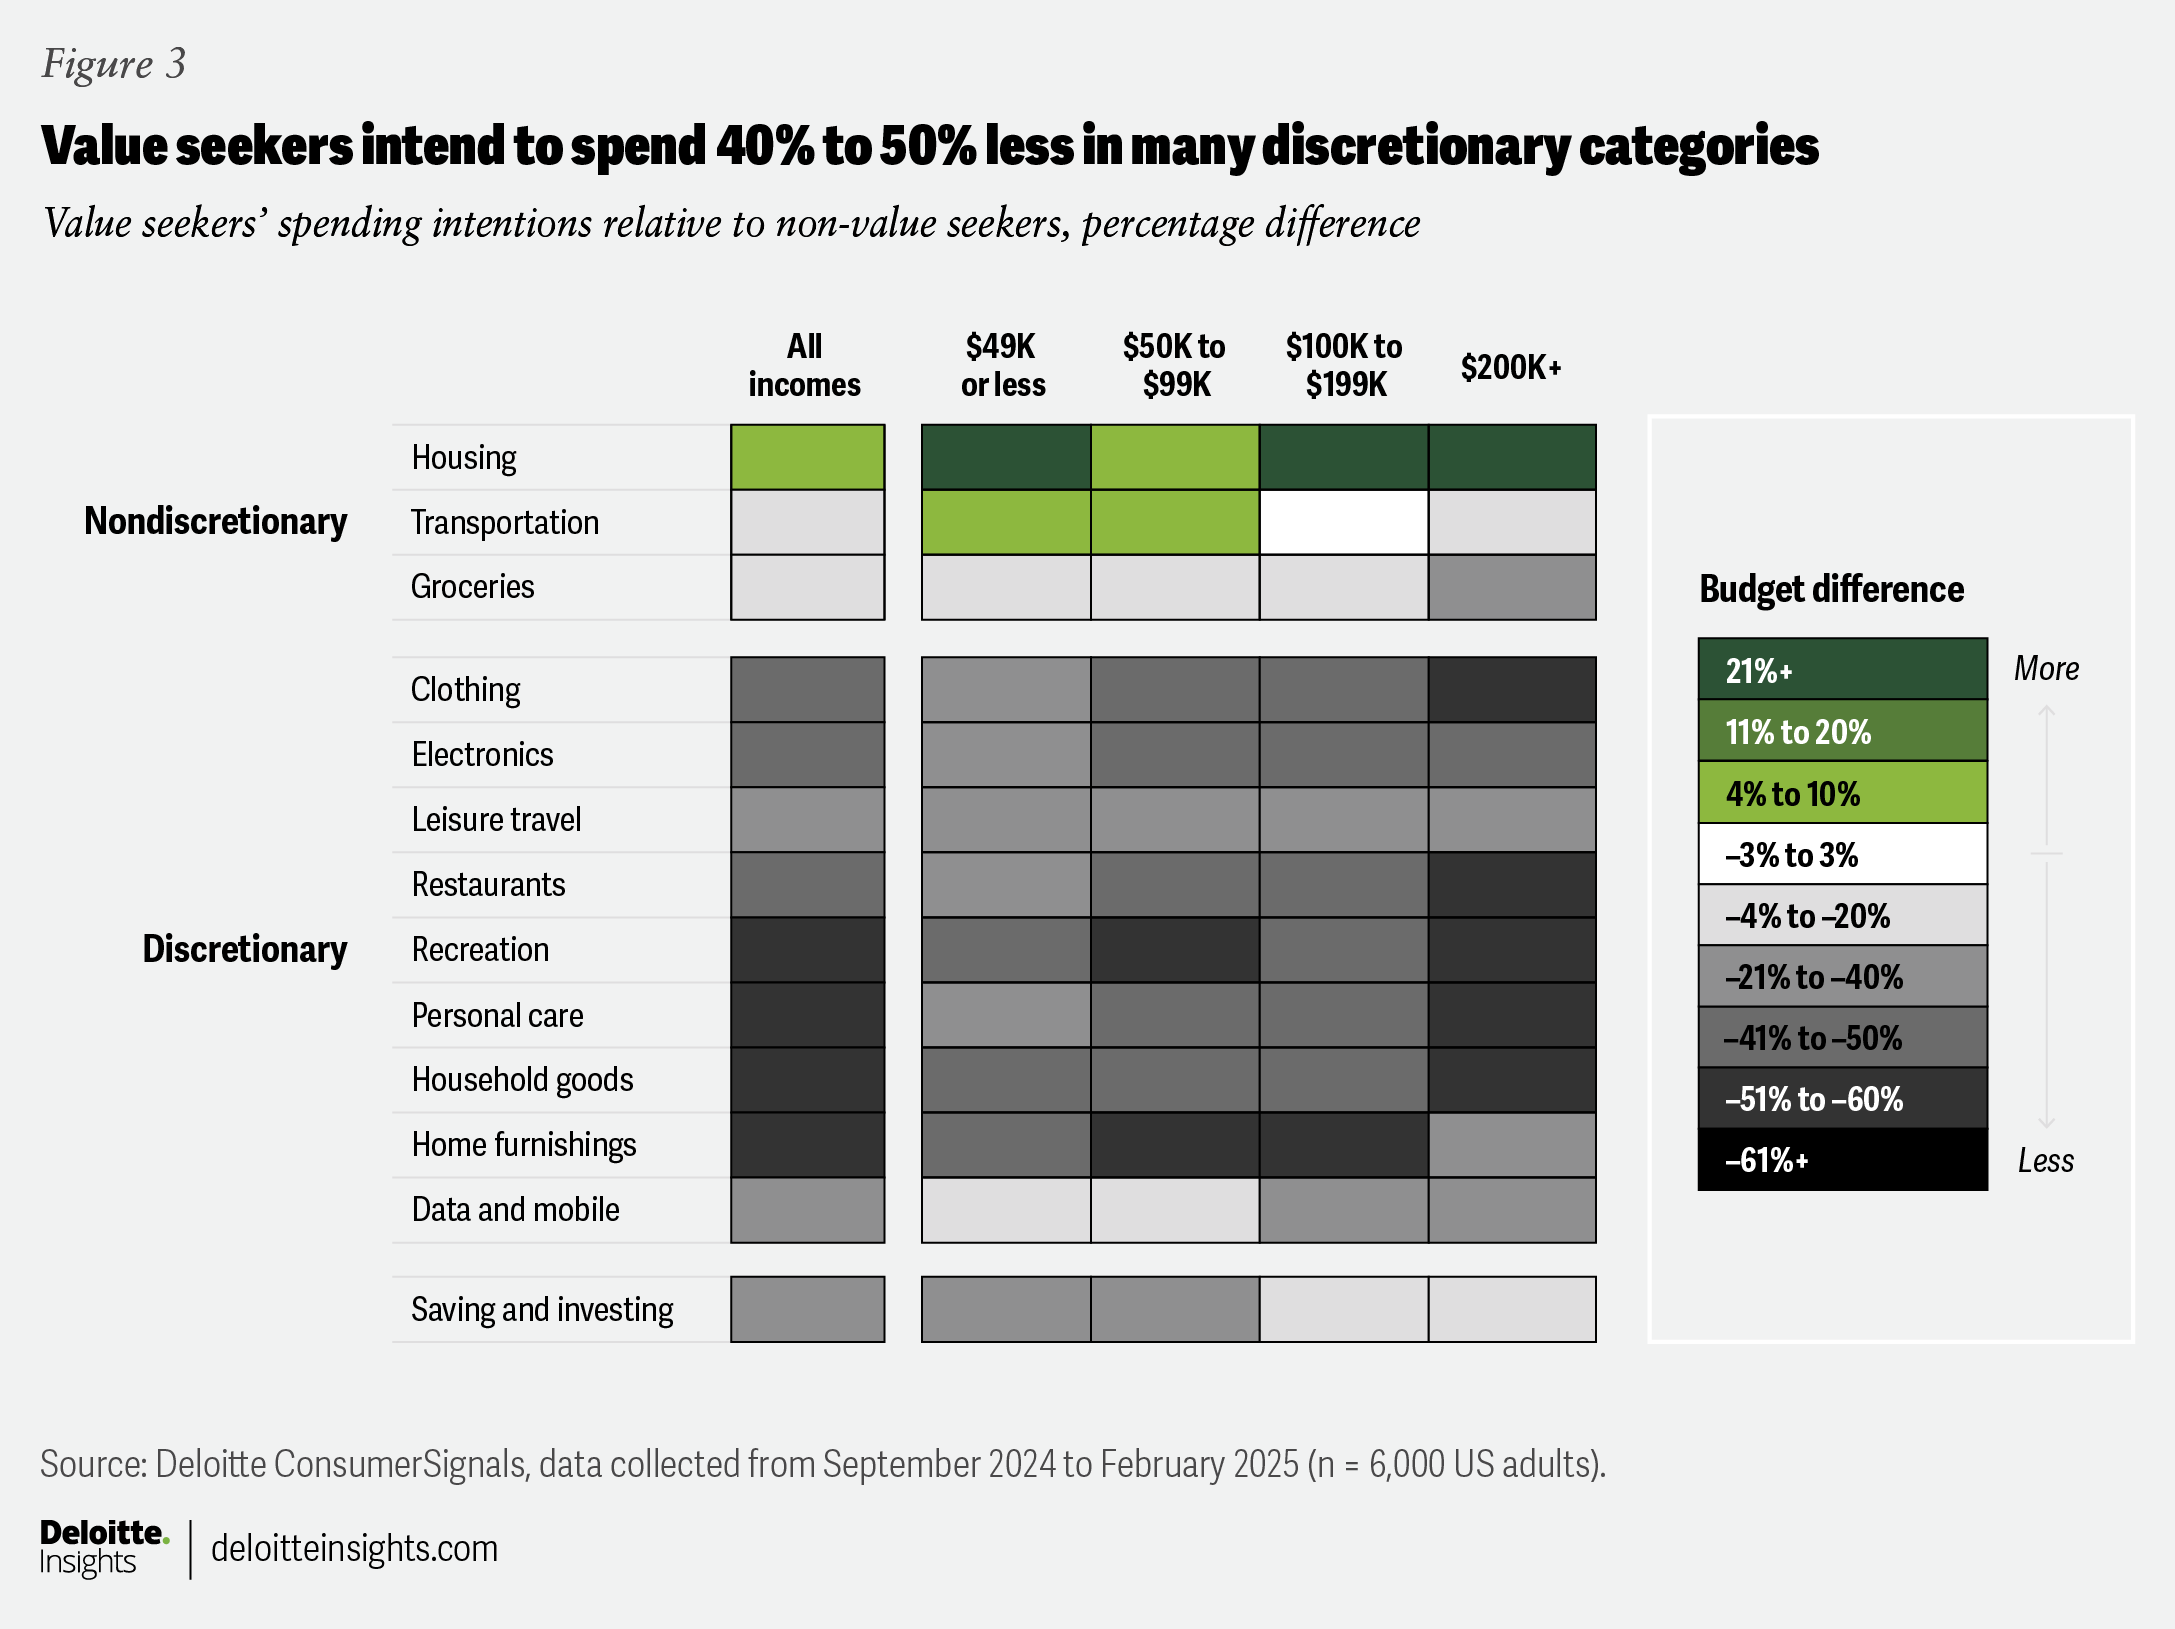
Value seekers surveyed across the board allocate a greater percentage of their budget to cover non-discretionary essentials like housing (and transportation for households with income below US$100,000). So, they may need to free up space in their budget by taking from discretionary categories (figure 3).
On more discretionary categories, most value seekers indicate they intend to spend substantially less than their non-value-seeking peers with equivalent earnings. Lower-income consumers show the least difference in discretionary spending intent. However, higher-income value seekers intend to spend around half as much on categories like clothing, restaurants, recreation, personal care, and household goods relative to their non-value-seeking income peers.
Two discretionary categories appear relatively insulated from dramatic cuts: data and mobile and leisure travel.
The difference between price and value
Value and price are linked (figure 4). This relationship is apparent in expressions like “bang for your buck” and “worth every penny.” It is also evident in the data. When exploring consumers’ perceptions of price and value as net positive drivers across multiple subsectors, regression analyses suggest that price perceptions account for 60% to 90% of consumers’ perceptions of value (figure 4).
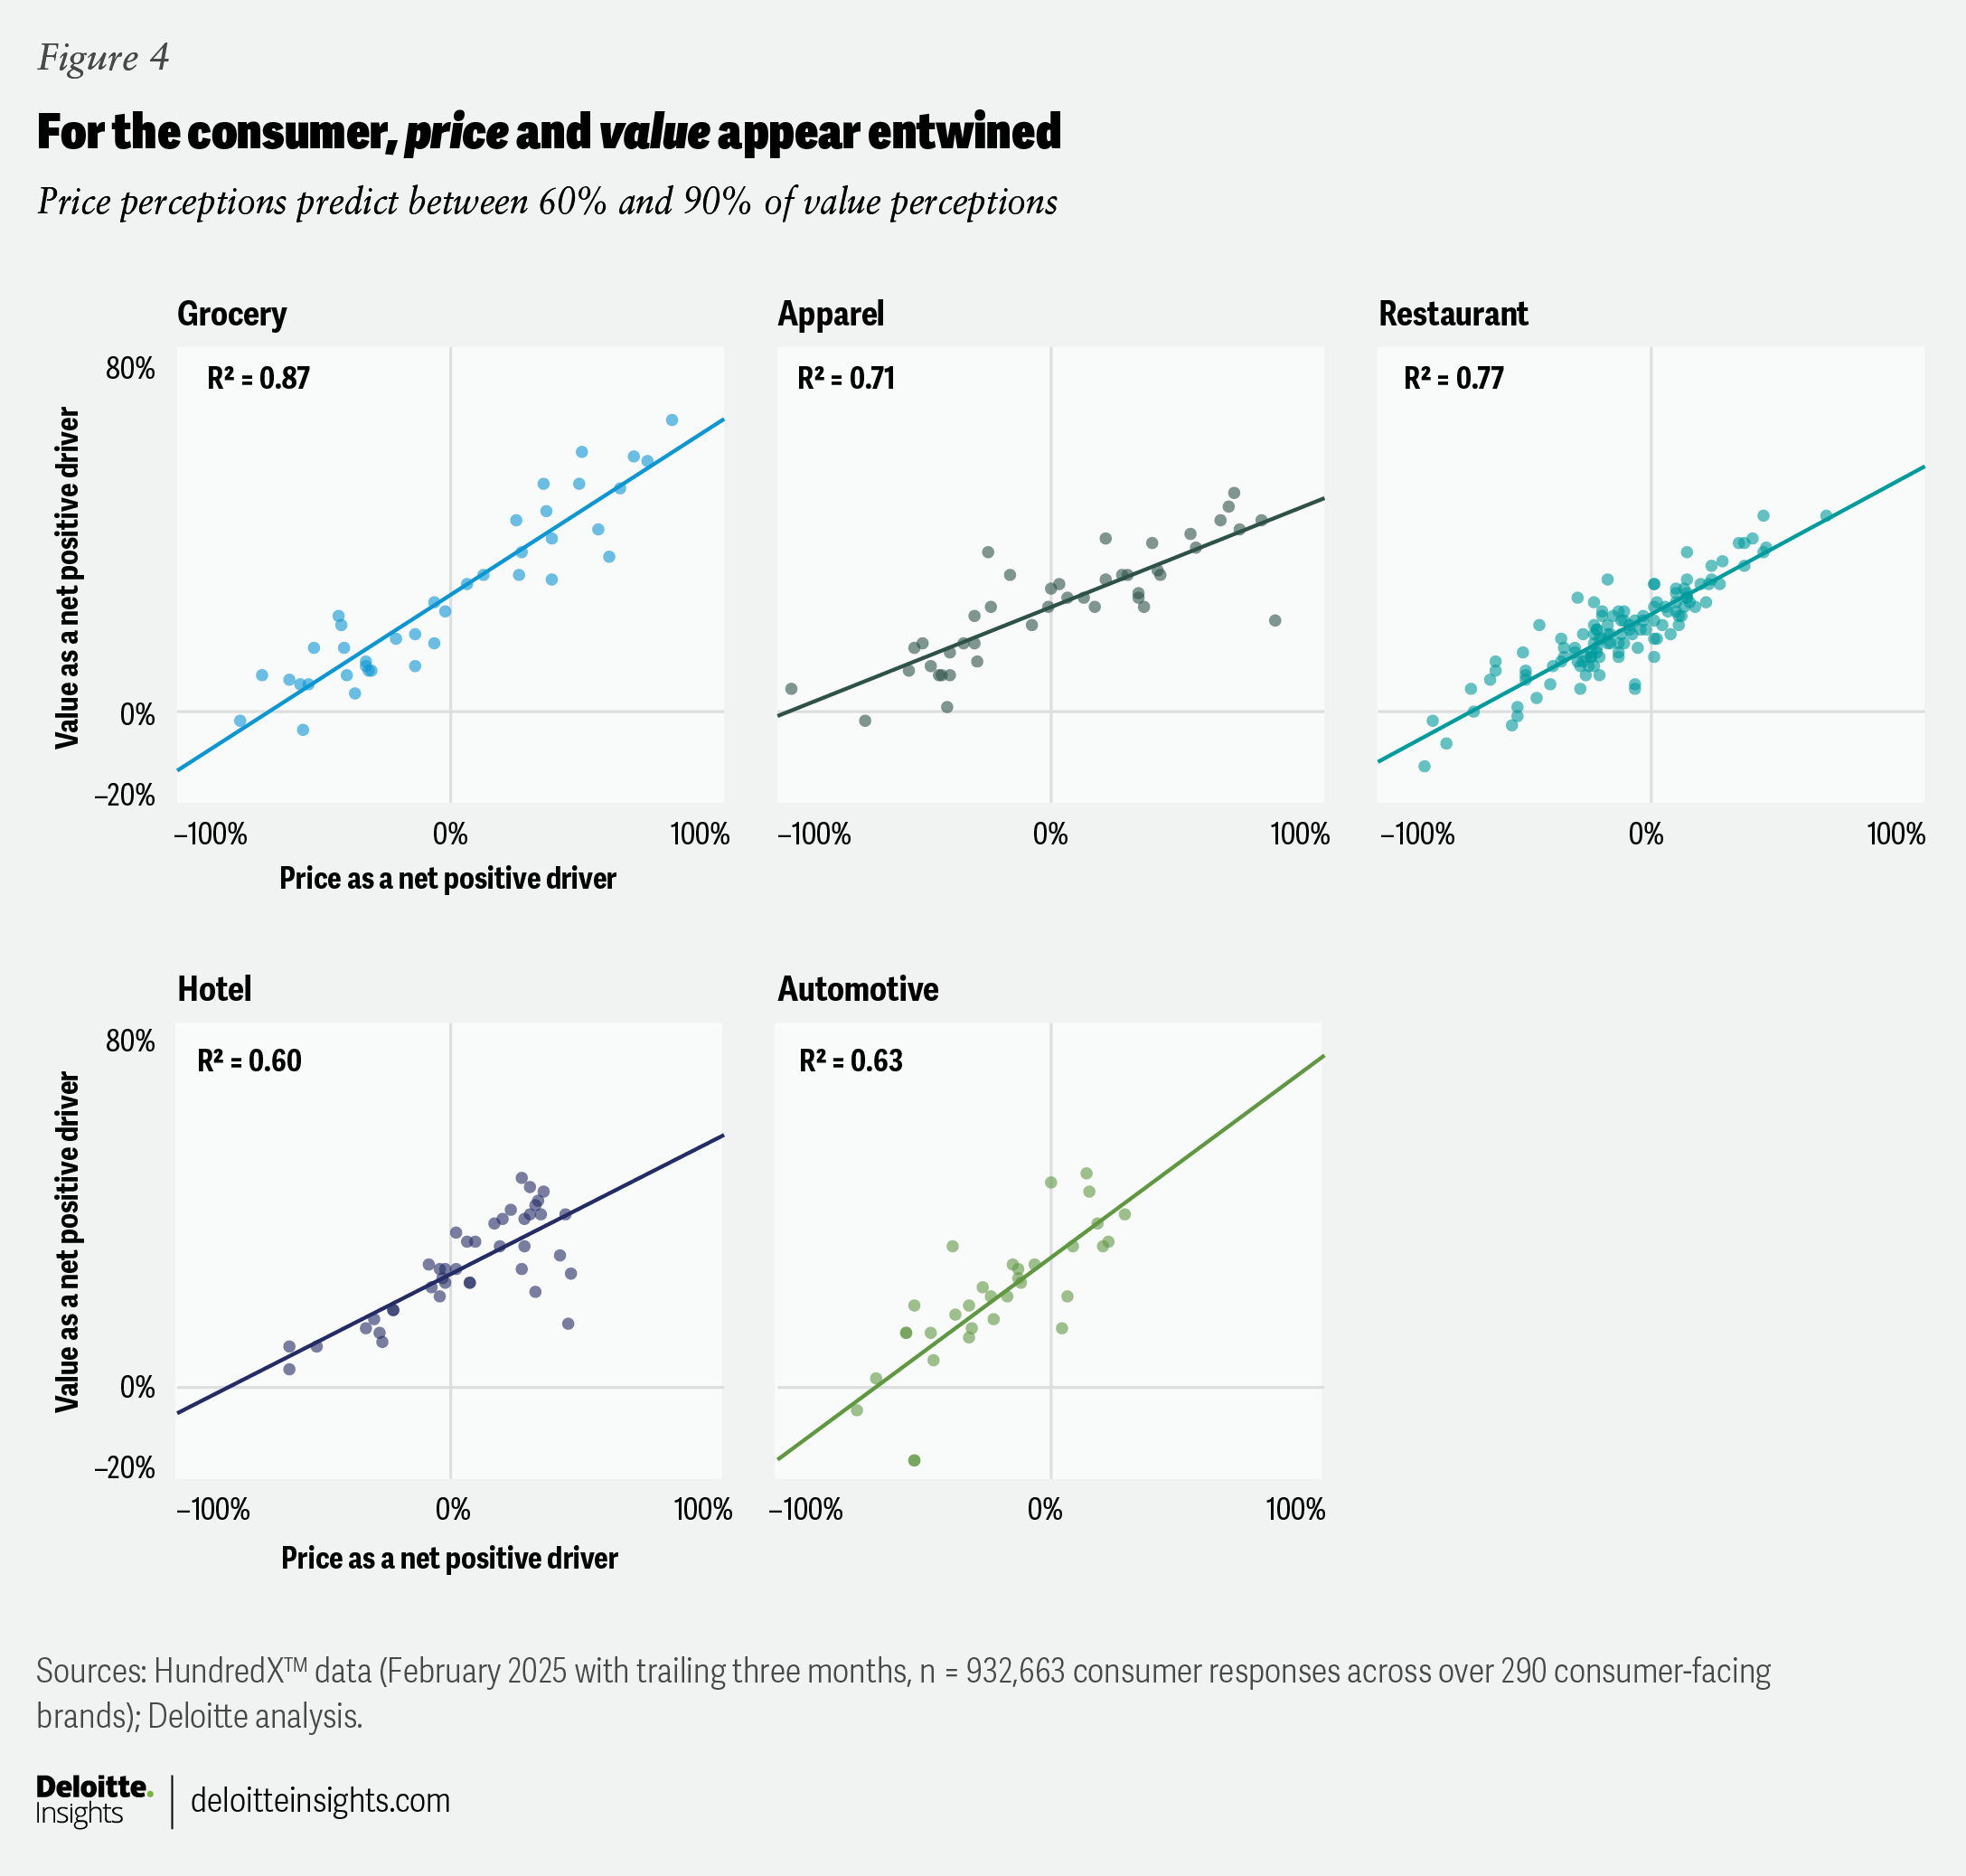
But price isn’t everything. The inverse observation may be as important for brands: Between 10% and 40% of value perceptions arise from factors other than price.10 Understanding those factors and crafting a complementary value proposition may allow those brands to command a competitive advantage, even with today’s value-seeking consumer.
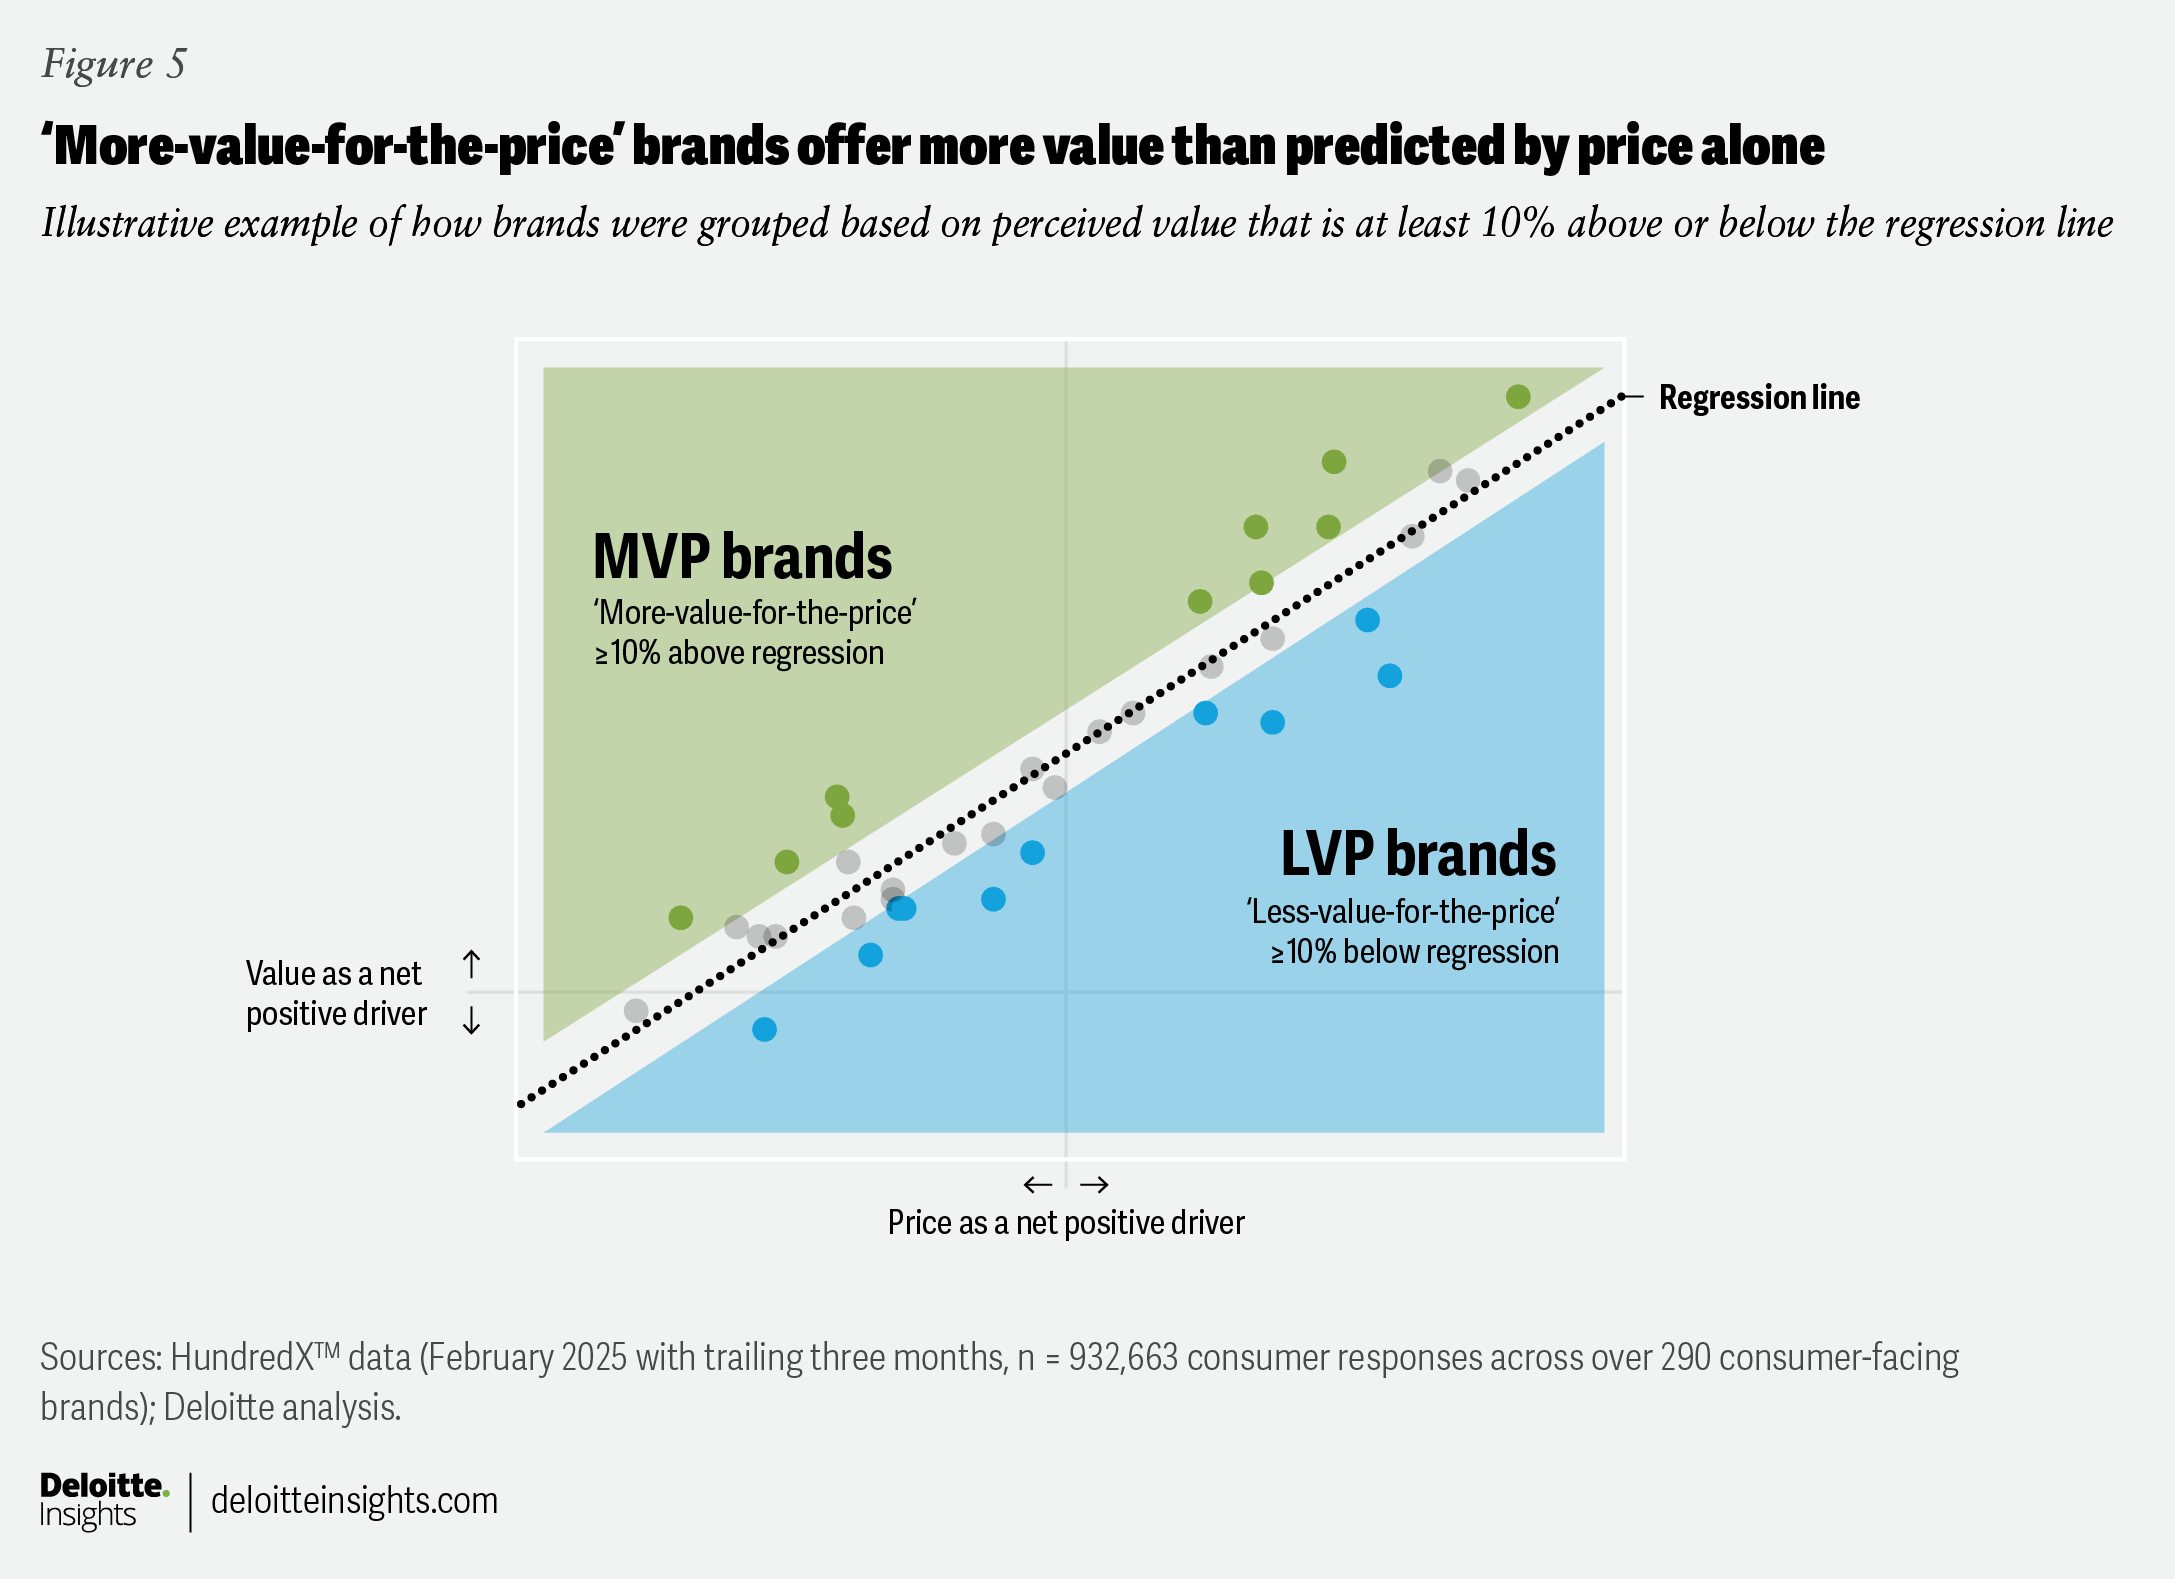
Brands vie for MVP status
The dots well above the regression line in figure 5 represent brands with perceptions of value higher than might be expected based on respondents’ perceptions of their prices. The dots well below the regression line represent the opposite: These are brands for which consumers had perceptions of value lower than expected, given consumers’ feelings about their prices. MVP brands comprise those whose value perceptions are at least 10% higher than would be predicted based on price perceptions alone.
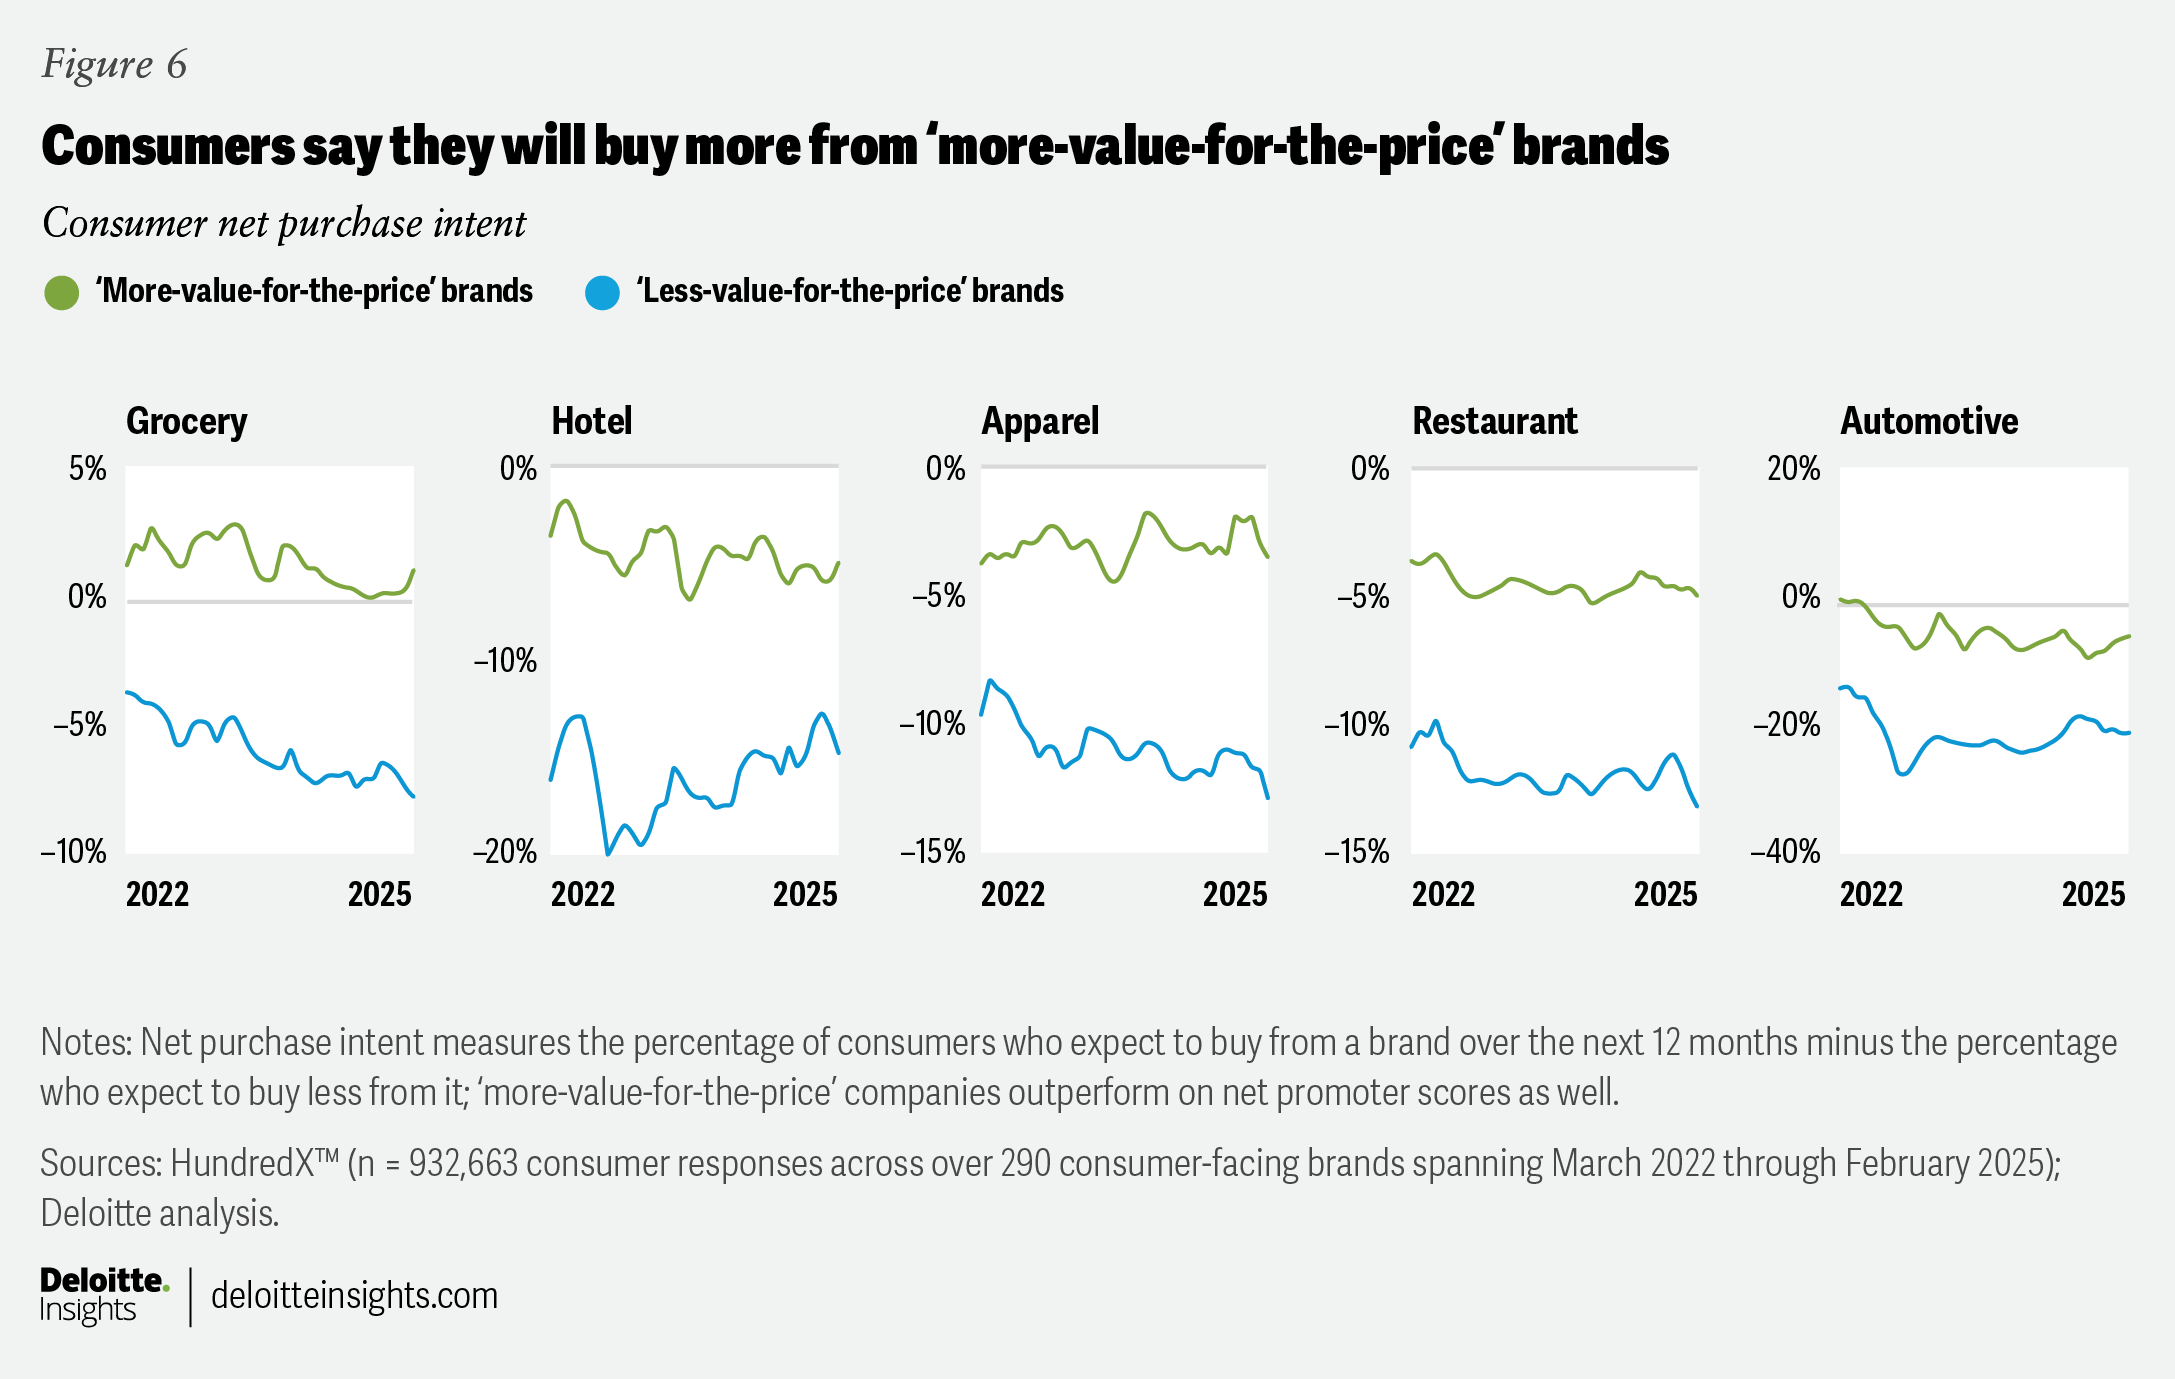
The preference to buy from MVP brands was consistent over the 36 months ending February 2025. Consumers expressed greater net purchase intent for MVP brands across all five sectors (figure 6).
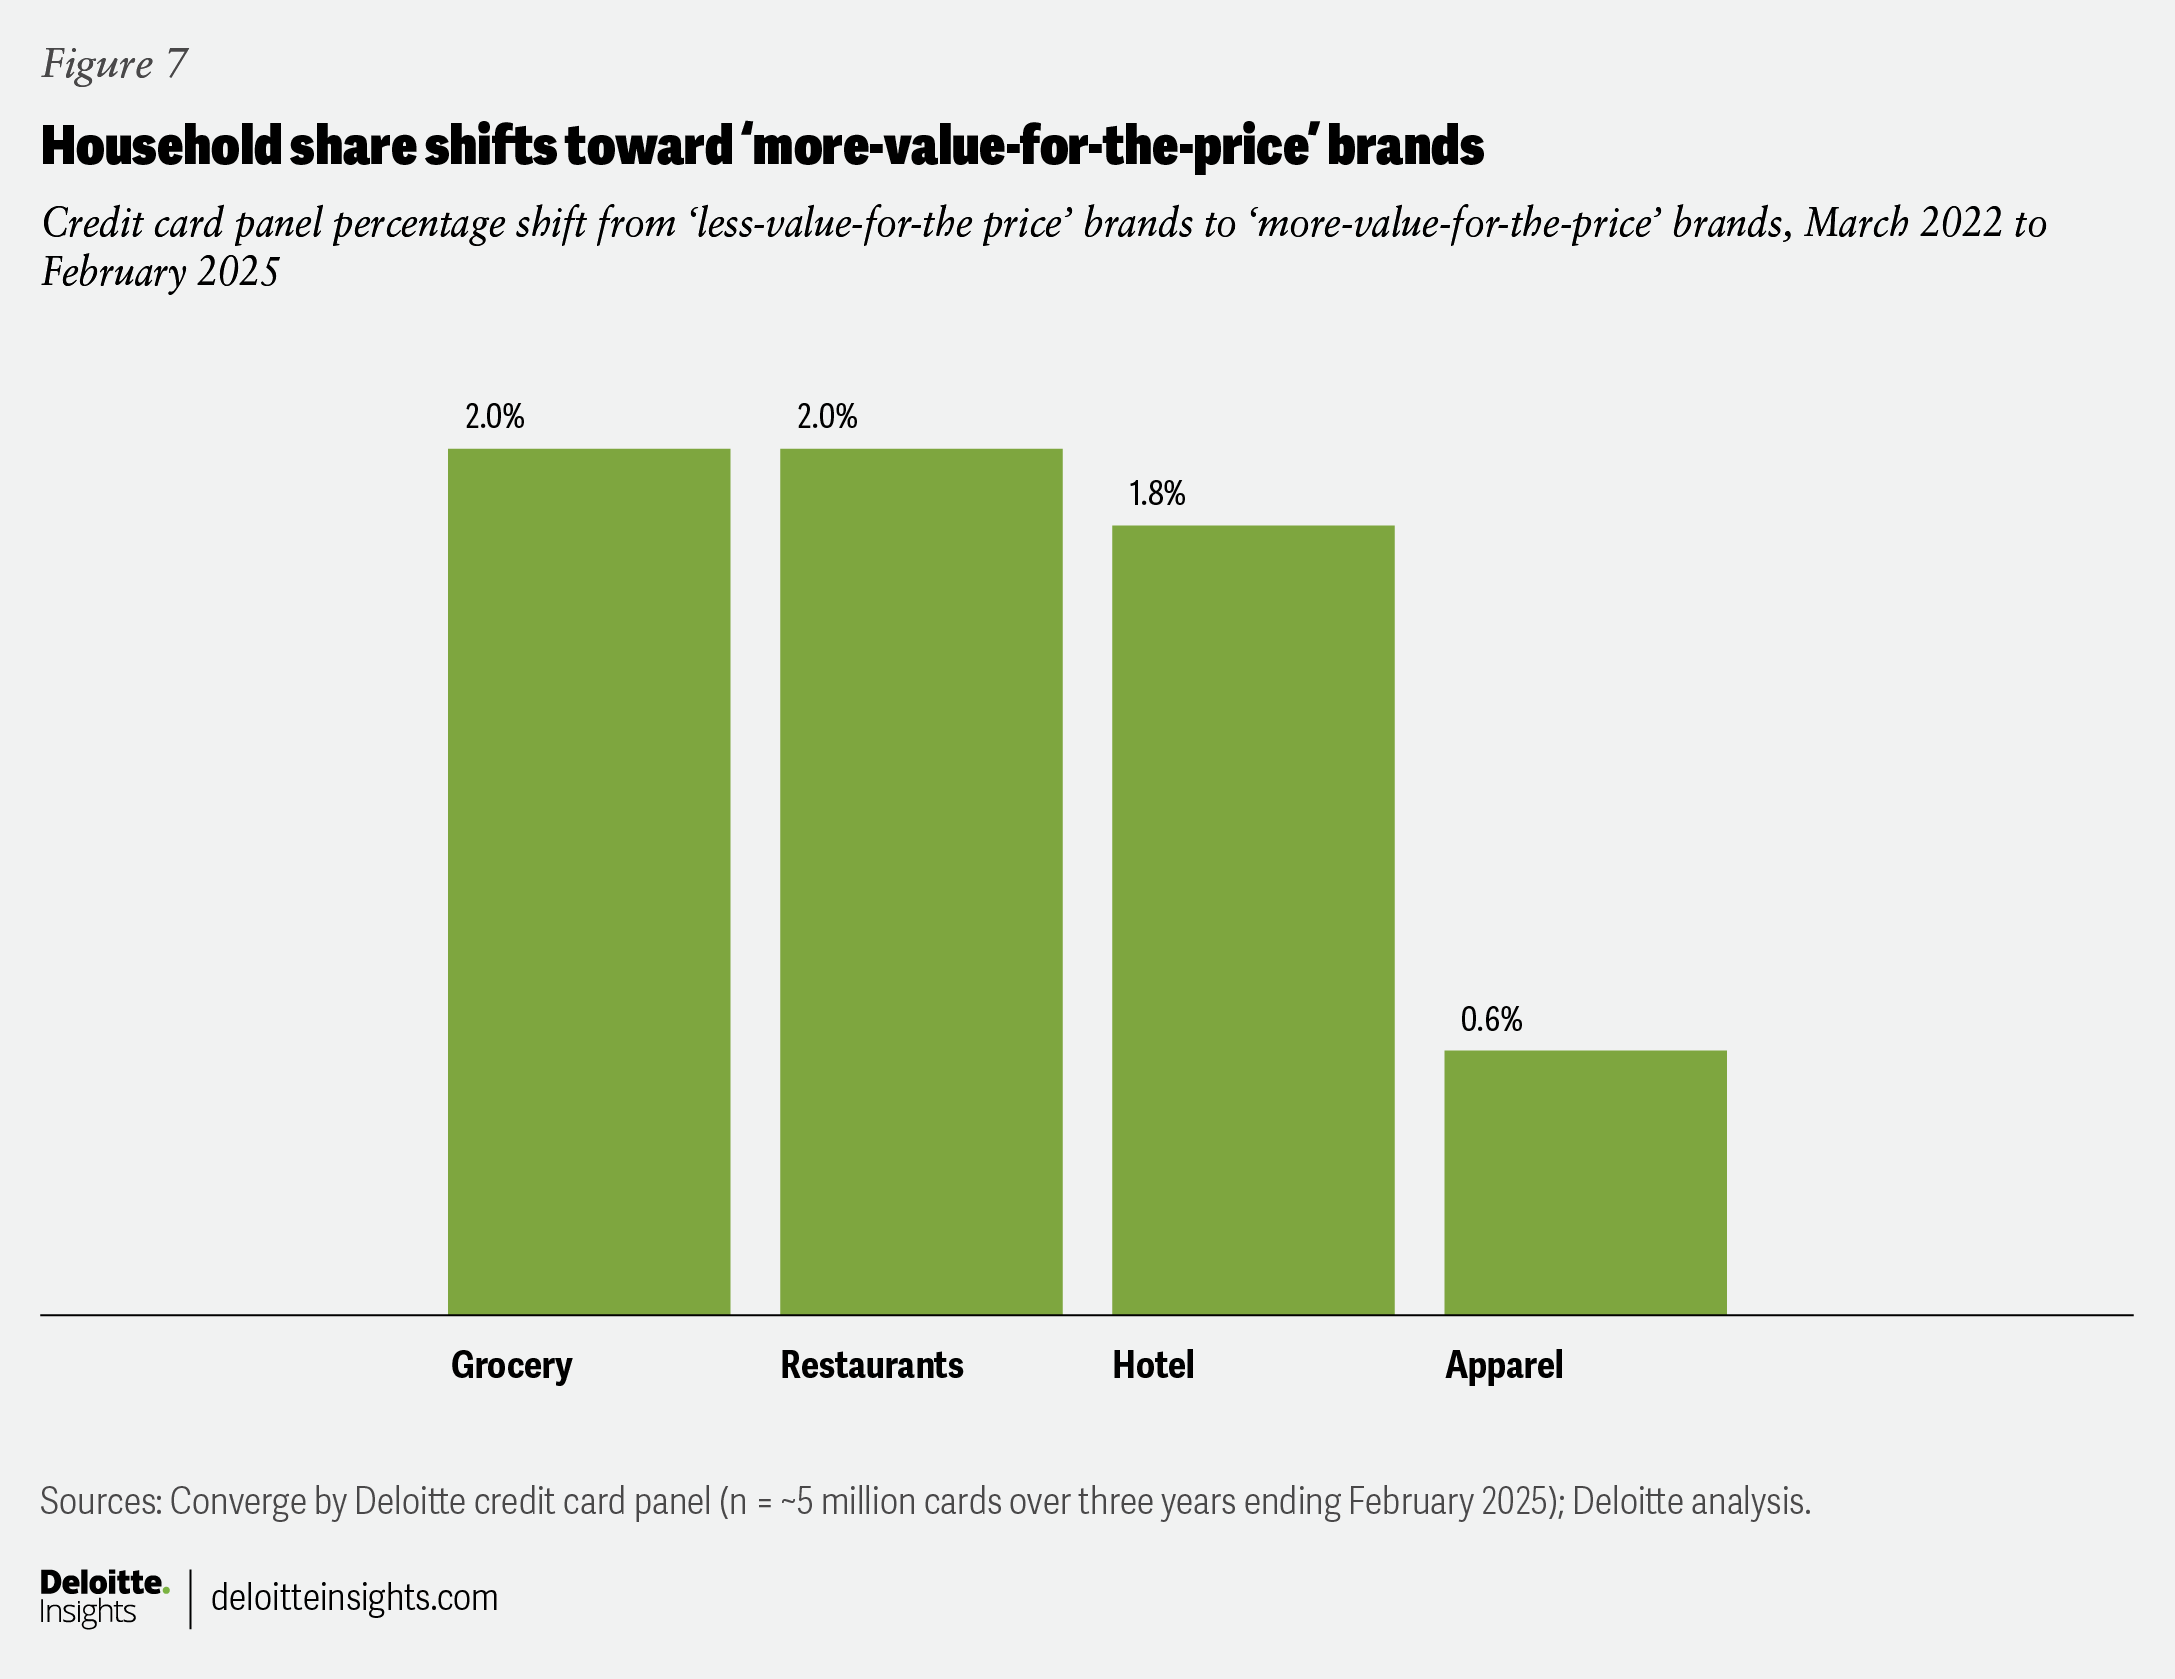
Moreover, consumers didn’t just say they intended to spend more with MVP brands in a survey. They also voted for those brands with their wallets—or, more precisely, their credit cards. Based on transactions from Converge™ by Deloitte’s panel of 5 million credit cards over three years, the share shifted roughly 2% from purchasing at LVP to purchasing at MVP brands across grocery, restaurants, and hotels, with a more minor but meaningful shift for apparel (figure 7).11 (Automotive is not included in this analysis, as consumers tend not to buy vehicles with credit cards.)
How can brands rise above the rest?
Winning formulas for value can take various forms across the full spectrum of pricing tiers. A low-cost hotel can offer something extra by being especially family friendly; an expensive hotel can provide little luxuries that can make spending a lot on a special occasion feel more, well, special. One apparel retailer might cultivate a unique vibe and brand identity that certain consumers may happily pay more to associate with. Meanwhile, another retailer might follow quickly in their footsteps with similar but less expensive clothing in an exciting treasure-hunt style atmosphere. All can be MVPs.
“Merchandise is pricey but very good quality. Holds up for years.”
A consumer-facing view of success factors
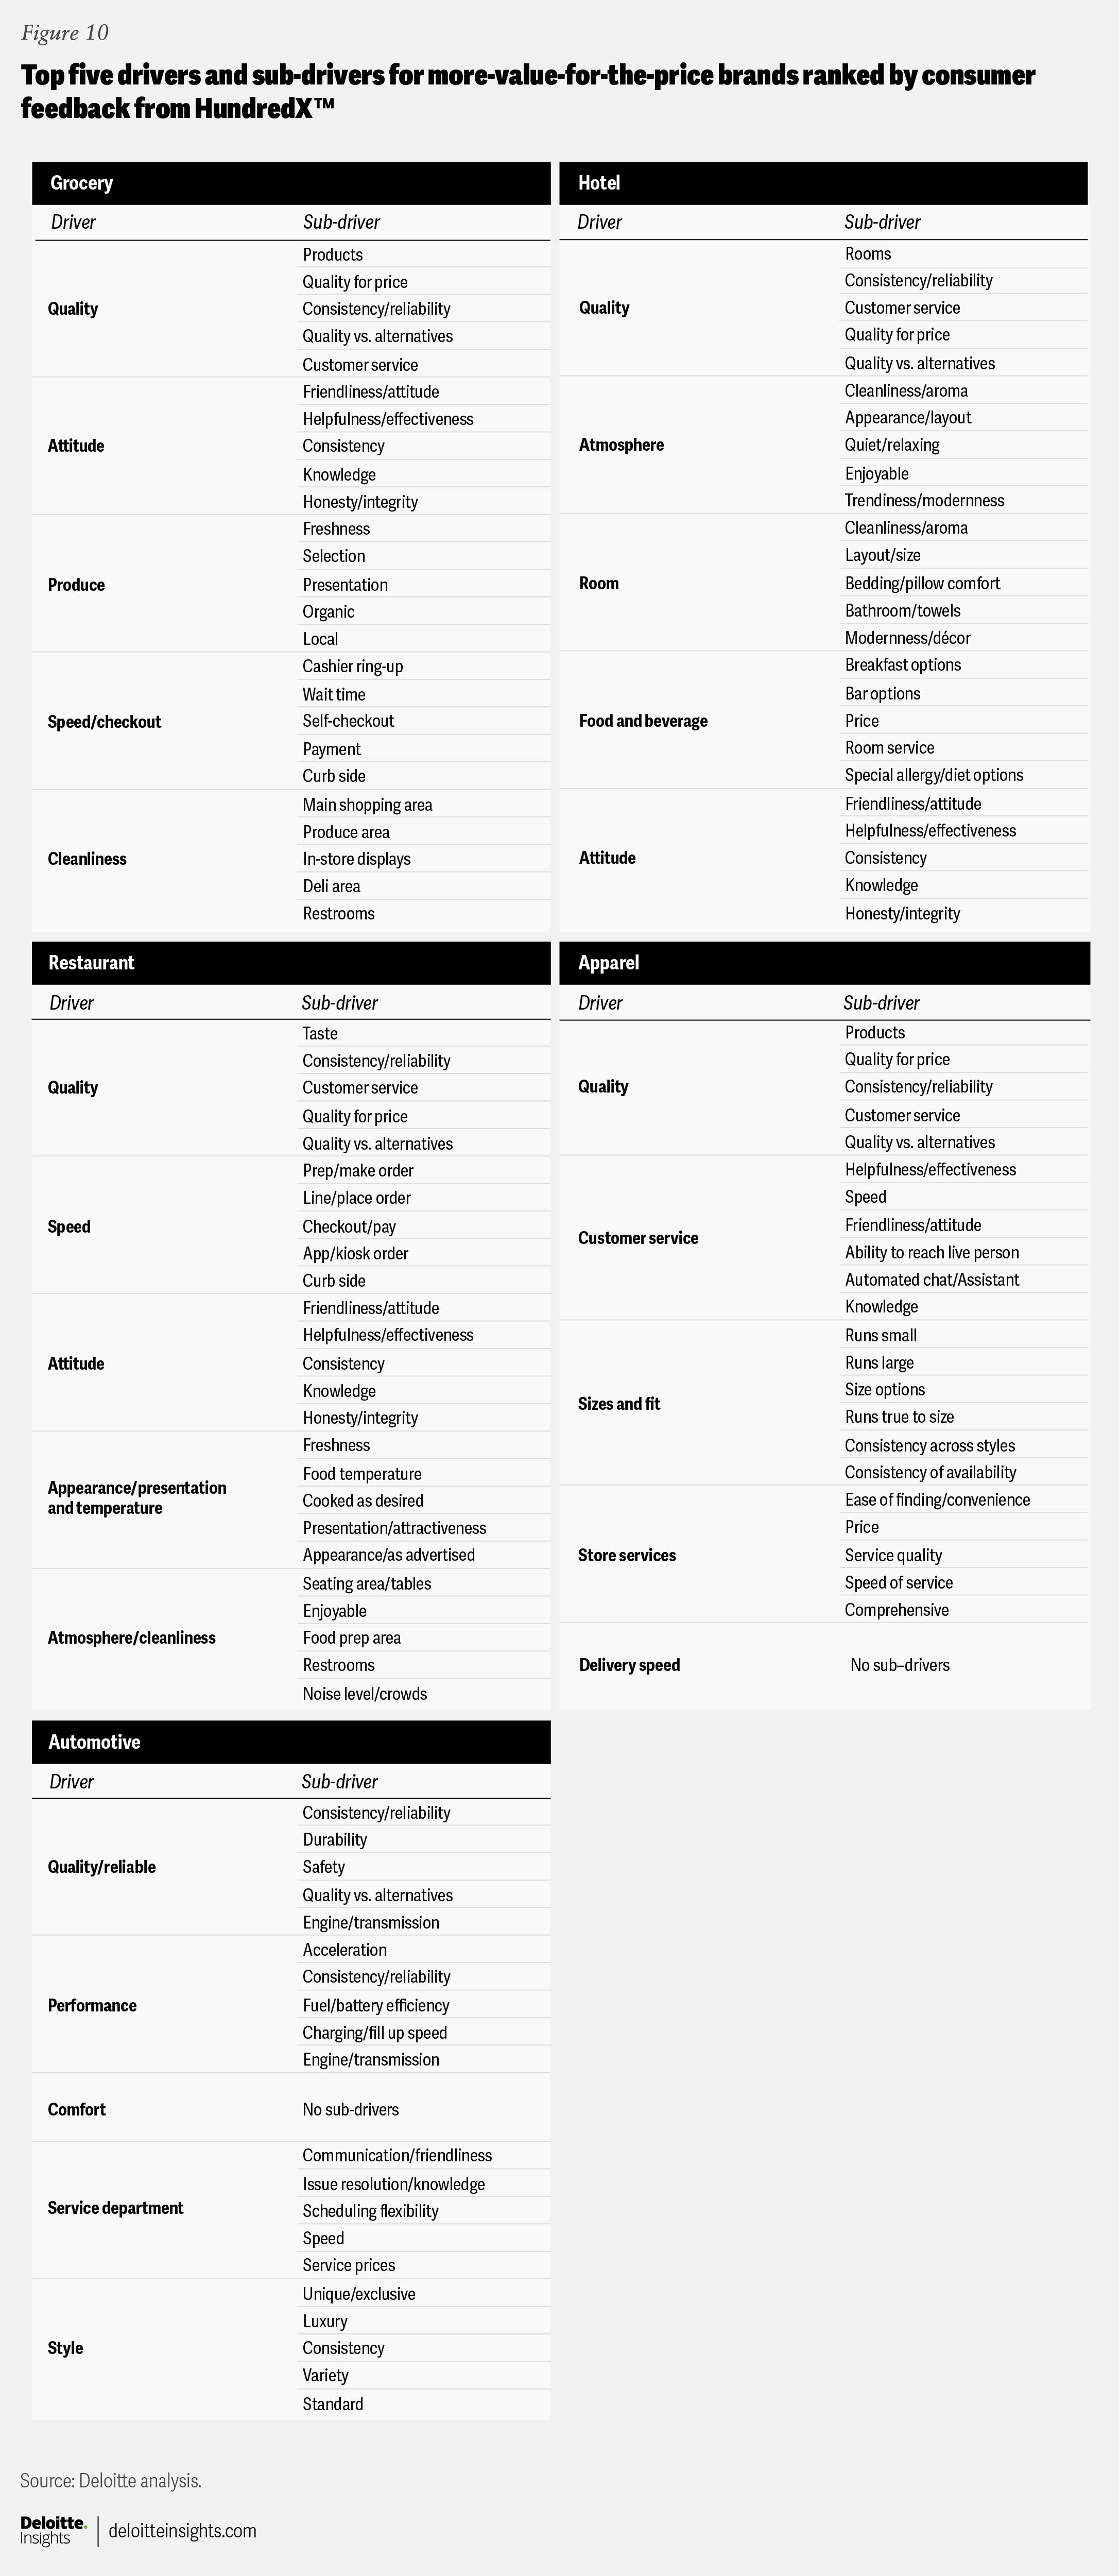
Some drivers of MVP companies’ success vary by subsector. Based on an analysis of HundredX™ consumer assessments, more-value-for-the-price grocery companies outperform on produce selection, cleanliness of the aisles, and speed at the checkout, among other qualities. At the same time, drivers of value in apparel retail include superior store service and good fit and sizing. These consumers rate MVP hotels especially high on drivers like atmosphere, rooms, and their food and beverage offerings. For restaurants, consumers say MVP brands have better meal presentation, serve food at the proper temperatures, and provide appealing and clean atmospheres. And consumers find value in automotive brands for their vehicles’ performance, comfort, and style, in addition to their service departments.
However, other drivers are more universal among MVPs. “Quality” and “attitude” are consistently among the top five drivers of value across the subsectors (see the appendix for additional subsector-specific drivers and sub-drivers). Additionally, MVP brands score higher on trust.12
These concepts may be universal and familiar, but they show up differently across consumer sectors and pricing strategies:
- Superior quality: MVPs consistently outperform LVPs in consumer satisfaction with product and service quality, consistency, reliability, and customer service. For example, restaurant and grocery store MVPs appear to have an advantage regarding product taste and consistency. Hotel MVPs similarly excel in room quality and service consistency. With automotive MVPs, quality is connected to reliability.13
“Produce is the best part of the store. Freshness, and quality.”
- Winning attitude: MVPs are consistently seen as more friendly, helpful, and effective, reflecting superior employee interactions and service standards. For example, MVP restaurants’ welcoming and attentive staff successfully engage consumers, and MVP grocery stores are characterized by helpful and knowledgeable service. MVP hotels’ staff attitudes translated into positive employee friendliness and effectiveness perceptions. Consumers seem to be looking for positive attitudes in apparel and automotive alike through their customer service, be it handling clothing returns or oil change appointments.14
“Probably my favorite mid range chain hotel. Consistent room comfort and amenities, breakfast is always great, good rewards program, price is reasonable.”
- Higher trust: One way MVPs can excel is by consistently building consumers’ trust through capability, reliability, transparency, and humanity—for example, empathy toward consumers and employees—echoed in their approach to quality and attitude.15 Higher-priced MVPs have especially earned more trust on these elements than even their lower-priced MVP counterparts. For example, they are rated at least 20% more capable of providing quality products, services, and experiences.16 While some LVPs do moderately well on these dimensions, they may be hampered by consumers’ value perceptions and tend to compete more on price and product and service availability. Trust is important because it influences consumer behaviors, including purchase likelihood, brand advocacy, and willingness to spend more.17
“Service department is excellent and trustworthy.”
Enablers of success behind the scenes
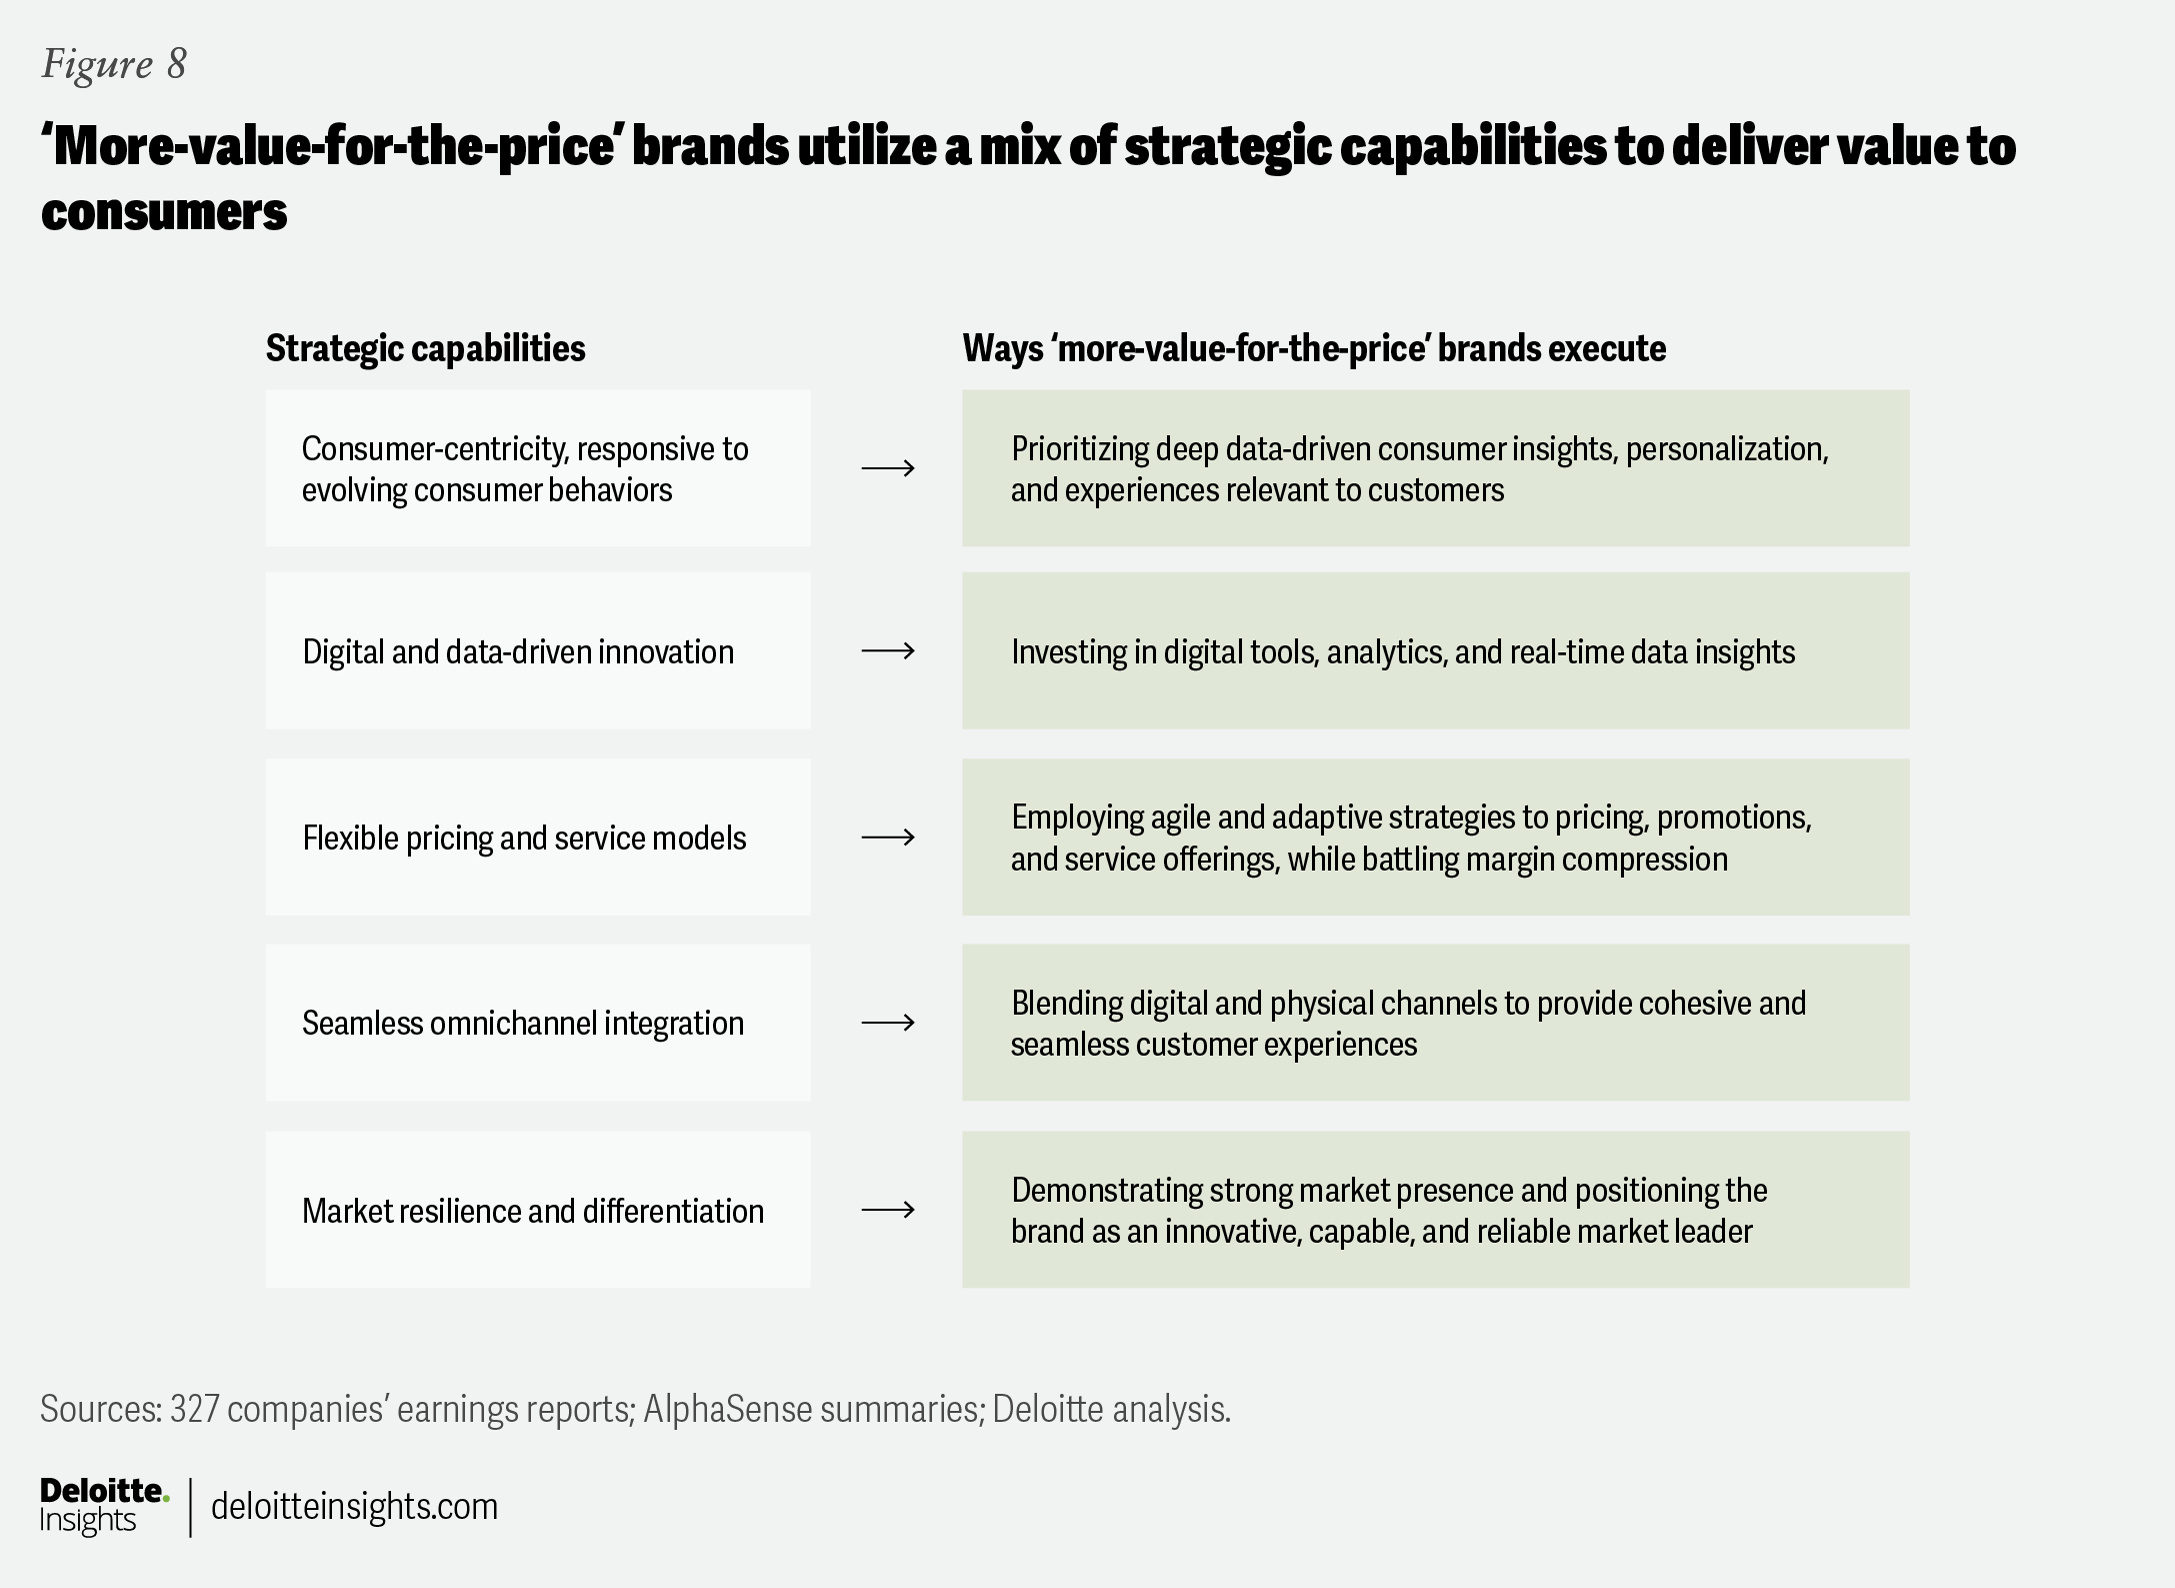
These qualities are what MVP brands deliver—but how can brands deliver them? After all, it takes work and investment to build capabilities for superior quality, winning attitudes, higher trust, and all the sector-unique drivers that appeal most to consumers. These capabilities (and the underlying enabling technologies) may not be as apparent to consumers, even when they touch them. However, companies often discuss these capabilities when talking with investors.
Our analysis of more than 300 earnings calls and annual reports of public companies with MVP brands reveals a shared set of strategic capabilities (figure 8).
Ways brands can win on price and value in an era of compressed margins
Renewed uncertainty and inflation concerns appear to have exacerbated value skepticism and boosted value-seeking behaviors. Brands may be challenged to appeal to consumers who are both increasingly jaded and savvy, even as macro trends squeeze their margins.
To help attract value-seeking consumers while protecting profit margins, brands can consider the following:
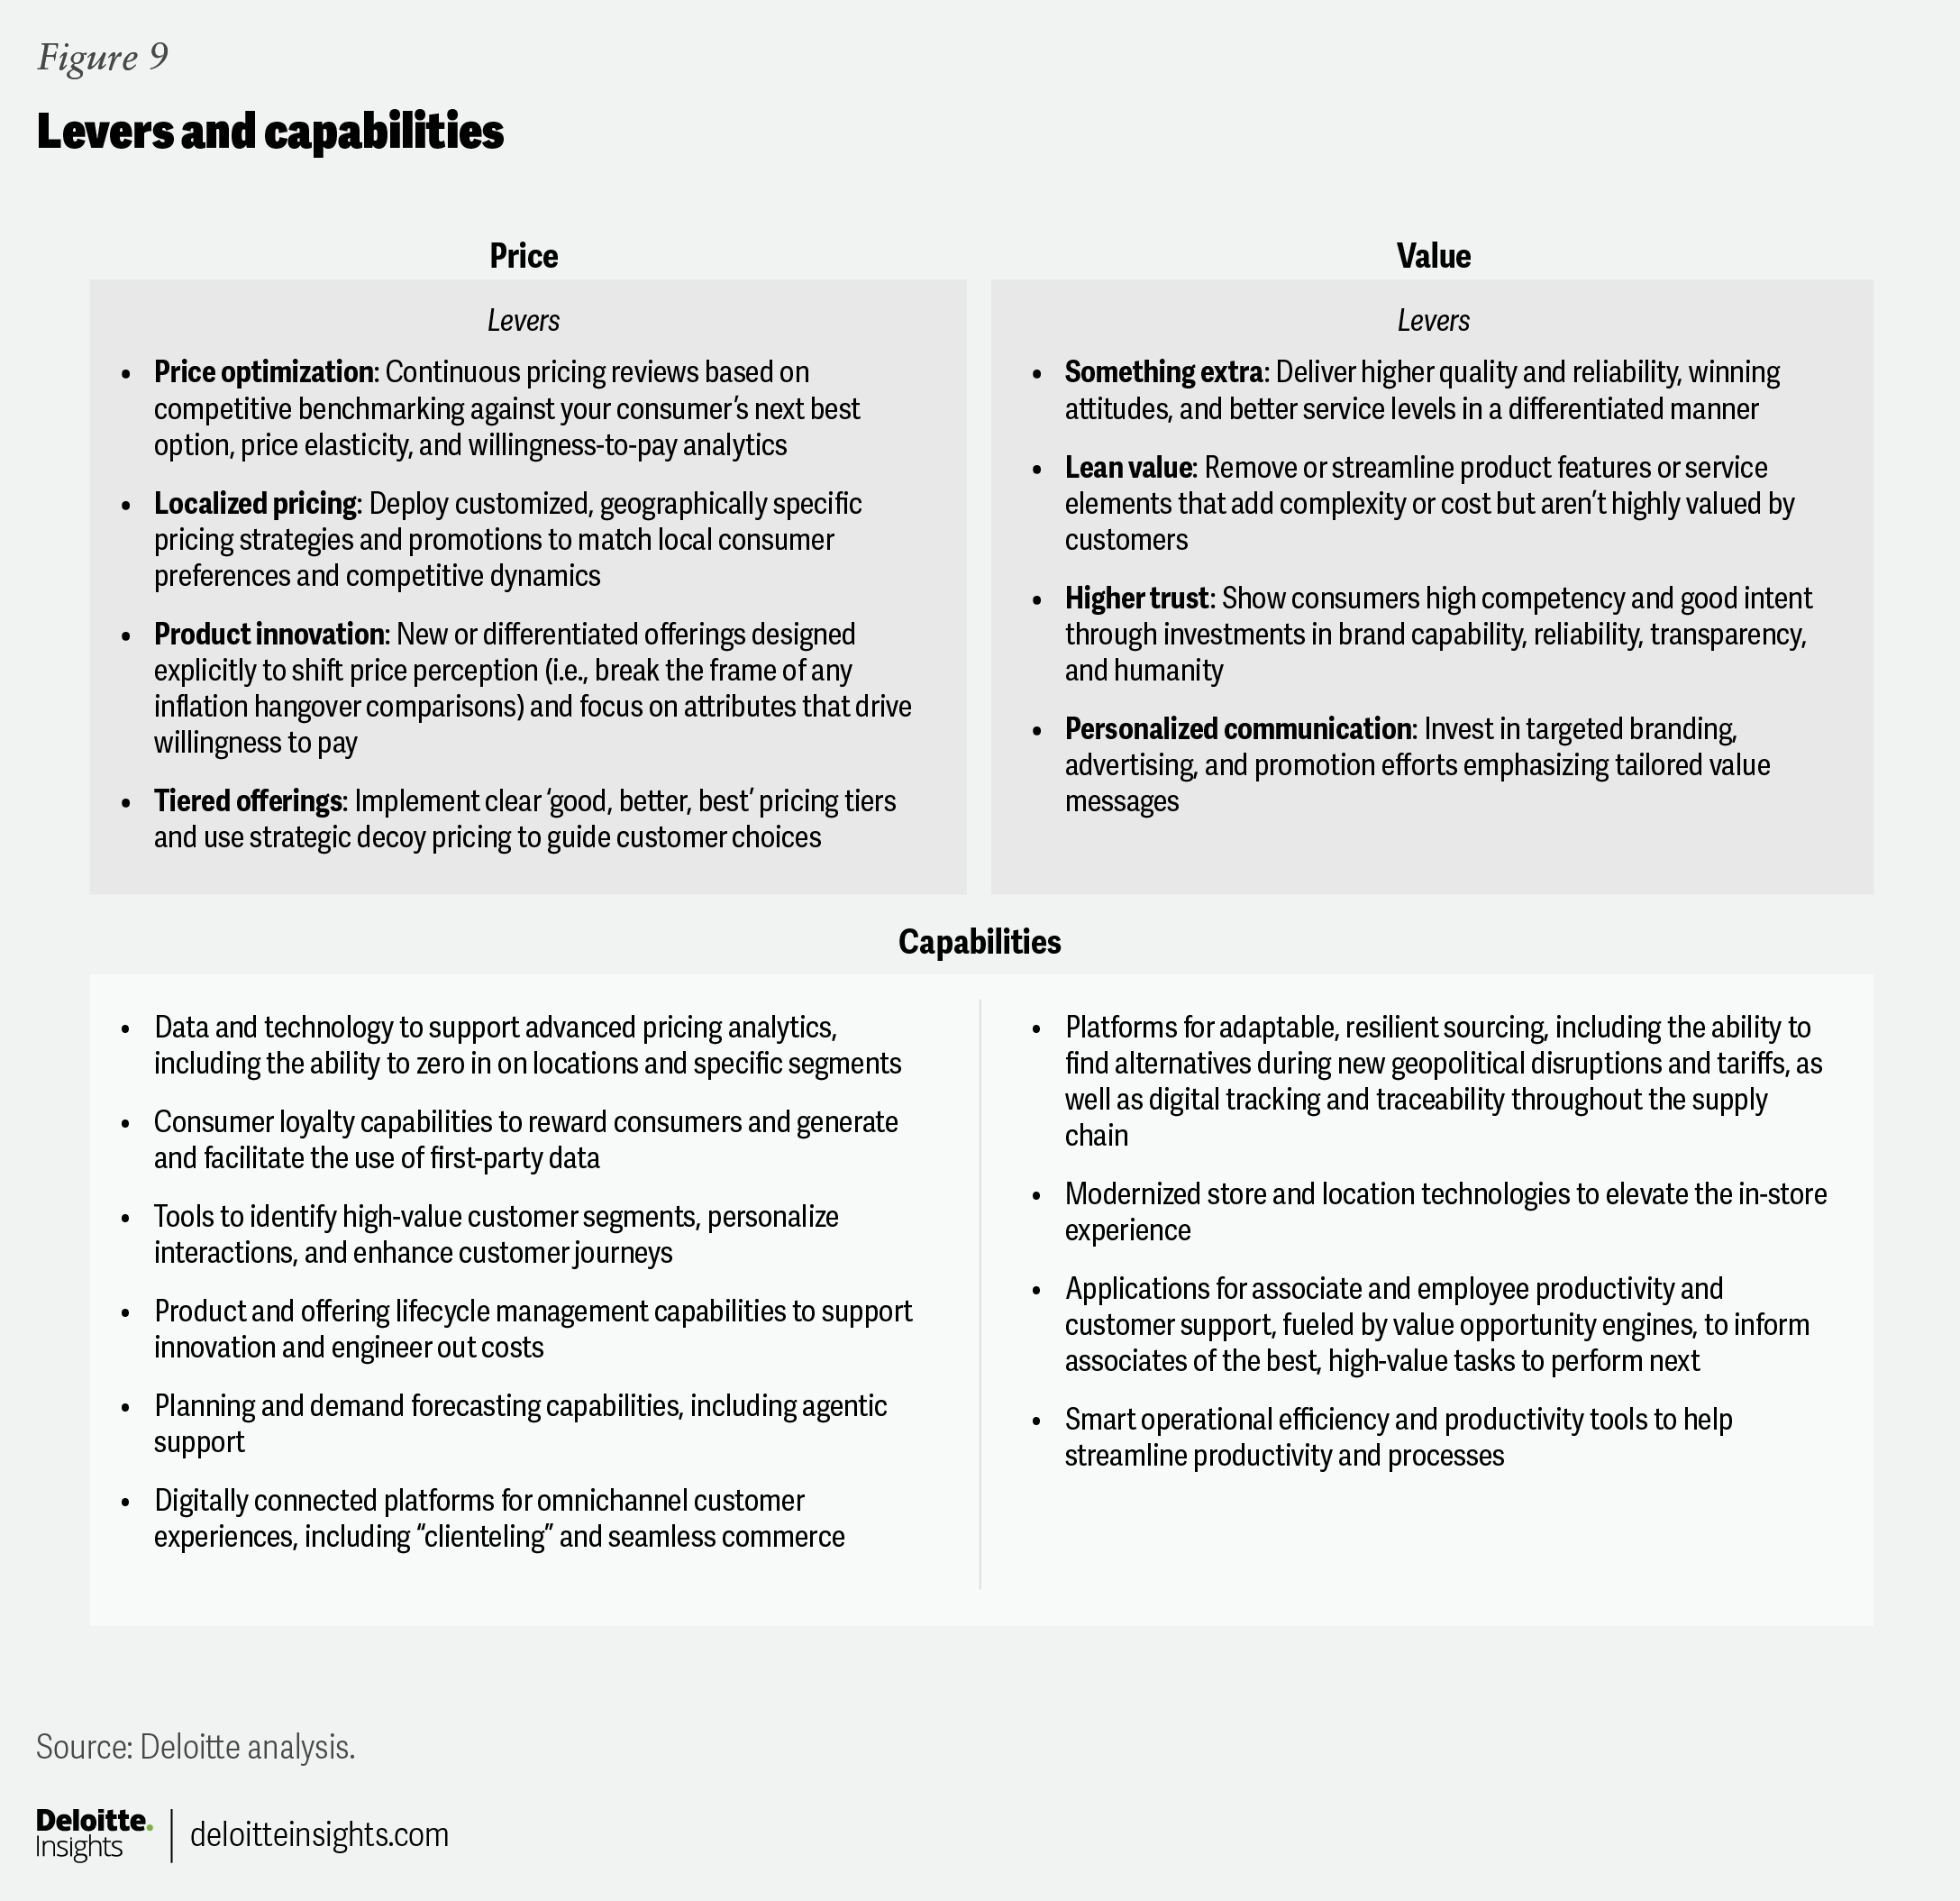
- They should look at pricing, across all facets (figure 9). Successful pricing can be easier if brands keep costs in check, develop an advanced, granular understanding of changing demand elasticity and each brand’s unique pricing power within their categories, and implement systems that enable them to adapt quickly —sometimes at a localized level.
- Brands should also consider leaning into tactics and strategies to boost consumers’ perceptions of their value relative to their price. Investing in technology-enabled capabilities can empower brands to improve quality, attitude, trust, and other shared success drivers, as well as characteristics unique to the best performers in their sector that consumers seem to value most.
Appendix 1: The MVP Playbook
Consider the following steps:
- Use consumer transactional and feedback data to evaluate your brand’s price and value perception against other companies in your industry. Are you “above the regression line” in offering more value for the price than your peers?
- Assess consumer perception of your brand on the industry’s universal drivers of quality, attitude, and trust, and the drivers specific to your sector. Look to sub-drivers to help assess the “why” of any drivers that look to be lagging (appendix 2).
- Consider ways to add value that fit with your brand identity and business model. Identify improvements that could make a significant difference for your brand and determine the investments needed to develop your desired capabilities; in many cases, these could include digital technologies that help drive step-function improvements, including agentic AI for applications like demand forecasting, pricing, and supply chain management (see levers and capabilities below).
- Implement, actively monitor, and keep turning knobs until the results show up in your perception data, improve net purchase intent, and eventually drive additional sales.
Appendix 2
by
Michael Daher
Renee Bomchill
Ankit Patel
Stephen Rogers
Justin Cook
All consumer quotes were sourced from HundredX open text survey comments from consumers reviewing brands covered in Deloitte’s analysis.
The authors wish to thank Ed Johnson, Evert Gruyaert, Jeff Simpson, Danny Edsall, Lisa Walker, Natalie Martini, Kate Ferrara, Michael Jeschke, Natalie Groff, Mara Wrzesniewski, Anant Kumar Singh, Nimisha Mohanan, Ashley Reichheld, Abby Miller, Emily Werner, Akash Kumar, and Ram Sangadi.
Cover image by: Harry Wedel
Visit the Deloitte Consumer Industry Center
Access more insights for the automotive, consumer products, food, retail, wholesale and distribution, airlines and hospitality, and transportation sectors.