
Even little snacks can deliver big value
Despite industry headwinds, some savory and sweet snack brands are winning over value-seeking consumers
Snacking is one of America’s most dependable habits, whether it’s savory snacks like chips, nuts, and jerky, or sweet snacks like cookies, cupcakes, and chocolate.
While snacks are a steady growth engine for food companies, the category has recently lost some momentum.1 Analysts point to food prices, a move toward healthier eating, and the rise of GLP-1 medications.2 But a fundamental issue is also at play: Many consumers no longer feel they’re getting good value at fair prices.3
That view took hold as inflation peaked in 2022, eroding shoppers’ perceptions of both price and value.4 Those perceptions have yet to recover, even as inflation has cooled.5 What’s emerged—and may endure—is a value-seeking mindset.
Deloitte’s ongoing ConsumerSignals survey finds that about 4 in 10 US consumers are now value seekers, making cost-driven, deal-seeking, and convenience-sacrificing choices in their pursuit of value.6 That mindset extends well up the income ladder: Twenty-three percent of households earning more than US$200,000 are value seekers.7 And this behavior may be here to stay. Most consumer products executives we surveyed see it as a structural shift rather than a transitory trend.8
Even so, not every snack brand is struggling. To help determine why, for snacks and all consumer categories, we created a framework (see methodology) that untangles consumer value from price perceptions and assesses each brand in the full context of its competitive market.9 The framework generates a new value score measured relative to market expectations and provides a way to compare brands, at any price point, across the price-value continuum.
In our framework, about 1 in 3 savory brands and 1 in 4 sweet brands earn “more-value-for-the-price” or “MVP” status.10 Across the snack landscape, brands that do well on this value metric appear to be pulling ahead in sales growth and loyalty, with consumers saying they plan to buy from MVP brands more often.11
Whether or not your brand is currently an MVP, our playbook lays out specific “value-aware pricing” and “cost-aware value” moves to consider, informed by the purchase drivers most tied to MVP snack brands.
The MVP framework: Finding more value for the price
It’s difficult to determine whether a purchase is of good value without also considering its price. In surveys, consumers have trouble separating the two factors in their answers. To them, value and price are intrinsically linked.12 For example, if someone says, “These cookies were a really good value,” they are probably talking about both what they got and what they paid for it.
To measure the strength of this relationship, Deloitte analyzed HundredX survey data covering 105 snack brands and plotted them on their price and value ratings (figure 1). Each dot represents a unique, well-known brand. Regression of the data in the savory and sweet charts indicates the expected relationship: Price favorability generally explains 40% to 45% of the movement in value favorability scores.13 In other words, raw value scores partly measure price, and vice versa. But that’s only part of the story.
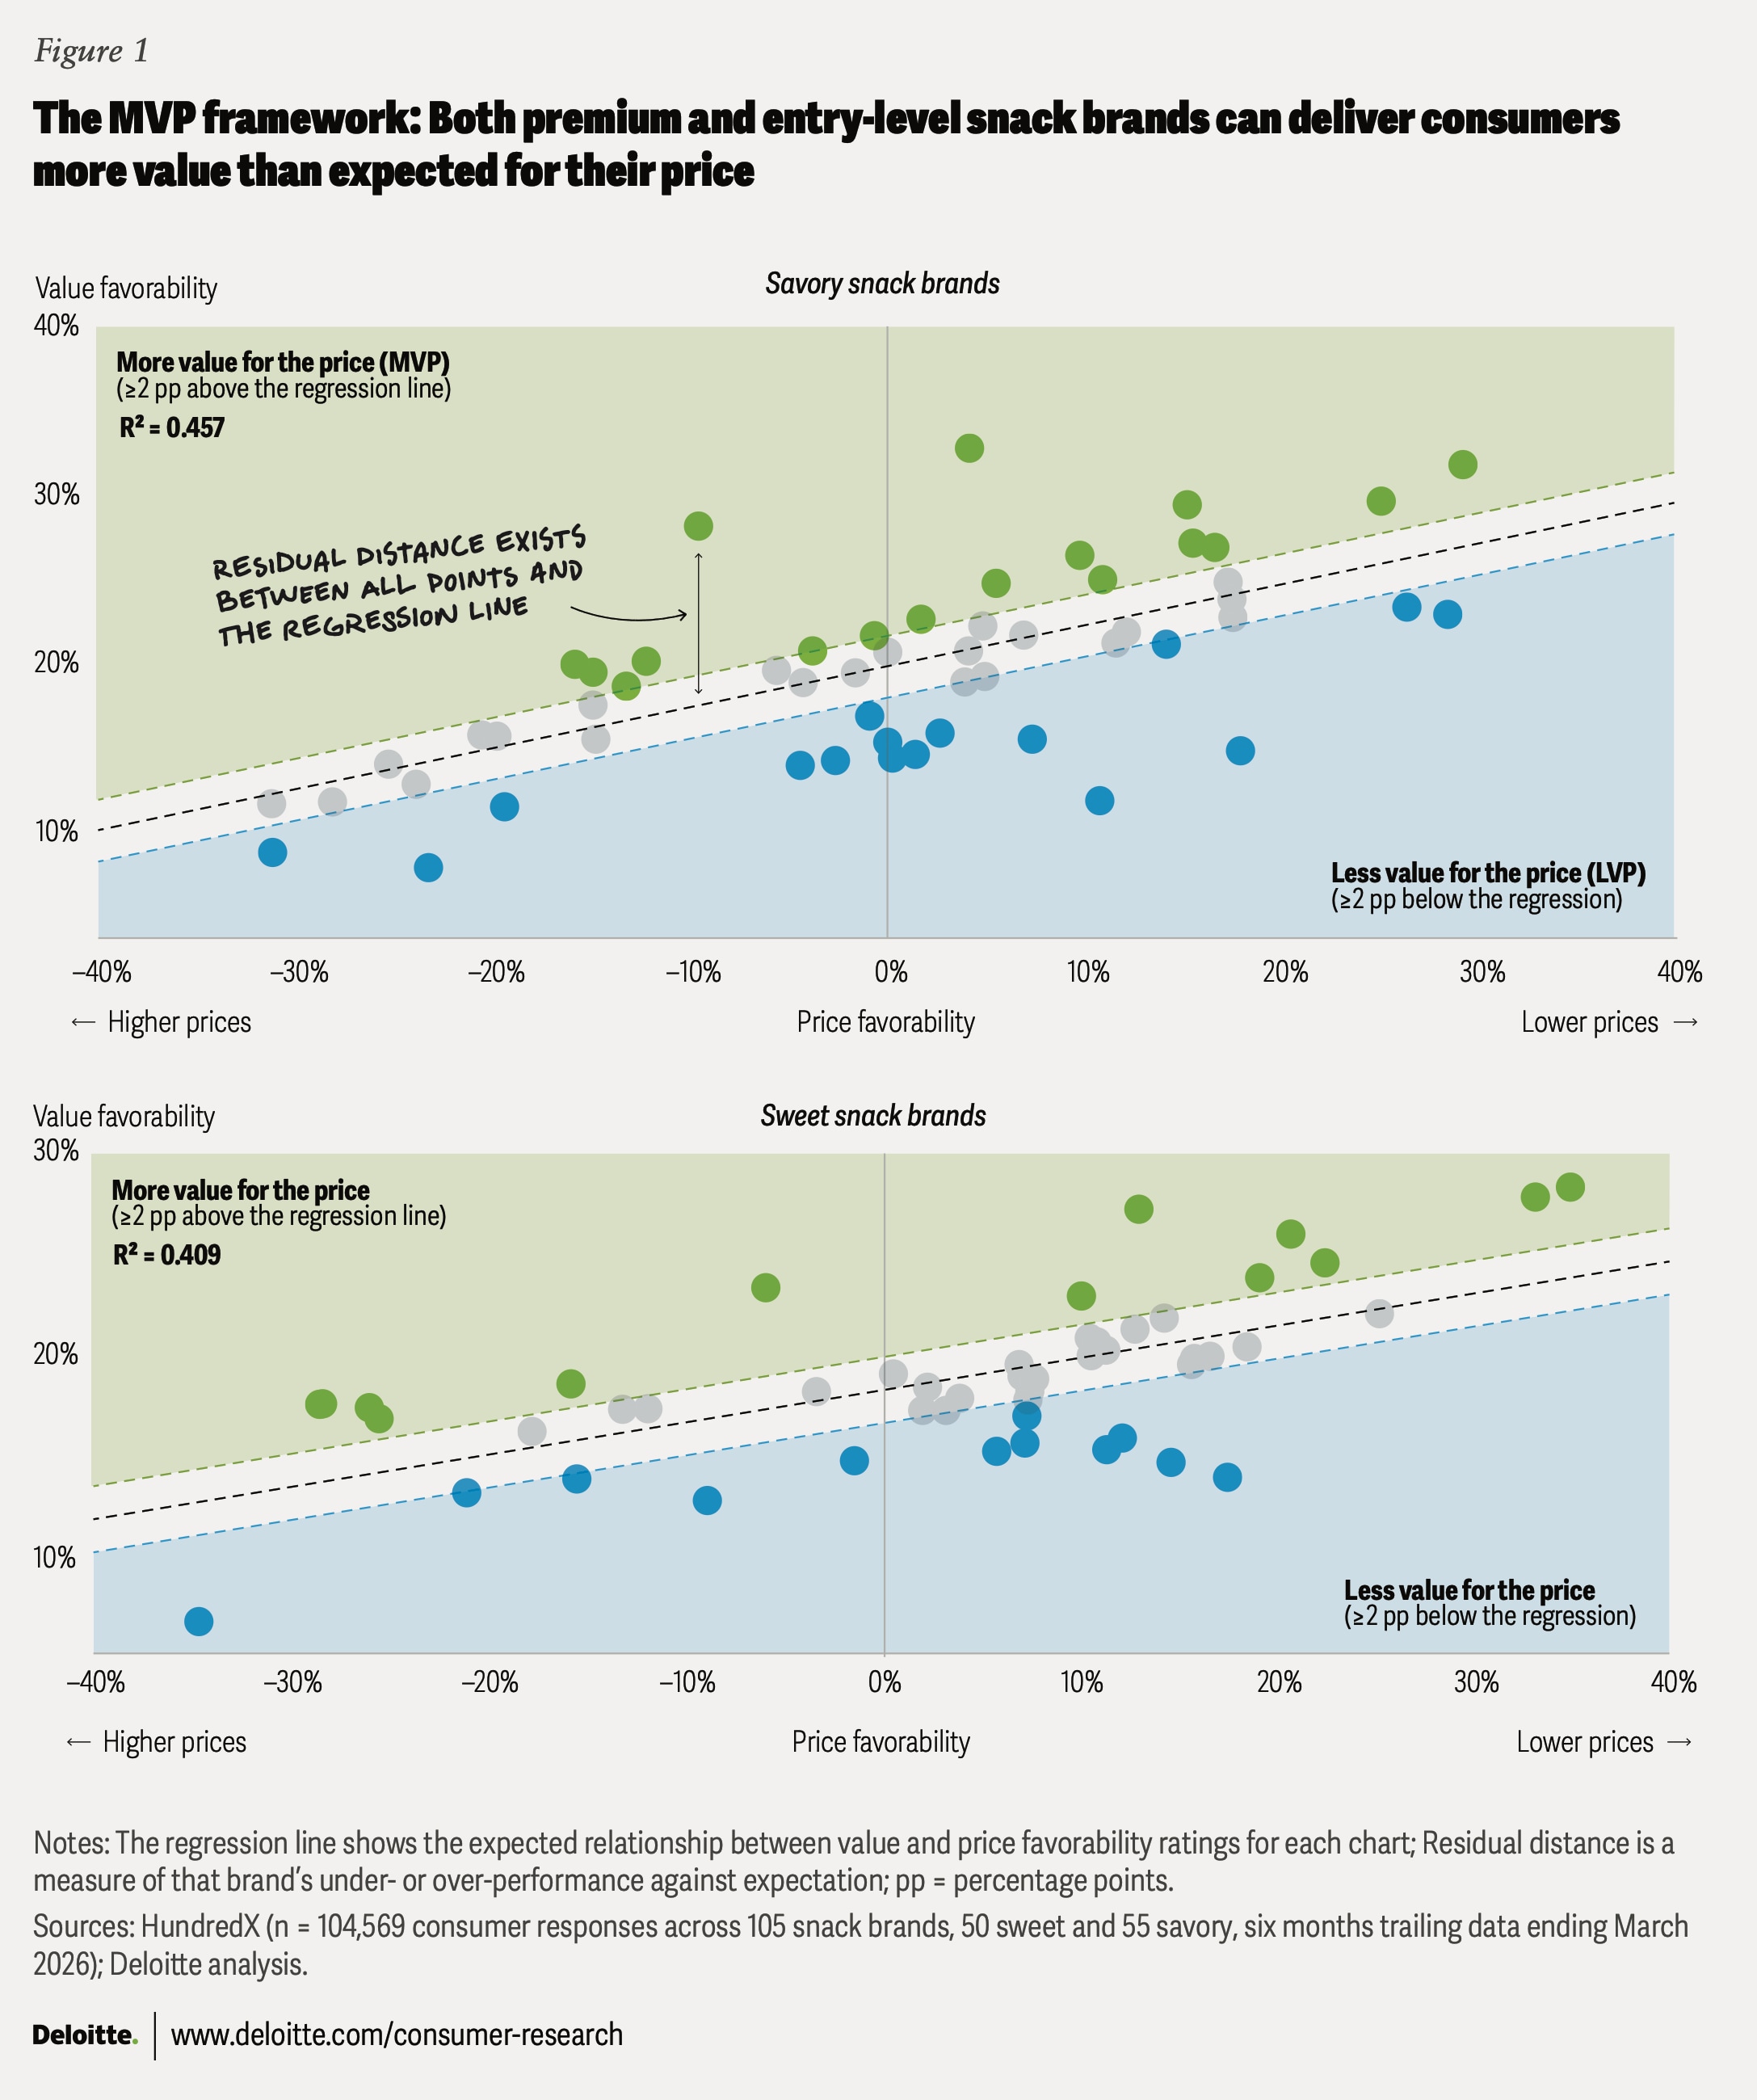
In the MVP framework, the regression line is a landmark for navigating the relative nature of value, defining the expected relationship between value and price perceptions within each competitive space. It creates a dividing line and a new metric of “value apart from price,” calculated as the residual distance between each dot and the regression line.
Brands that score at least 2 percentage points (pp) above the line are considered more-value-for-the-price brands, or MVPs. Similarly, less-value-for-the-price brands, or LVPs, sit 2 or more percentage points below the line, and those within that band, closest to market expectations, are considered anticipated-value-for-the-price brands, or AVPs.
“Absolutely love this [brand] and its consistent value over the decades …“
The MVP framework in action
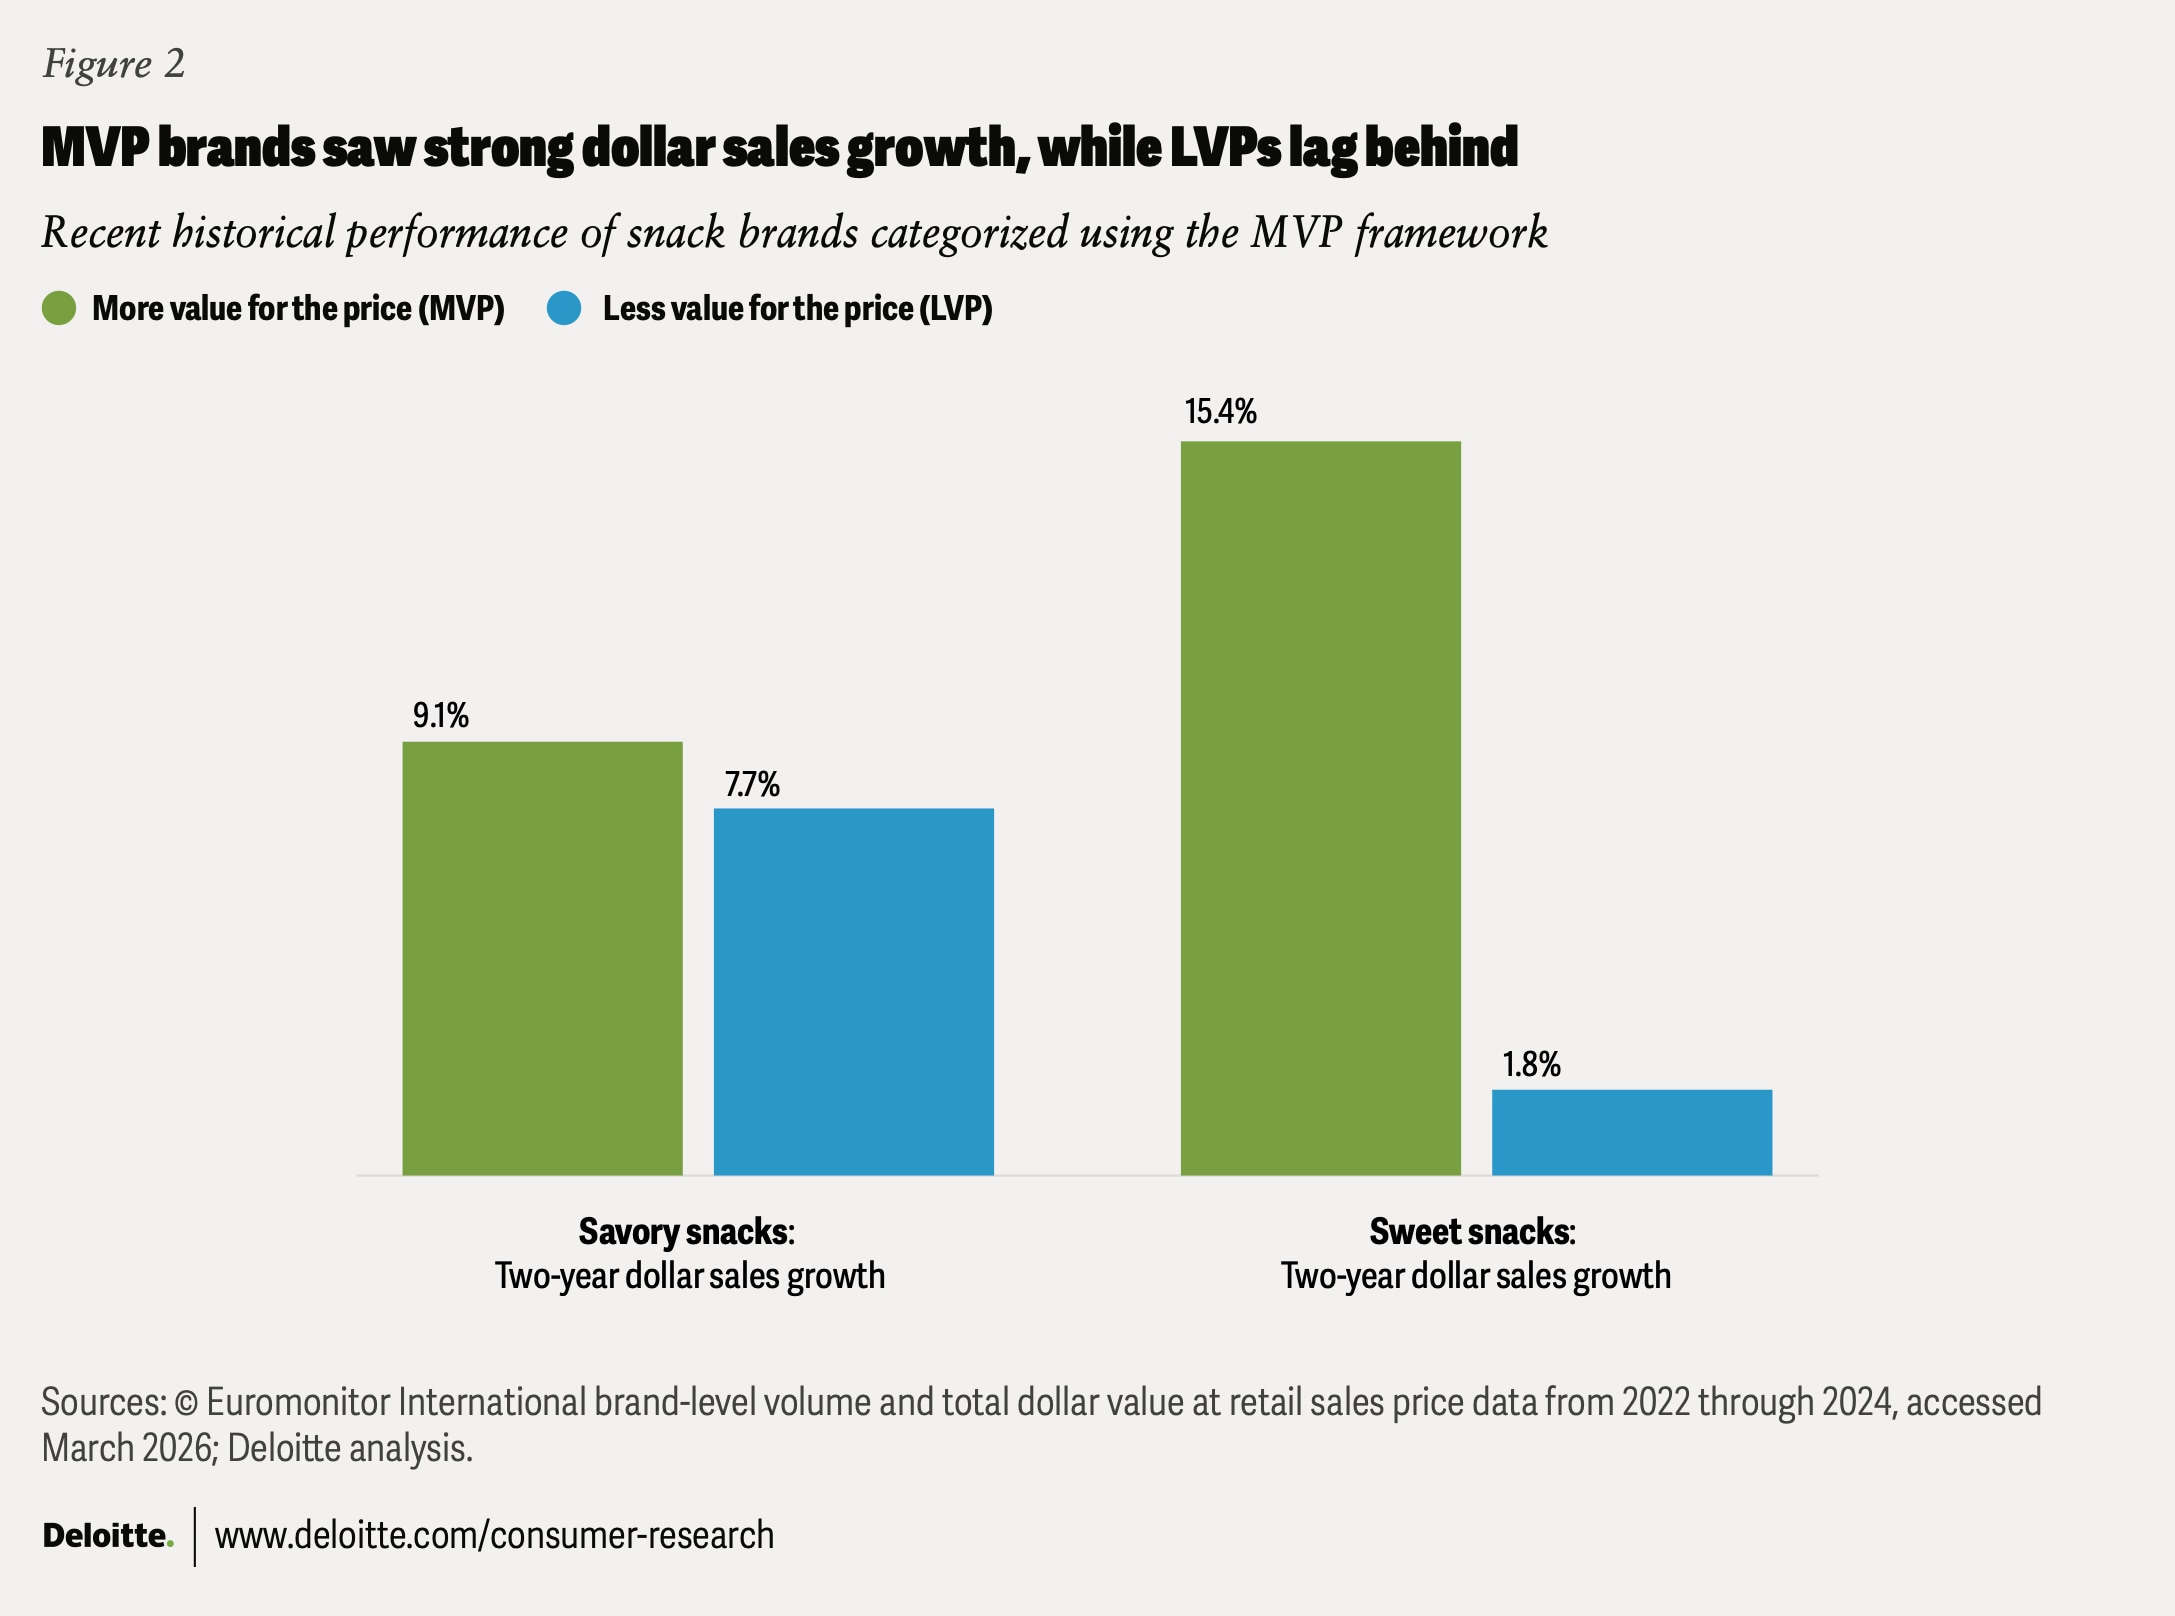
Does providing more value for the price matter? To examine this further, we compared the performance of MVP and LVP brands from 2022 through 2025 using Euromonitor’s “retail dollar value,” which serves as a proxy for each brand’s annual revenue.14
We found that MVP brands as a group grew materially faster than LVPs in retail value for both savory and sweet categories (figure 2).15 Since these MVP brands increase sales relative to the competition, they appear to be gaining share.
The forward-looking assessment points the same way. Asked month after month in the same HundredX survey whether they intend to buy more of a brand in the year ahead, consumers favored MVP brands over LVP brands in both categories.16 In savory, the net purchase intent gap is relatively wide (+4 pp on average). For sweet, it’s a closer comparison (+1 pp), but the MVP brand group in the category also stays consistently above LVPs at each point in time.
What do snack consumers value beyond price?
It’s one thing to know a brand’s MVP residual score and another to know which levers might best improve it. To help make the framework actionable, HundredX asked consumers which non-price drivers most shape their snack choices. After all, as previously noted, value amounts to more than price.
Every driver in the survey can play a role in each consumer’s purchase decision, but six drivers rose to the top: taste, availability, flavors, convenience, quality, and packaging (figure 3).17 Those drivers reflect the basic must-haves for any type of snack. However, consumers start to differentiate savory snacks from sweet on lower-frequency yet still important drivers, especially ingredients, healthy, and natural or organic.
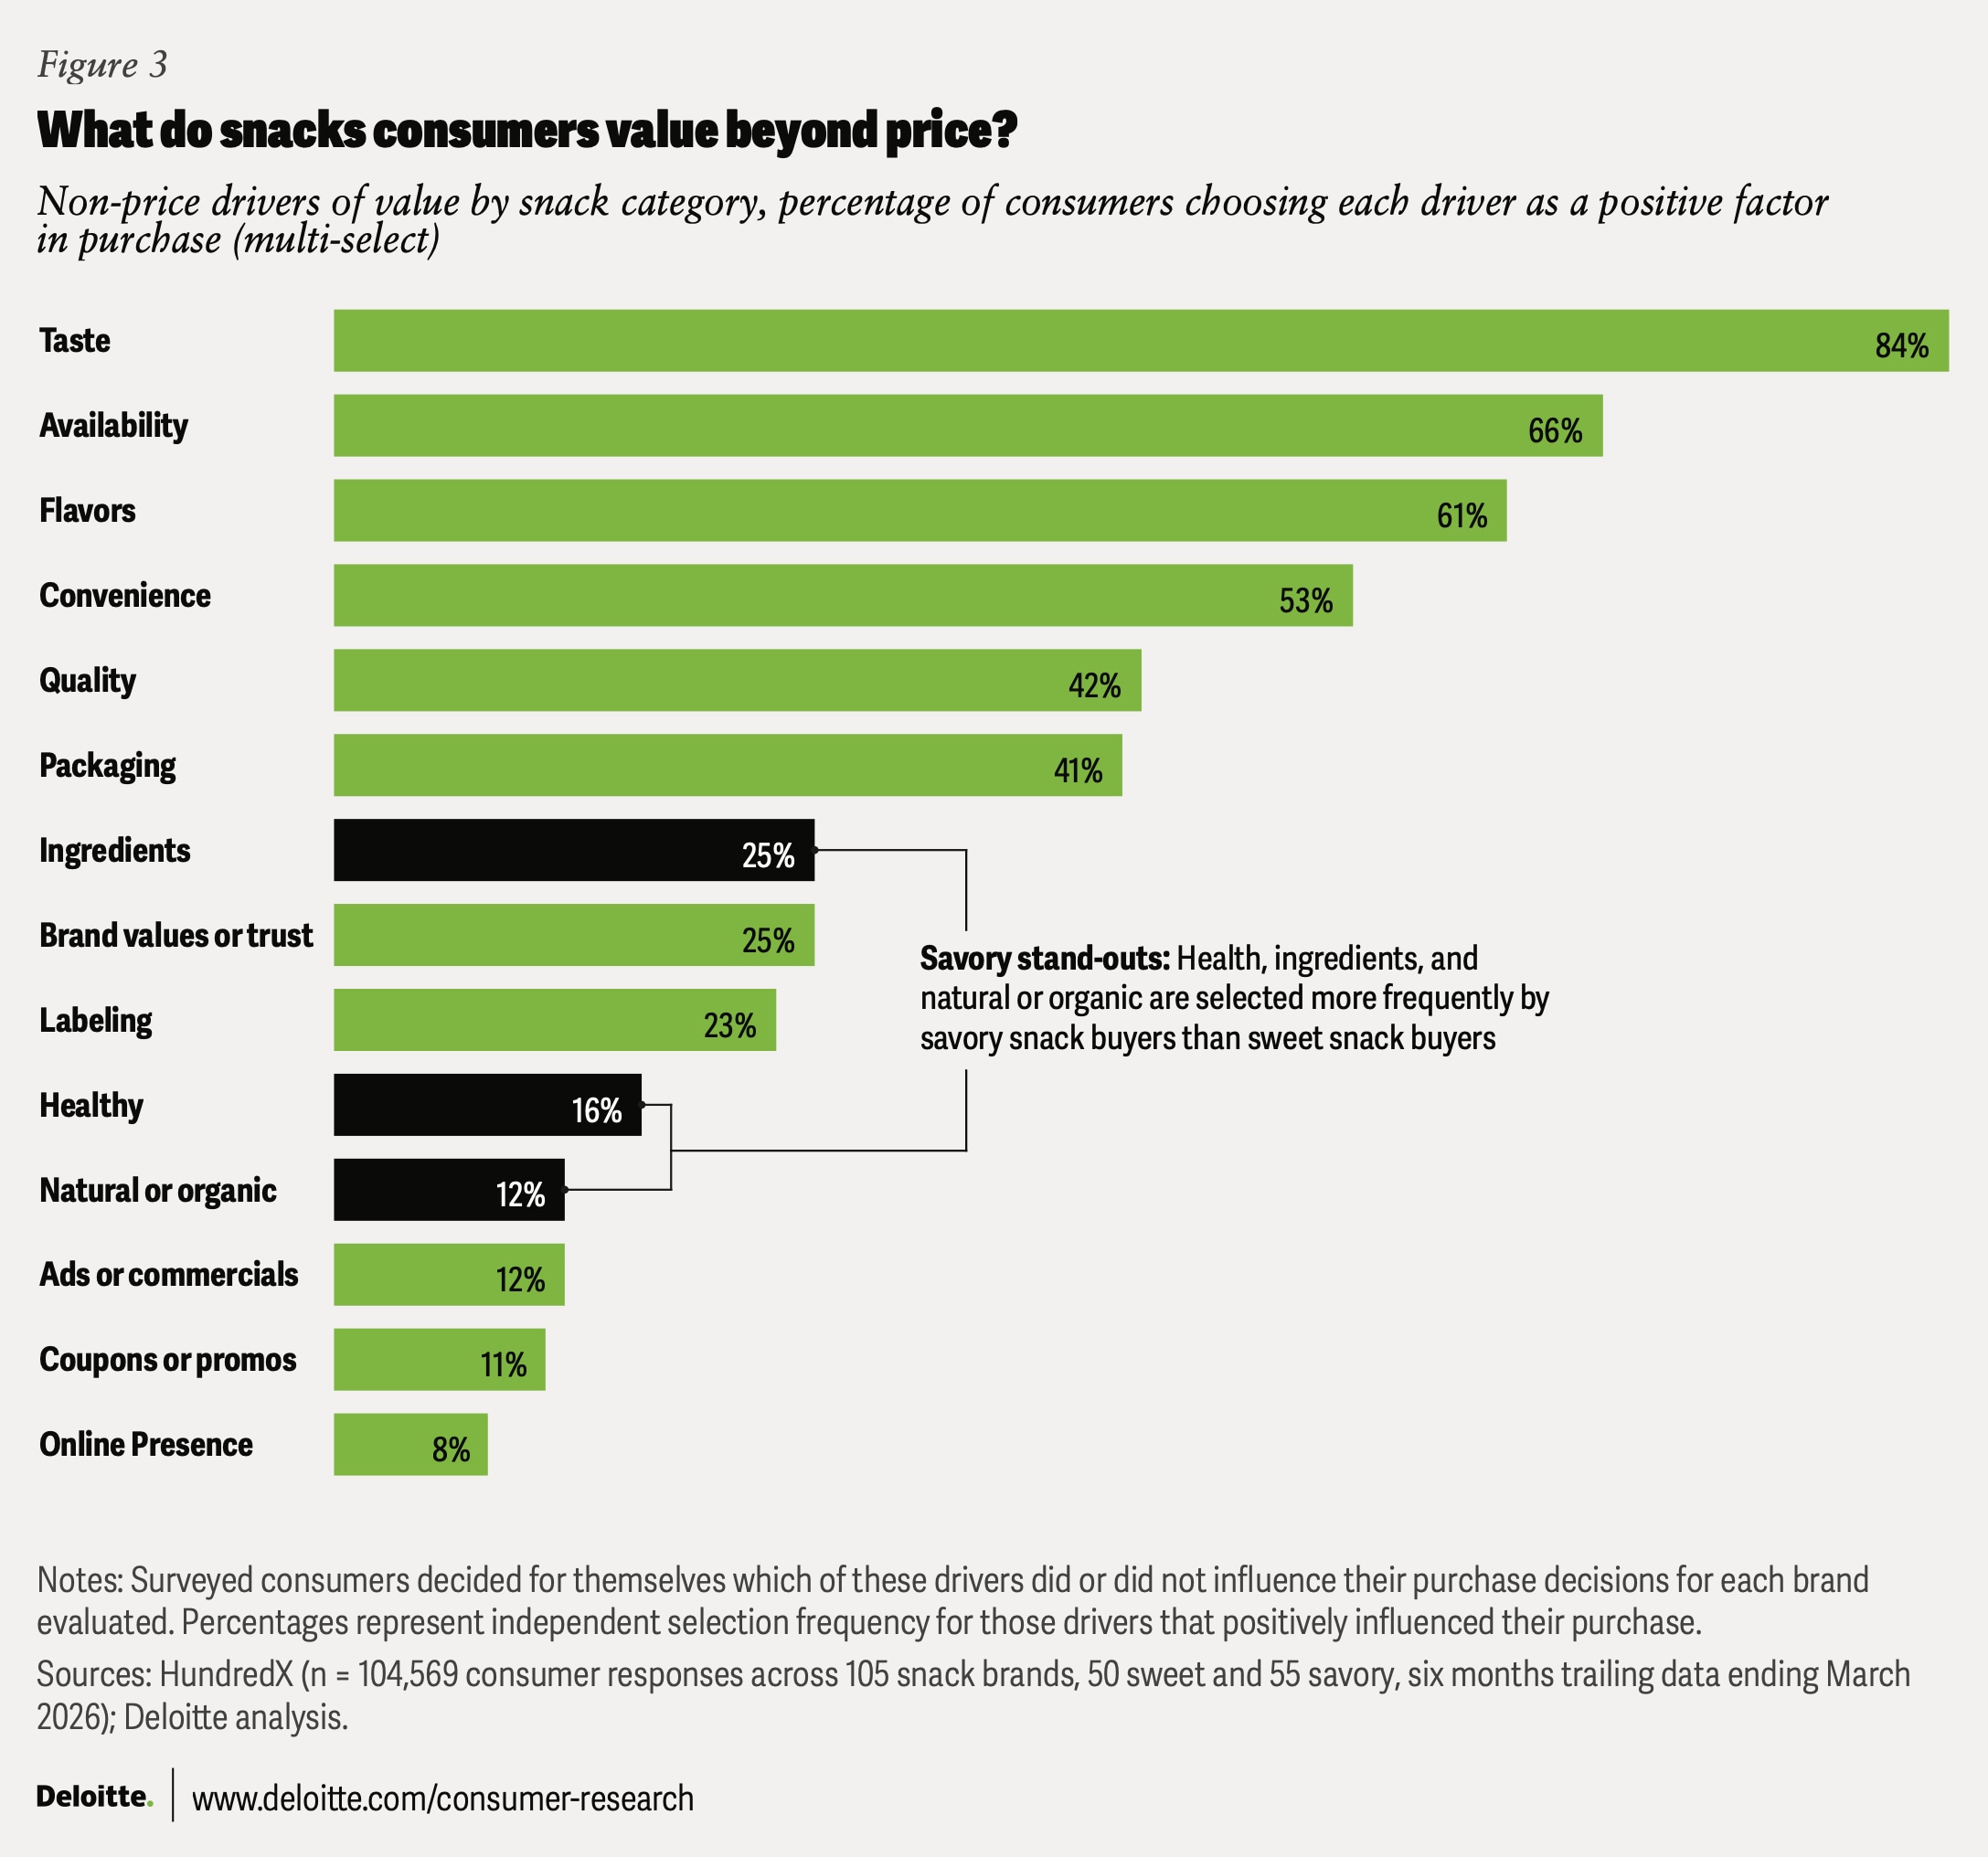
Each of these drivers is also associated with multiple sub-drivers that help explain what specifically about, say, ingredients, labeling, or flavors makes them important for a purchase. Those sub-driver patterns also differ across MVP and LVP brands.
How do MVP snack brands stand apart?
Earlier work analyzing HundredX purchase driver data across consumer sectors, from alcohol to apparel to automotive, found MVP brands consistently score higher on both quality and trust.18 For snack MVPs, the pattern remains the same. Superior quality and greater trust are characteristics that can help elevate the value of both types of MVP snack brands. But when examined separately, savory and sweet snacks have unique qualities that give their respective MVP brands higher value.
“Good quality and taste with very few ingredients.”
Savory snack MVPs
For savory MVP brands, the consumer preference trend toward healthy options backed by quality ingredients has taken hold. MVPs outperform LVPs in selection frequency for the purchase drivers healthy (+18 pp), quality (+14 pp), ingredients (+14 pp), and natural or organic (+14 pp).19 Looking at the sub-driver, or the “why,” behind their superior performance, MVPs excel on descriptors such as taste freshness and taste consistency, quality of ingredients, and the favorable taste of their natural ingredients.
Savory snack LVPs have their bright spots but appear to be chasing a different consumer. The only driver where LVP brands outperform MVPs is flavors (+10 pp).20 Digging deeper, those who positively rate these LVP brands more often say they value the fact that their favorite flavor varieties, especially bold flavors, are available where they shop. We’ve seen this variety-and-novelty strategy with LVPs in other consumer product categories.21 This approach may work well for niche products but may also attract consumers who aren’t as loyal or conducive to growth.
“Love the guilt-free snacking! Love the quality and choices!”
Sweet snack MVPs
As strong as the health trend is for savory snacks, it doesn’t seem to carry over to sweet snacks. In fact, sweet snack MVPs almost flip the script. MVP brand quality (+6 pp) and trust (+5 pp) selection frequency still edge out LVPs. But the HundredX data suggests sweet snacking suits a different occasion where health and natural ingredients take a back seat to other priorities. Here, consumers select sweet MVP brands more often for flavors (+9 pp) and packaging (+8 pp) over LVPs. The sub-driver level reveals these MVPs are valued more for flavor availability in stores, breadth of selection, multipacks, ease of carrying and eating, and package design and colors.
Sweet snack LVPs show fewer areas of distinction and lower performance on some key purchase drivers. There’s some evidence of a health niche, but with a different bent, like low sodium and special dietary options, where LVPs outperform MVPs in the HundredX purchase driver data.22
“Consistent flavor over decades. Readily available and a household name. Affordable yet luxurious.”
Strategies to consider: How to be a snack MVP
As the MVP framework shows, it doesn’t take a discounted price for snack brands to attract value seekers. Instead, capturing their spending should include a strategic understanding of what makes consumers feel they’re getting more value out of every bite-sized purchase.
At this point, snack company executives may be asking, “Are my brands MVPs?” To understand where their brands fall on the MVP framework, companies can survey consumers themselves or leverage third-party data to create a custom price-value plot and regression line. They can then use those results to identify specific actions that can give them an MVP advantage over competitors. We see these actions falling into two categories: value-aware pricing and cost-aware value.
Value-aware pricing
Price optimization usually considers volume and margin implications. But add perceived value to the equation. As MVP brands demonstrate, leaving value on the table for consumers can help create a virtuous cycle of growth and loyalty.
- Focus revenue growth management tools on longer-term results. Short-term benefits caused by overoptimizing return on investment for today can come at the expense of consumer value down the line.
- Strategically measure promotions’ impact on value perception. Add this to the other strategic goals you’re targeting, such as sales volume and new customer trials. Determine how today’s promotions may enhance or erode tomorrow’s perceptions and refine future actions accordingly.
- Tailor sizes and formats to value seekers. Price-pack architecture can help adapt products to price points that better serve priority occasions and channels. They can also give health- and portion-minded shoppers a format that fits. Across a brand portfolio, this may mean new entry price points for more accessible brands or new premium features that enhance higher-end brands.
- Compete with private labels on quality, not price. Private-label brands are gaining share not just by being cheaper but increasingly by matching national brands’ value propositions.23 Drive new value around specific needs and occasions, and price accordingly. Merely discounting today’s offerings may not keep private labels at bay.
- Protect margins without sacrificing value. When possible, pull execution levers other than price to bolster margins. Focus on increased efficiency to provide greater future price optionality and resilience.
Cost-aware value
Here’s another way in which value doesn’t equal cheap: It can take substantial resources to provide consumers with value. Justify product and service enhancements based on the resulting increase in brand value perception relative to your competitors. Consider reallocating investments that don’t improve perception to those that do. Refer to the MVP brand value drivers for savory and sweet snacks as a guide for where to consider investing.
- Work your brand’s unique quality drivers into its story. Quality can be found in ingredients, packaging, history, seasonal exclusivity, association, process, personality, and more. It takes introspection (and lots of data) to find your differentiators, and ultimately, the consumer decides. No matter where you land, investing in telling your story can help to drive perceived value.
- Cultivate brand trust by demonstrating good intent and competency. Snack ingredients should be authentically positioned and live up to their marketing claims, and offerings should be reliably stocked on shelves.
- Delve deeper into MVP-associated drivers. For savory snacks, consider leaning into health-focused and natural yet tasty ingredients while avoiding chasing variety and novelty for their own sake. For sweet brands, it may be helpful not to lose sight of your role with consumers and get tangled up in health trends. Engage them with flavor, creative packaging, and multipacks to fit their indulgence needs.
- Use consumer-driven innovation to stay fresh. New trends, consumer need states, and occasions are constantly emerging and shifting value perception. In addition to monitoring core MVP drivers, consider building a data and analytical pipeline that lets consumers reveal their new preferences in greater detail.
- Enlist the MVP framework to help expand portfolio value. Consider managing value at the portfolio level through acquisitions, divestitures, and stock-keeping unit reductions. The MVP framework can help identify favorable acquisition targets or existing brands to sell or discontinue if improvements are too costly.
Continue the conversation
Meet the industry leaders
Ed Johnson
Justin Cook
by
Ed Johnson
Drew Gaputis
Justin Cook
Vivek Dogra
The authors would like to thank Steve Rogers, Nimisha Mohanan, Akash Kumar, Marcello Gasdia, Andre Benjamin, Alexander Cromwell, Blake Guidry, Jon Kaplan, and James Jennings.
We would further like to thank Rithu Thomas, Preetha Devan, Sylvia Yoon Chang, and Jaime Austin for their contributions to the production of this report.
Editorial (including production and copyediting): Rithu Thomas, Preetha Devan, Anu Augustine, and Pubali Dey
Design: Harry Wedel
Cover image by: Sofia Laviano; Adobe Stock
Knowledge services: Viswa Teja Vanapalli
Visit the Deloitte Consumer Industry Center
Access more insights for the automotive, consumer products, food, retail, wholesale and distribution, airlines and hospitality, and transportation sectors.