Alcohol consumers thirst for value
From entry-level to premium products, consumers reward beer, wine, and spirits brands that offer more value for the price
The alcohol industry has many bright spots, but overall sales are declining.1 Analysts cite a complex mix of challenges, including trade policies, health and wellness trends, GLP-1 drugs, cannabis use, and younger consumers who don’t drink to socialize.2 But something more fundamental is at work: Many consumers no longer feel they’re getting good value for fair prices.3
As inflation peaked in 2022, price and value perceptions eroded—not only in the consumer products industry where alcohol production resides, but also in the stores, bars, and restaurants where alcohol is sold.4 Since then, consumer perceptions haven’t recovered, even though inflation has moderated.5 What’s emerged—and may endure—is a value-seeking mindset.
Deloitte’s ongoing ConsumerSignals survey reflects that 4 in 10 US consumers are value seekers.6 These aren’t just low-income consumers: Nearly a quarter of households earning over US$200,000 are value seekers.7 Industry insiders can see it too. Three in 4 surveyed alcohol executives say value seeking is a structural shift that will persist for a long time.8
However, across entry-level to premium, alcohol brands that offer greater perceived value for the price are outperforming.9 Only about 1 in 3 brands in our study can claim more-value-for-the-price or “MVP” status.10 These brands can be identified using our framework, which assesses brand value while controlling for price-perception effects.
For brands seeking to become MVPs, our playbook provides specific “value-aware pricing” and “cost-aware value” actions, informed by the purchase drivers most associated with MVP brands.
Value seekers intend to spend less on alcohol
Since value seeking is so prominent, it’s important to understand its implications.
Now, alcohol is a “lifestyle” category where consumers might not be inclined to fully admit their spending, but assessing differences can be informative.11 When compared to their non-value-seeking peers, value seekers intend to spend 20% to 40% less on alcohol at home and cut their on-premise alcohol spending at bars and nightclubs by more than half (figure 1).12 They similarly intend to pull back spending at casual and fine dining restaurants, which could further affect alcohol sales.
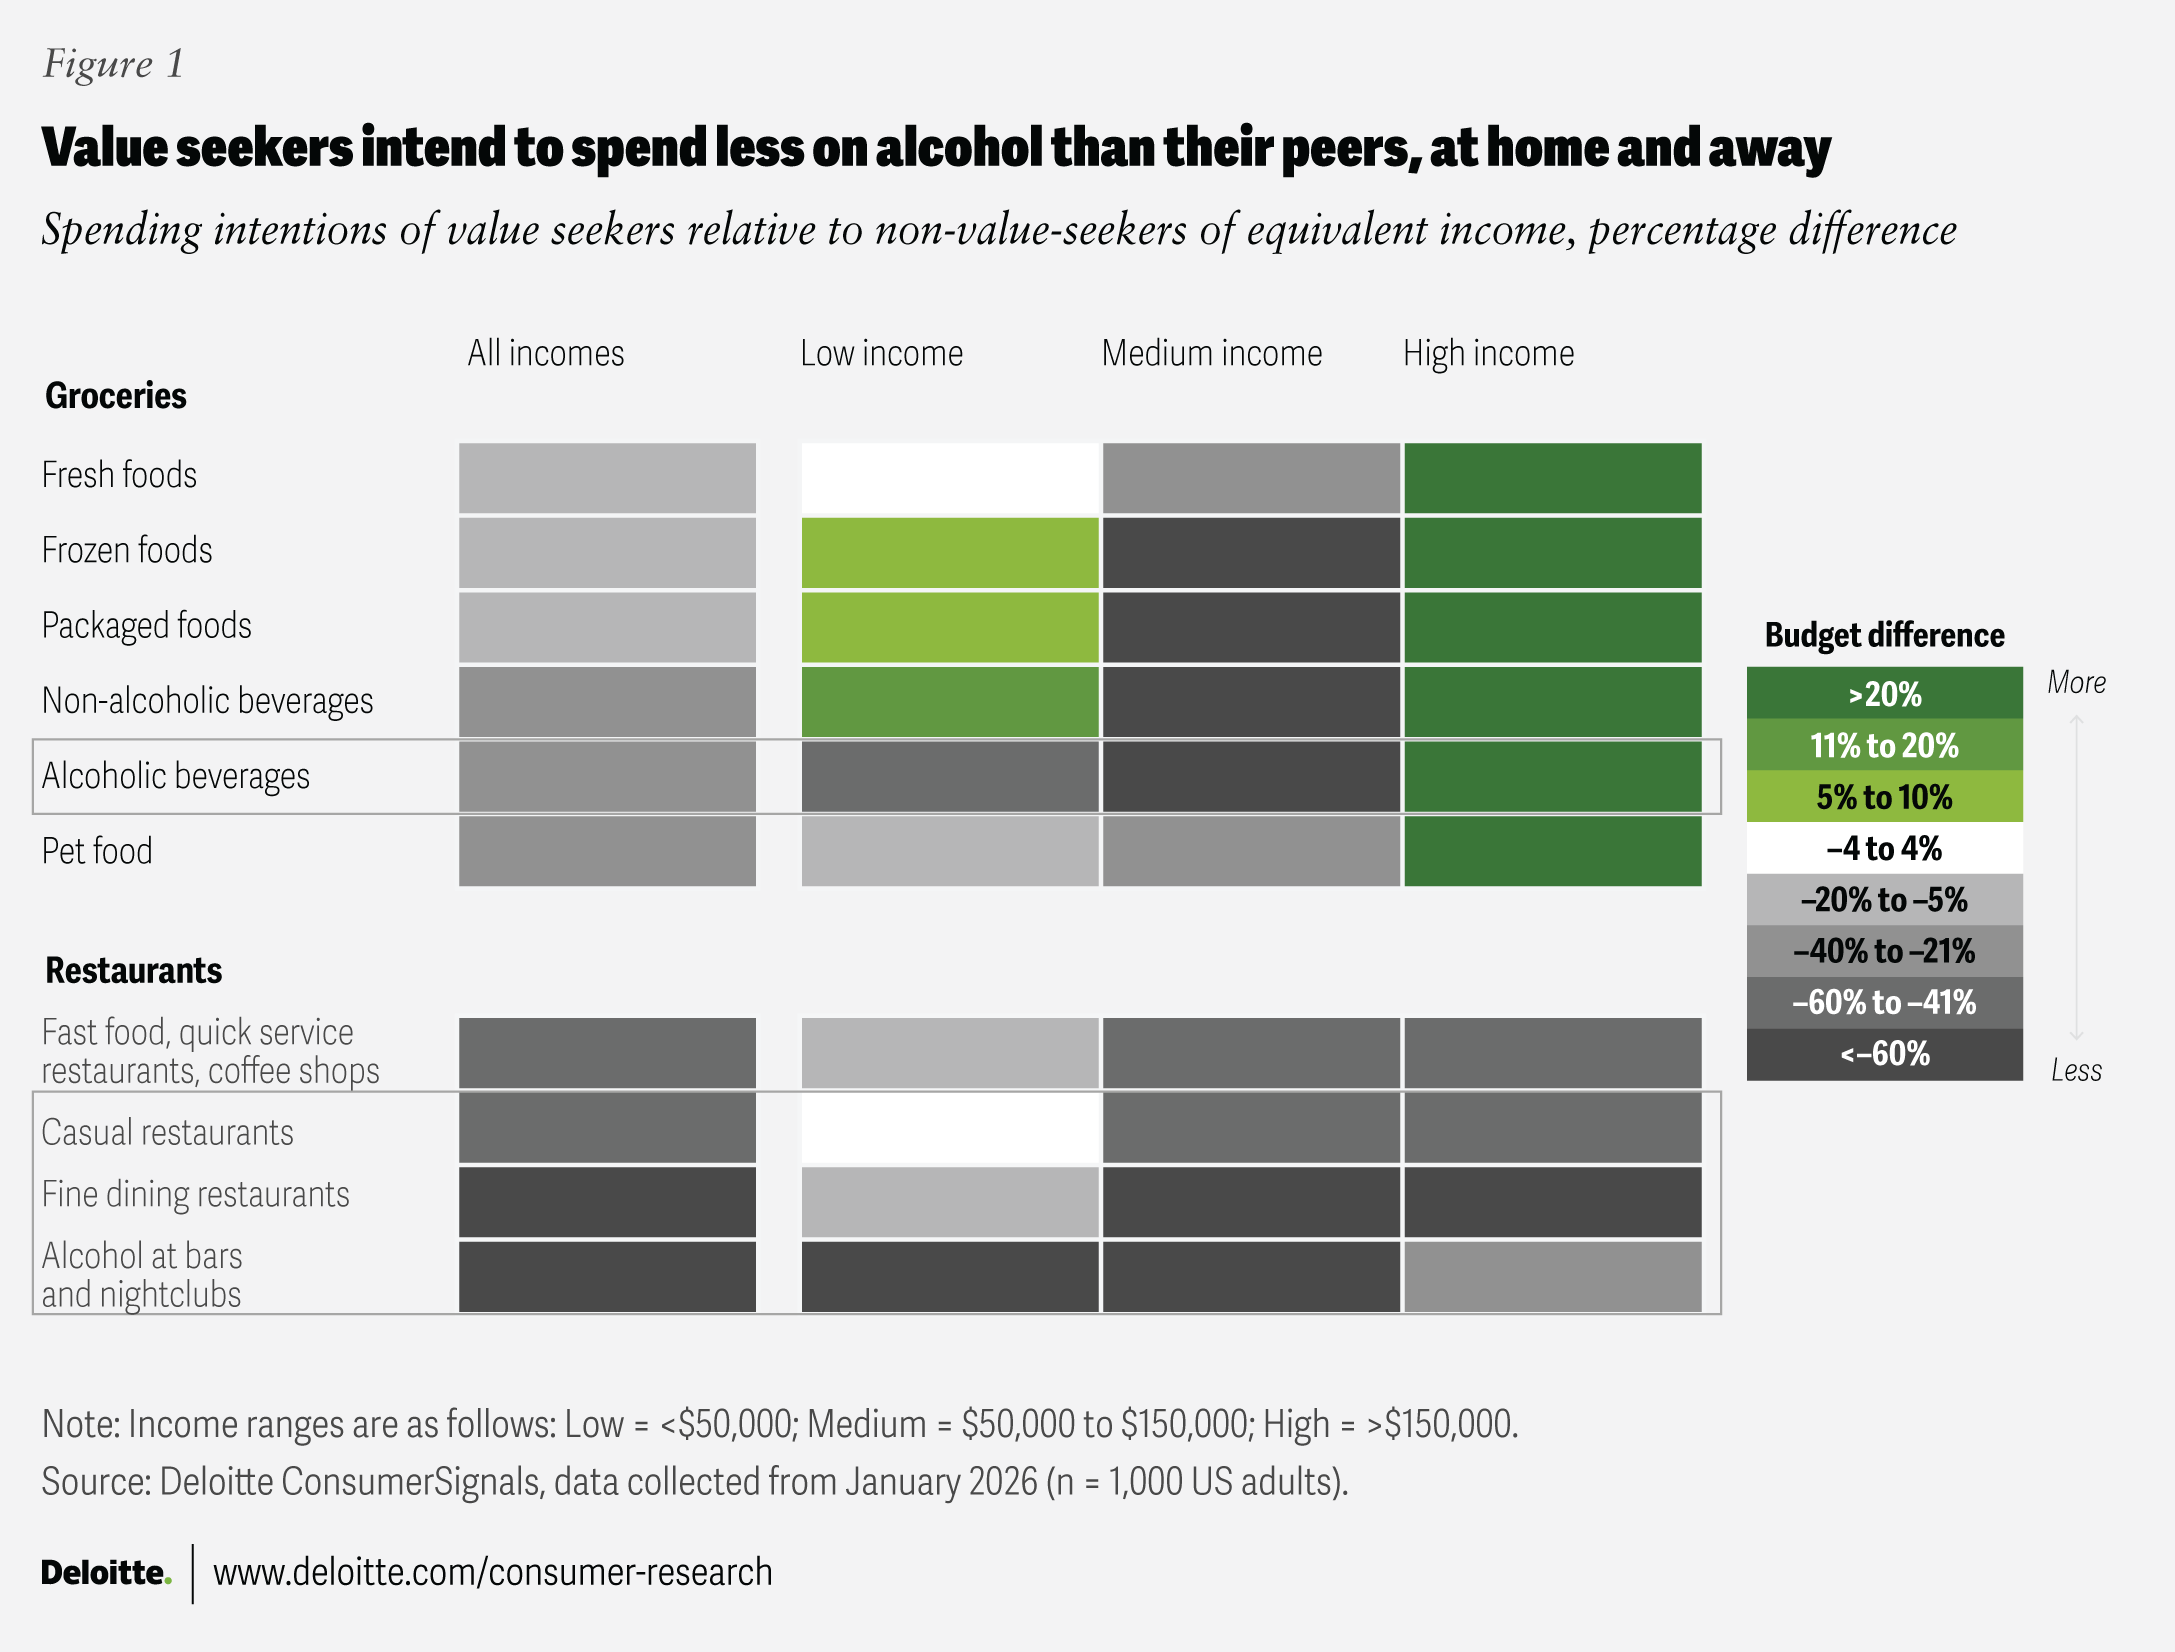
The story varies somewhat between income groups. For instance, lower-income consumers tend to pull back less because there isn’t much slack in their budgets to begin with. They appear to prioritize at-home dining, but specifically target cutting alcohol spending (on- and off-premise) to save money. High-income households shift resources to make the most of at-home dining, including increasing intended retail alcohol spending by over 20%. However, they seem to fund those gains through on-premise pullbacks.
However, even value seekers will likely open their wallets when they find good value. The trick is figuring out what makes a brand “worth it” to them.
Finding more value for the price
Price and value are, of course, linked. It can be difficult to know if something is a good value without knowing its price and vice versa.
Not only does this value/price relationship exist, but it can be quantified. We plotted HundredX consumer-perceived price and value favorability ratings for multiple brands (67 combined) across two groups: beer, wine, and ready-to-drink brands, which also included a handful of zero-alcohol brands and liquor and liqueurs (figure 2). Through regression, we found that an alcohol brand’s price perception can explain between half and three-quarters of its value perception. That’s a powerful connection, but it doesn’t explain everything.
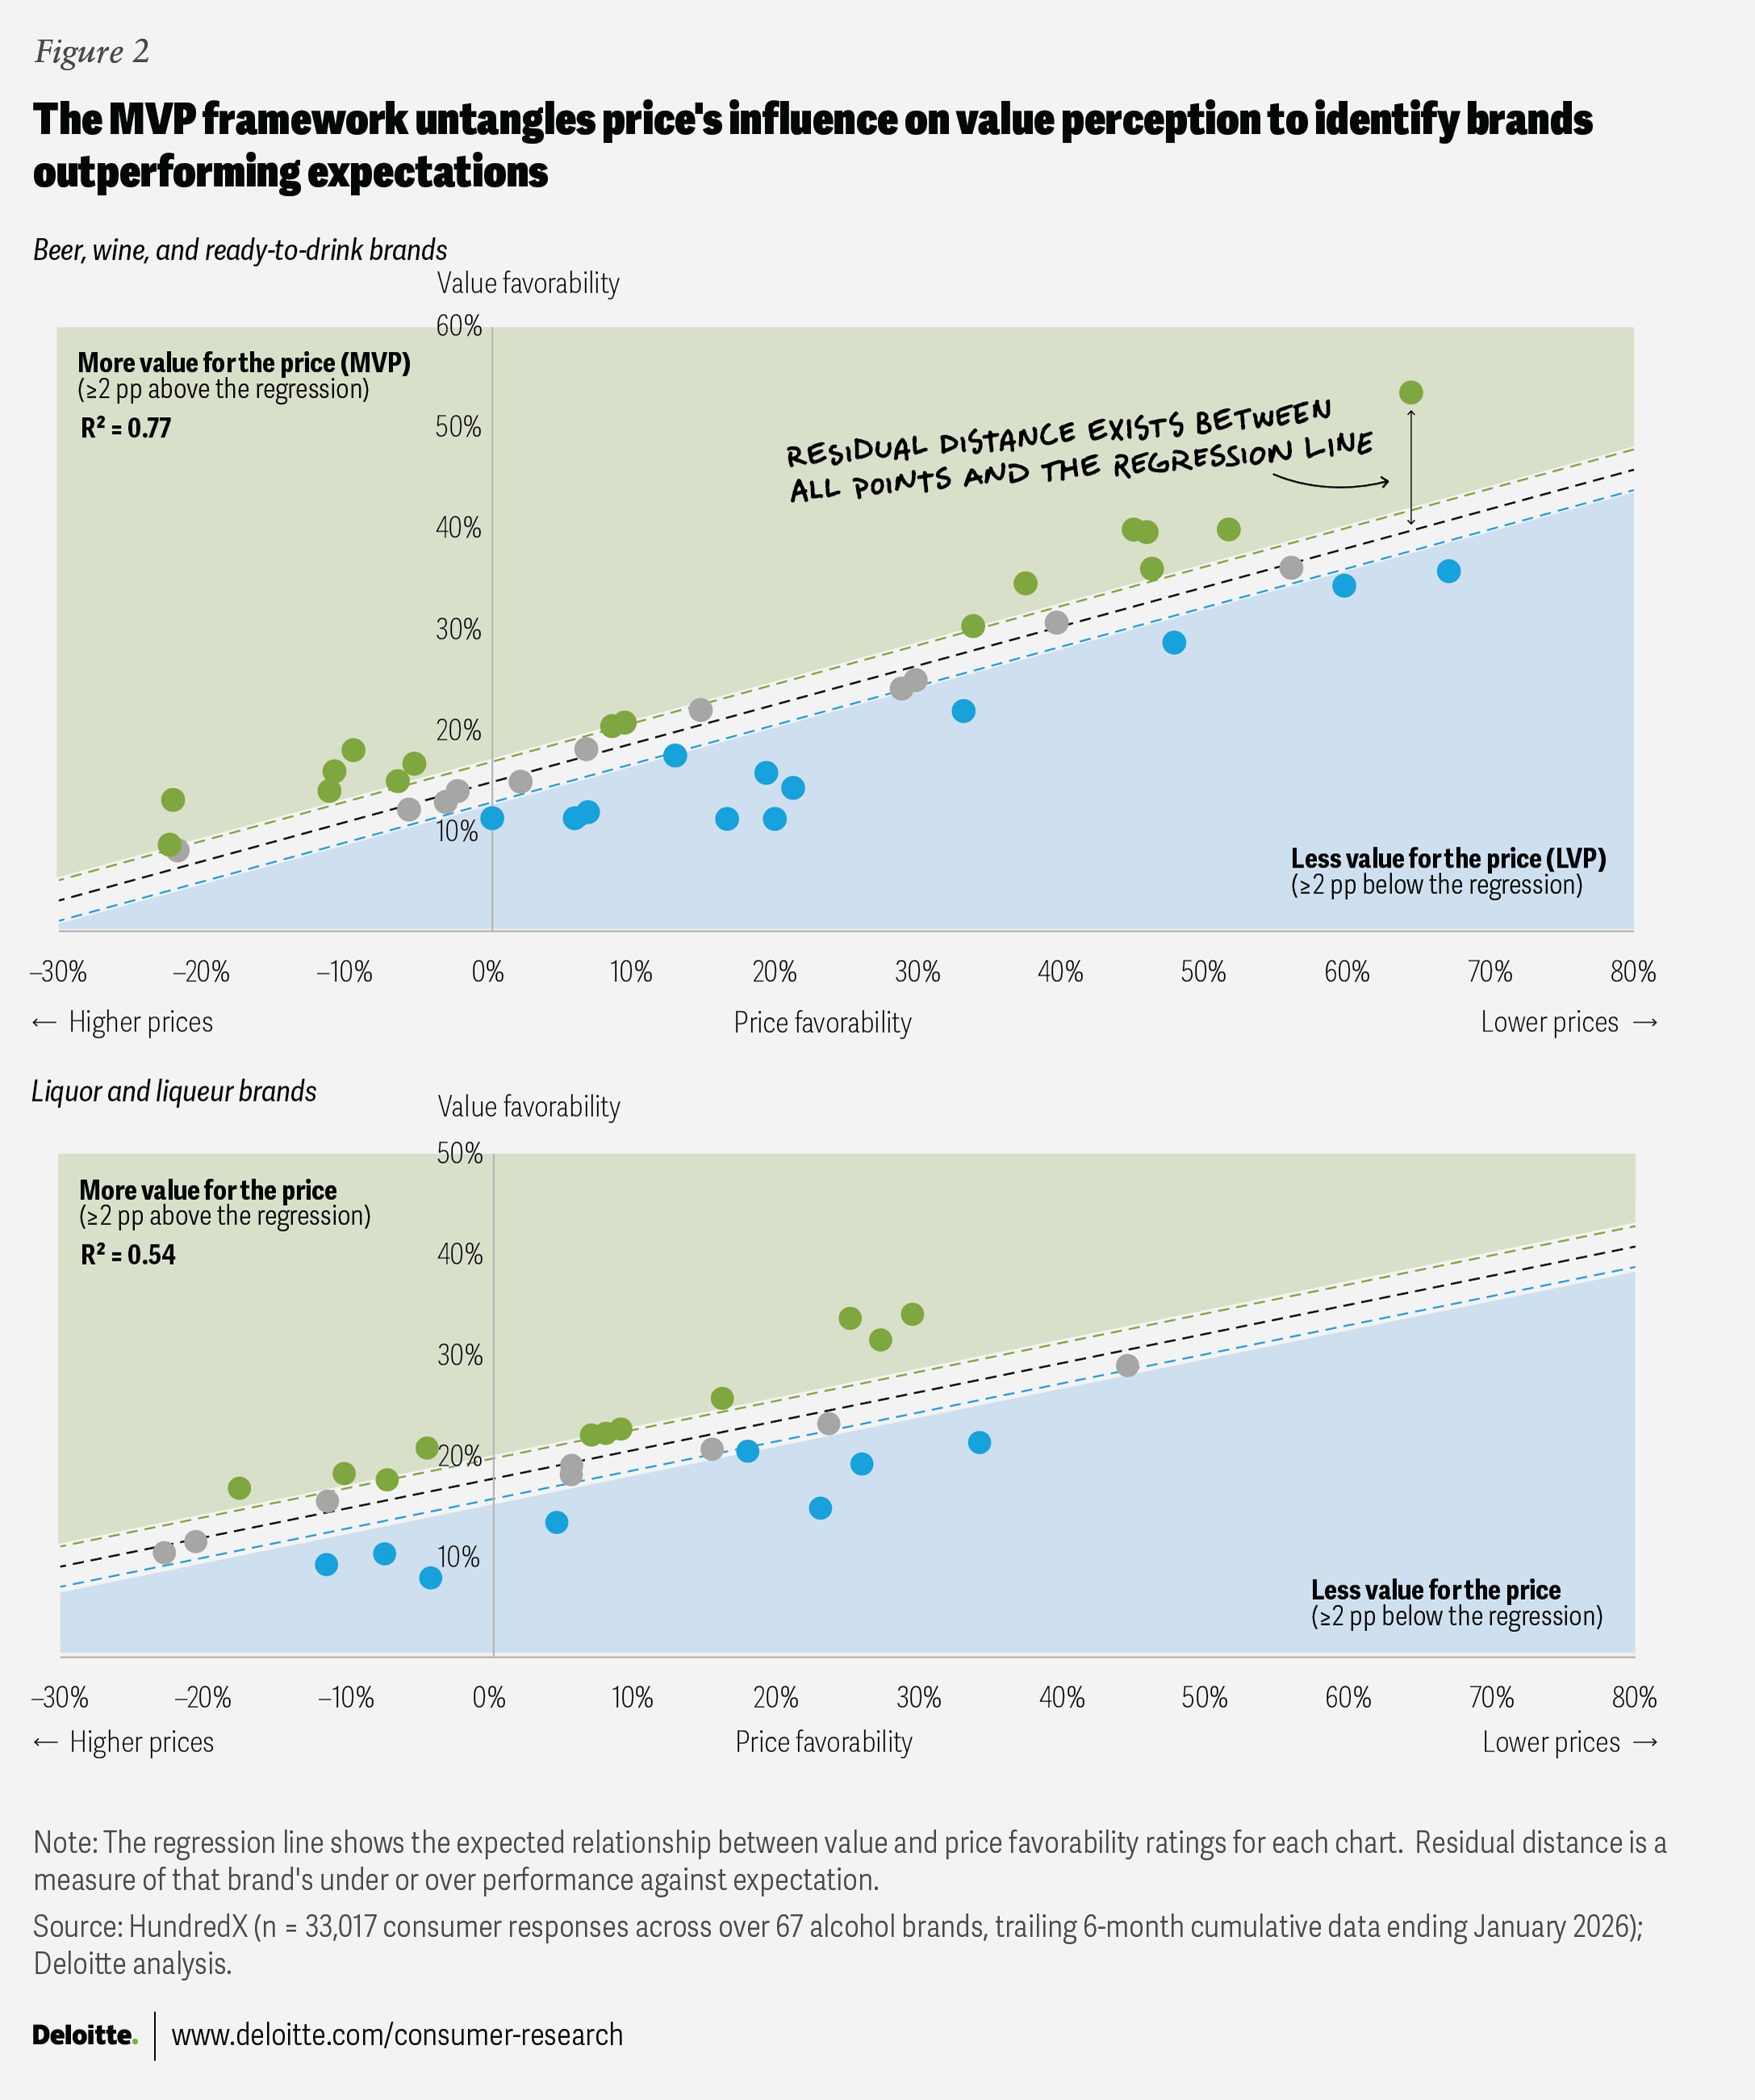
More can be discovered with this same data. In our framework, the regression line represents the expected relationship between value and price. As such, it creates a dividing line and a new metric one could call “value apart from price,” which is calculated as the residual distance between each dot and the regression line.
Some brands with high residuals float well above the regression line, while others dip far below it. Based on our methodology, we call brands that are at least 2 percentage points above the regression line more-value-for-price brands, or MVPs. Similarly, those that are 2 percentage points in their residual score below the regression line are less-value-for-the-price brands (LVPs). Brands that hover near the regression line, within the plus or minus 2-percentage-point buffer, we call anticipated-value-for-the-price brands (AVPs).
So while low-priced and premium brands may have very different value favorability scores on the y-axis, the residual distance from the regression line should be the focus. Note that the left side of each chart shows high-residual-value MVPs with premium pricing strategies—in other words, “value” is not synonymous with “cheap.”
Backward and forward: MVP status matters
In previous research, cross-category MVP brands gained household share in credit card data and had higher future net purchase intent.13 Alcohol MVP brands perform similarly well.
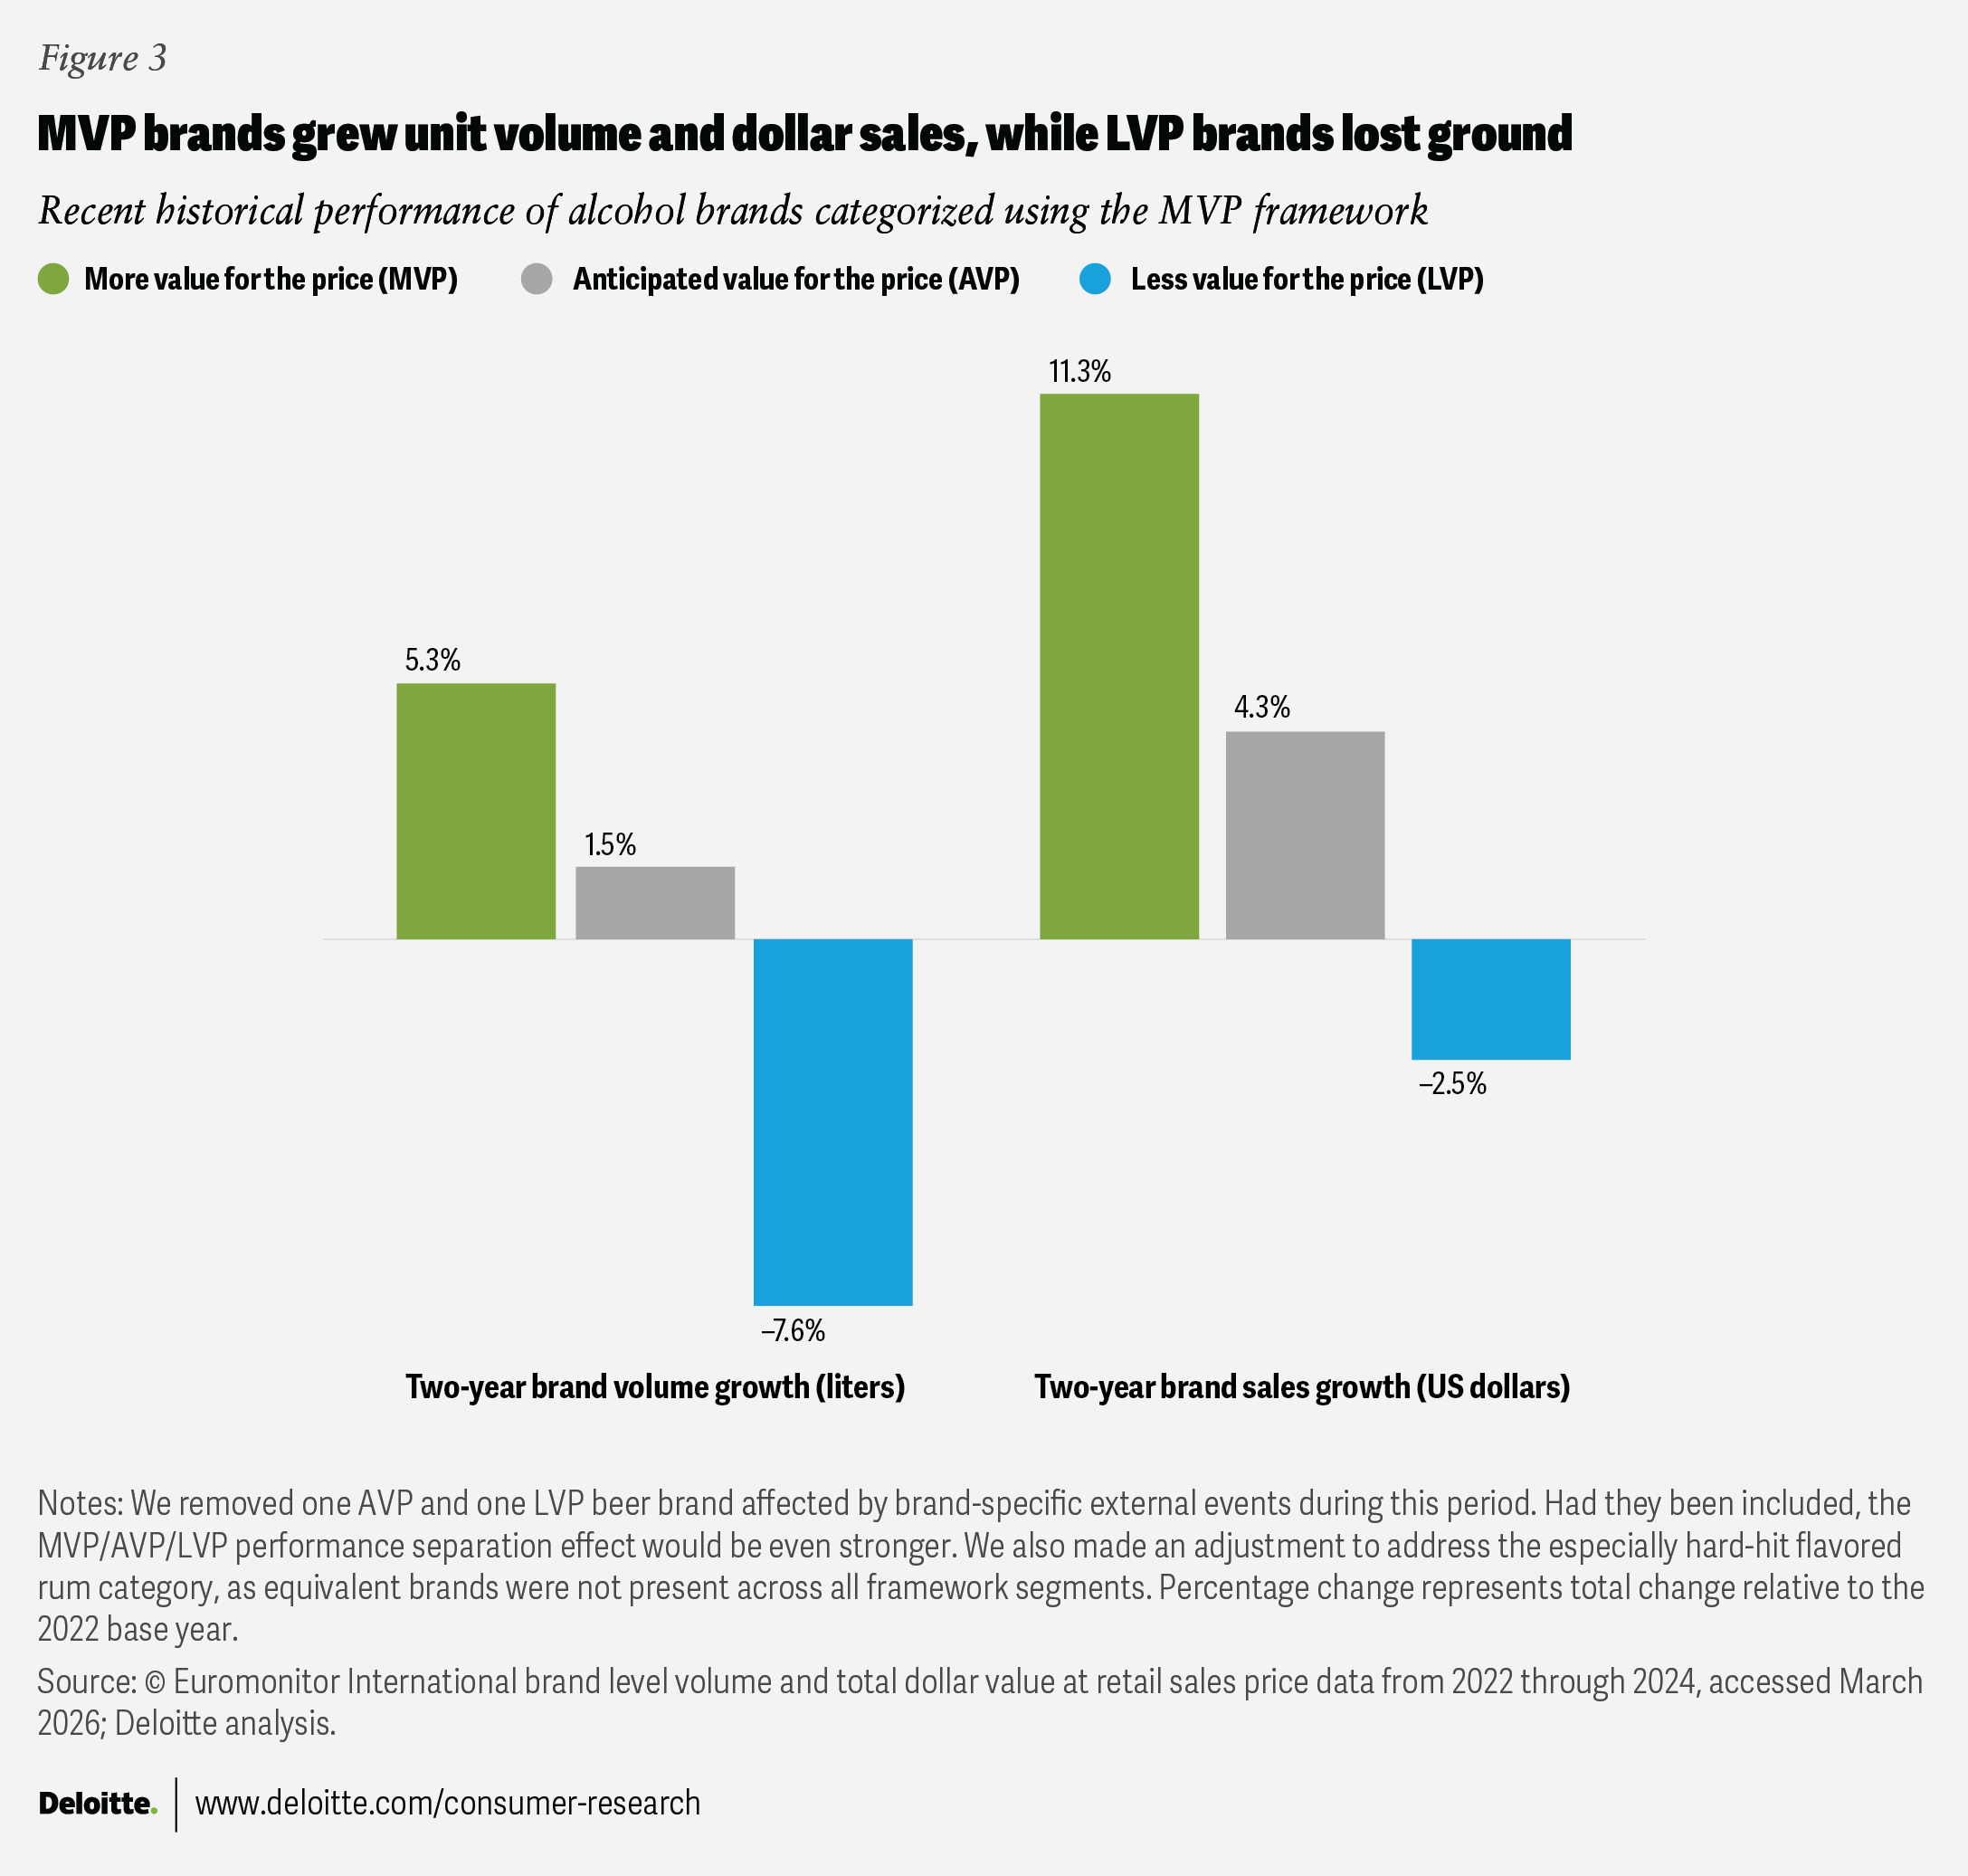
Individual alcohol brands don’t necessarily appear on credit card statements, but Euromonitor International tracks historic volume sold (in liters) and total value at the retail sales price (in dollars) by brand. The latter is akin to the revenue a given brand generates at the point of sale. We used the most recent available US market performance data (2022 to 2024) and categorized our brand universe into MVPs, AVPs, and LVPs as they stood at the start of the growth period.
With 2022 as the basis, MVP brands as a group subsequently grew overall liters and total dollar value, whereas LVP brands lost on both (figure 3).14
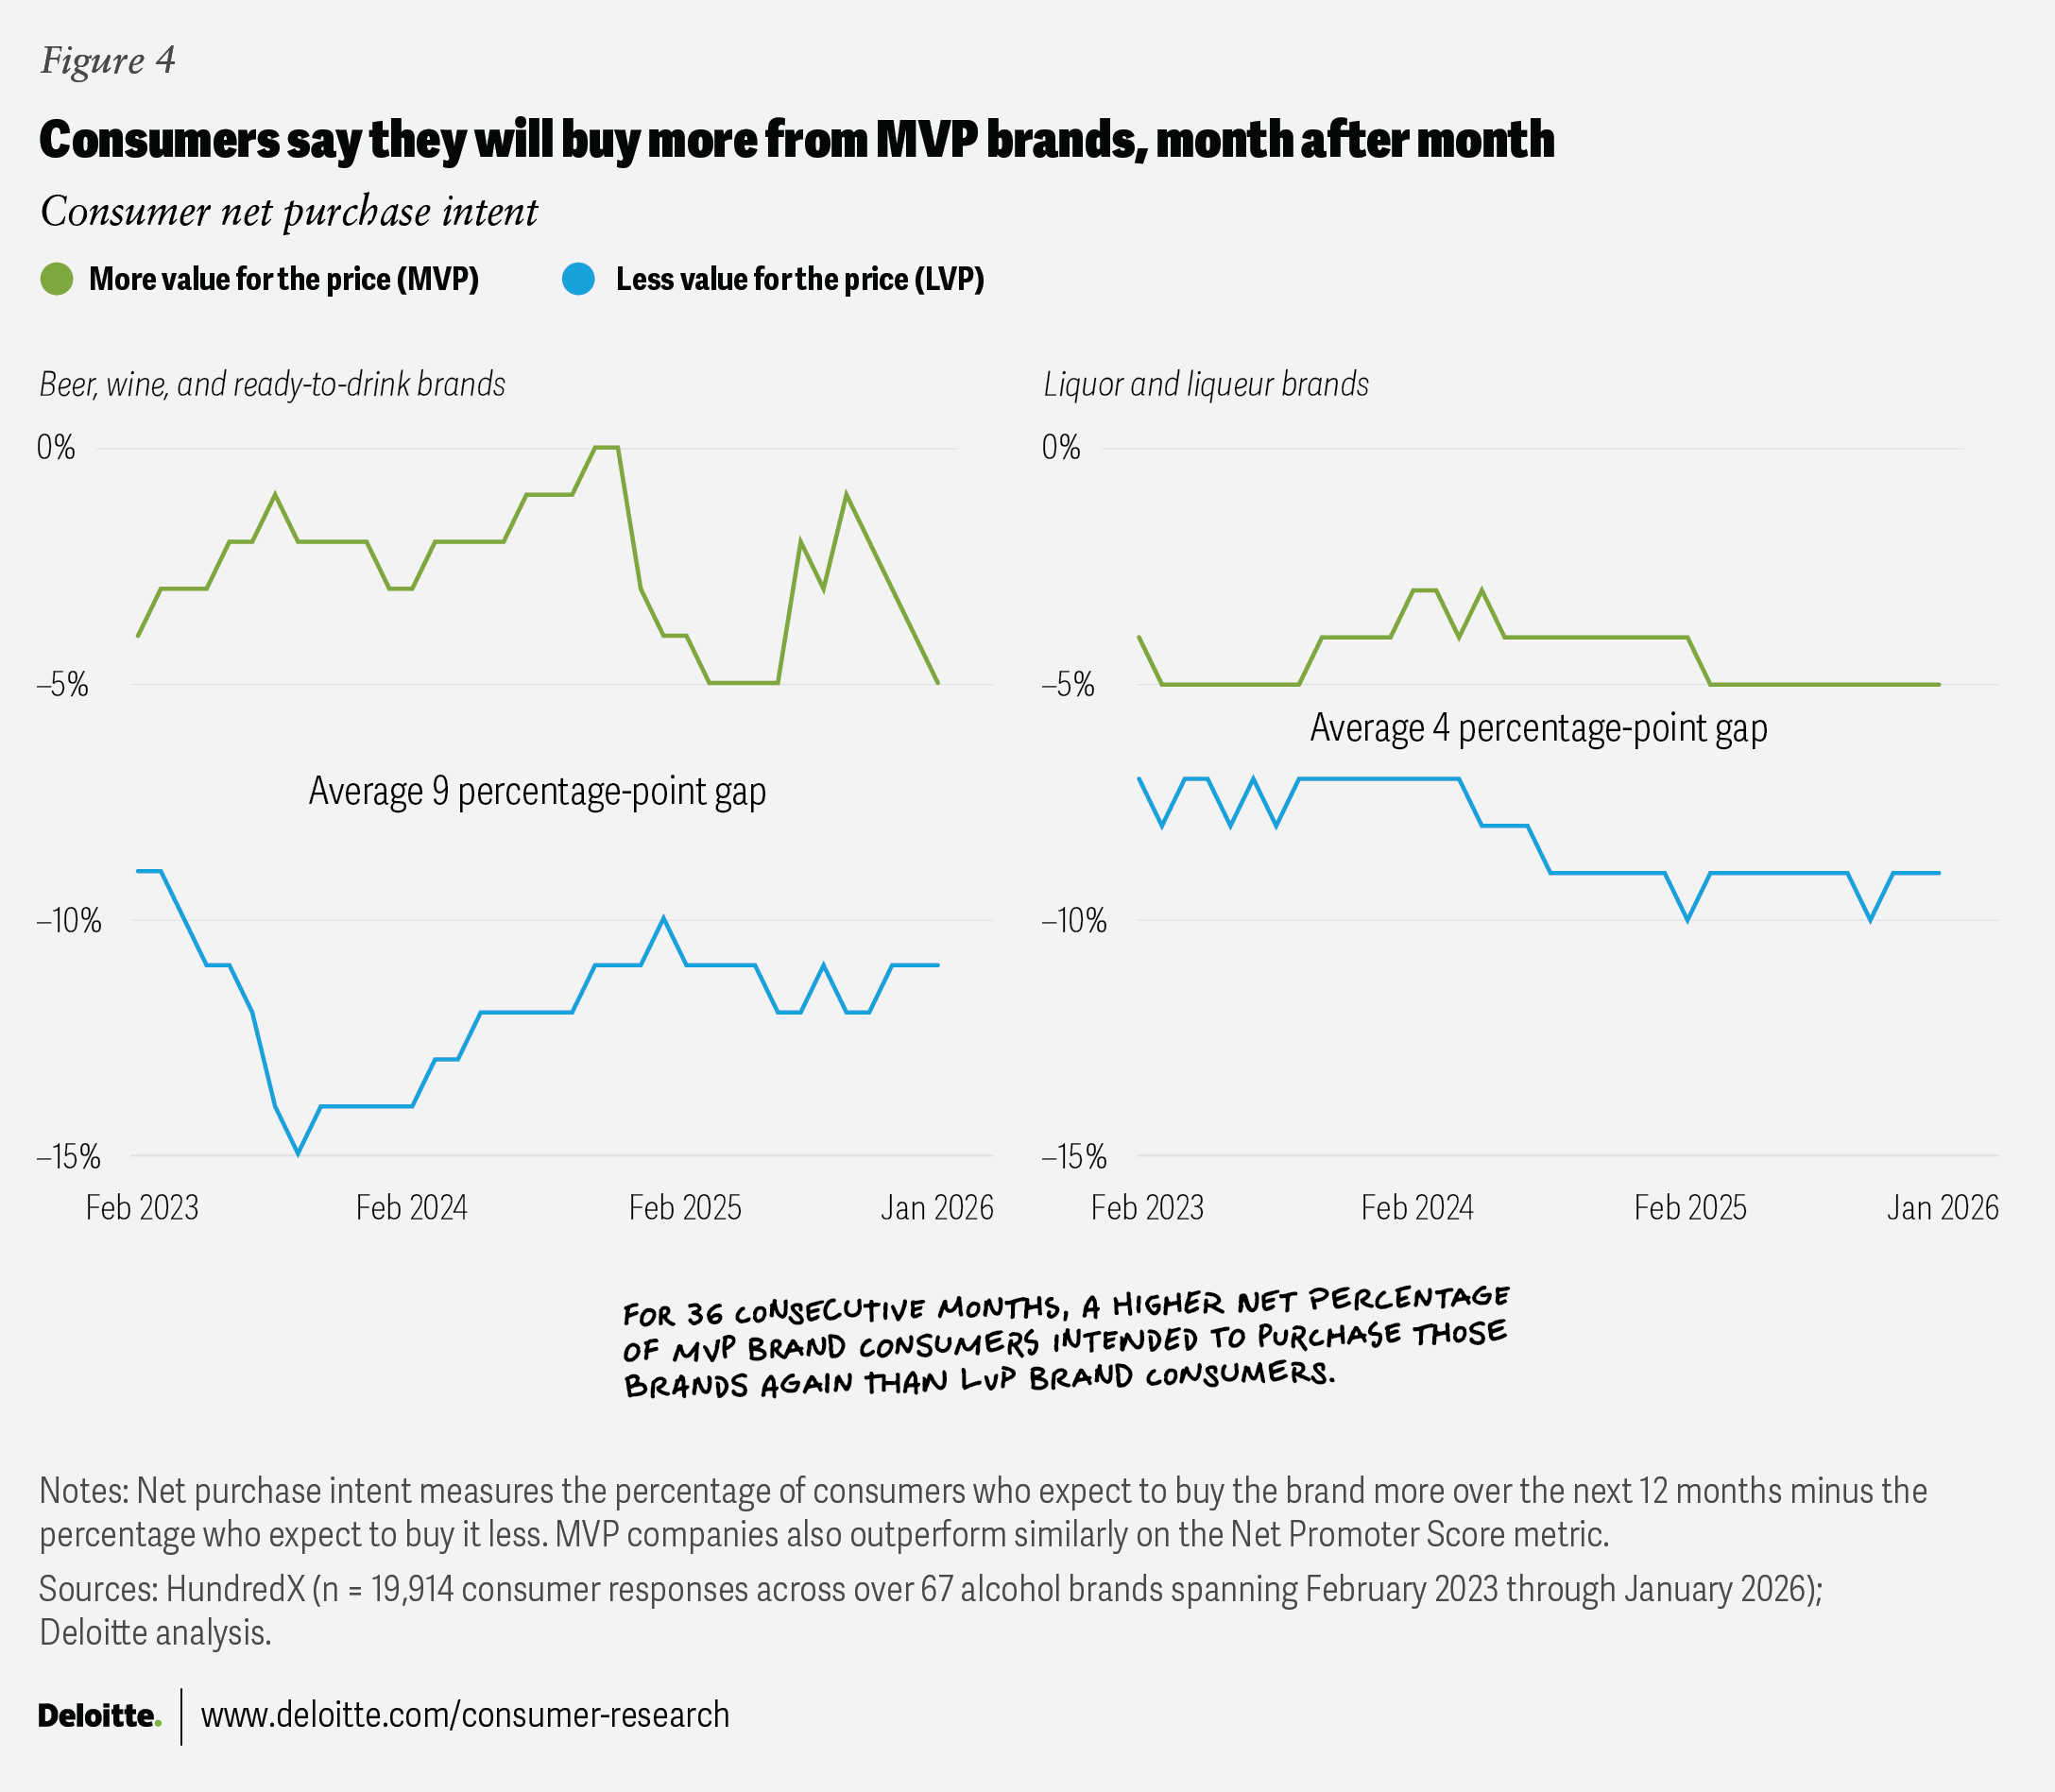
MVP brands seem better positioned to succeed in the future as well. When asked each month for 36 consecutive months, more consumers said they planned to purchase MVP brands in the coming year than LVP brands (figure 4).15 It isn’t shown, but repeating this analysis for the Net Promoter Score metric yields a similar result.16
What do alcohol consumers value beyond price?
As previously noted, value amounts to more than price. When consumers were asked to select the non-price drivers that most influence their decision to purchase a particular alcohol brand, five rose to the top: taste, product availability, flavors, convenience, and quality (figure 5).
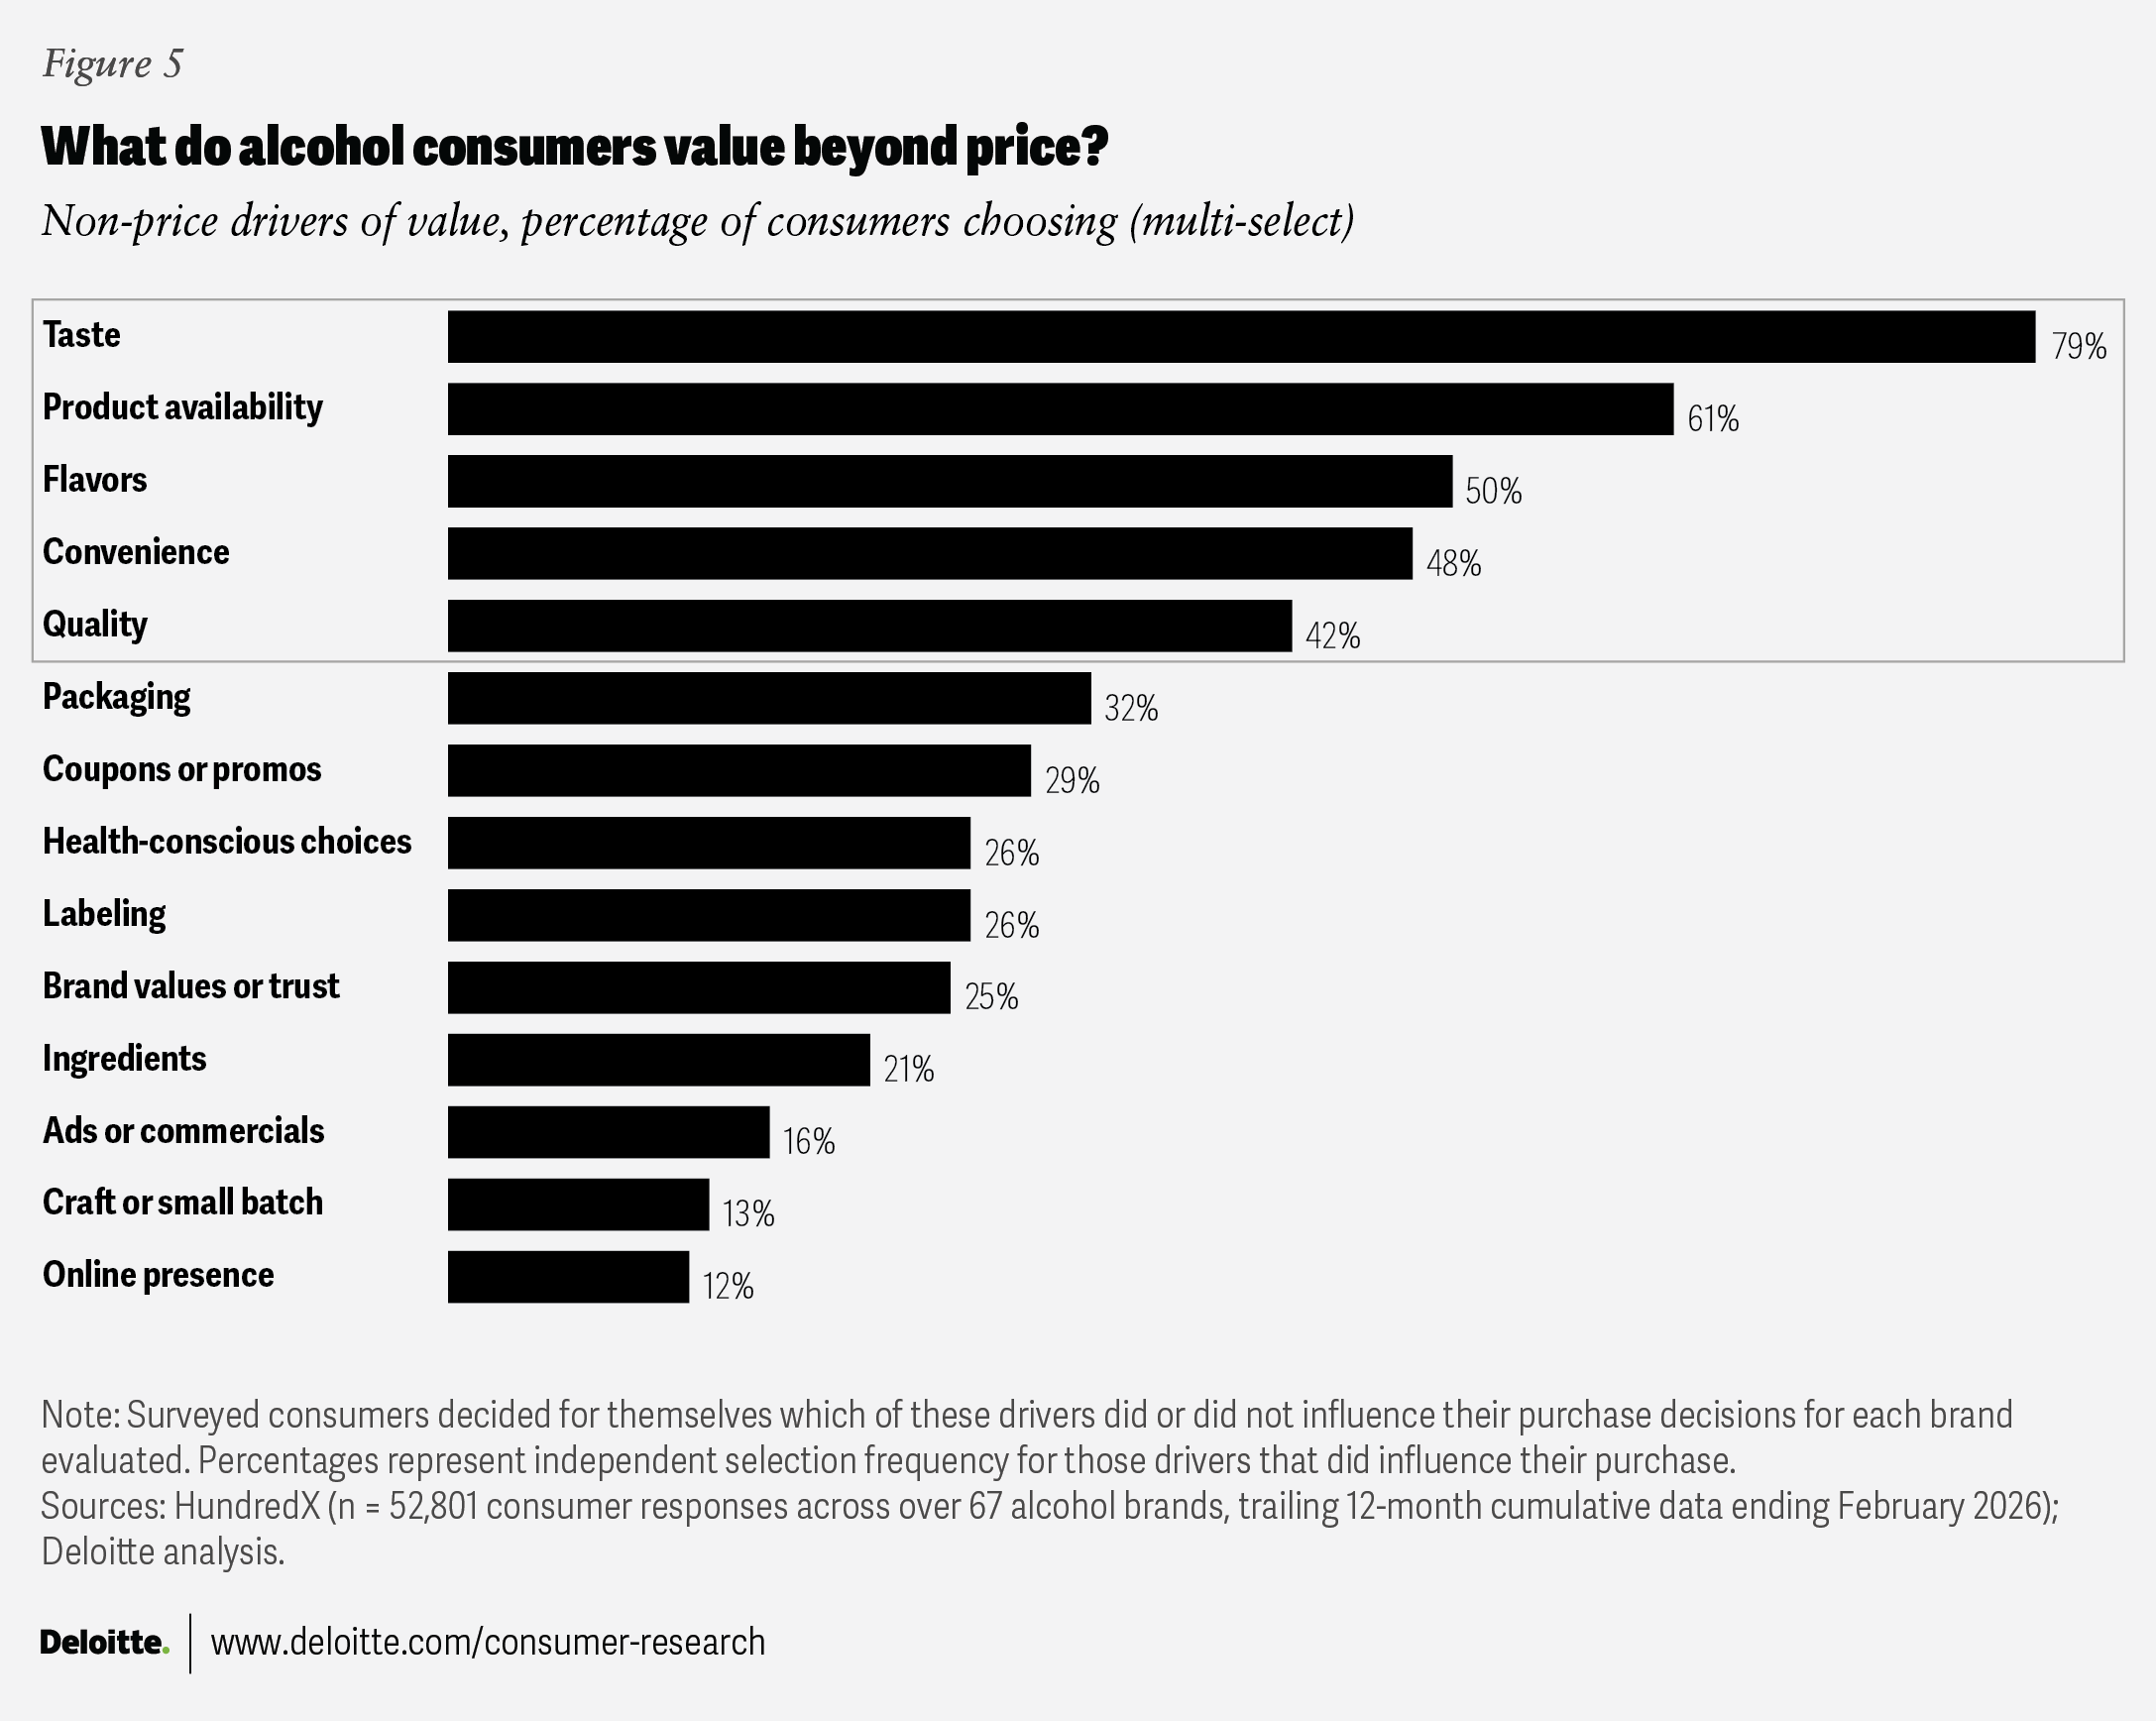
Demographic cuts reflect some differences. For instance, product availability and taste become increasingly important to older consumers. Contrarily, the importance of having specific flavors of beer, wine, and ready-to-drink brands decreases with age.17
Although a growing focus on health and wellness has been noted as one reason for the industry’s sales challenges, only about 1 in 4 consumers surveyed selected the health-conscious choices driver. However, among younger respondents (21 to 29 years), closer to 1 in 3 say they value healthy choices when choosing which brands to purchase.18
How do MVP brands stand apart?
Quality and trust were critical components of MVP brands across diverse sectors, spanning grocery, apparel, restaurants, hotels, and vehicles.19 Those same drivers also play critical roles in alcohol MVP brands. But alcohol’s unique factors, like taste, flavors, and product availability, are also differentiating for MVPs.20
- MVP brands excel in quality and trust.21 This MVP advantage shows up in higher selection frequency and in relative comparisons, such as “quality for the price.” Consistency, a factor associated with both quality and trust, is also a superior attribute for MVP brands.
- They are known for boldness and taste consistency.22 In contrast, LVP buyers want sweetness, flavor variety, and “enjoyable” tastes.
- Consumers of MVP brands value product availability in restaurants.23 The desire for on-premise availability increases with age. On the other hand, consumers of LVP brands emphasize the availability of their favorite flavors at retail outlets, dovetailing with their variety theme.
- For consumers making health-conscious choices, MVP brand buyers tend to have a higher preference for low- or no-alcohol options.24 MVP buyers more often define healthy options as having low or no alcohol. Consumers of LVP brands are more likely to define health as low calorie.
Playbook: How to be an alcohol MVP
As our framework has shown, it doesn’t take a discount price point for alcohol brands to attract value seekers. Instead, capturing their spending should include a strategic understanding of what makes consumers feel they’re getting more value from every purchase.
Assess your brand’s current ratings relative to competitors by surveying consumers or using third-party data to create a custom price-value plot and regression line, like our MVP framework. Then use those results to take actions that can give you an MVP advantage over competitors.
These actions fall into two categories: value-aware pricing and cost-aware value.
Value-aware pricing
Price optimization usually considers volume and margin implications. But add perceived value to the equation. As we have shown, leaving some excess value on the table can help build loyalty and facilitate growth.
- Focus revenue growth management tools on longer-term impact. Short-term benefits caused by overoptimizing return on investment for today can come at the expense of consumer value down the line. Like trust, it can take a long time to build—but a short time to break—positive price perceptions.
- Strategically measure promotions’ impact on value perception. Add this to the other strategic goals you are targeting, such as sales volume and new customer trials.
- Tailor sizes and formats to value seekers. Price pack architecture can help to adapt products to price points that better serve priority occasions and channels.
- Shield consumers from unexpected price hikes. Manage supply chain risks to reduce shocks and avoid passing on higher costs reactively.
- Protect margins without sacrificing quality. When possible, pull execution levers other than price to bolster margins. Focus on increased efficiency to provide greater future price optionality and resilience.
Cost-aware value
Justify product and service enhancements based on their resulting increase in brand value perception compared to your competitors. Reallocate investments that don’t improve perception to those that do. Managing this well often requires collecting consumer data over time. Look to MVP brand value drivers as a guide for where to consider investing.
- Find your brand’s unique quality drivers and tell its story. Quality can be found in aging, ingredients, history, exclusivity, association, process, personality, and more. It takes introspection (and lots of data) to find your differentiators, and ultimately, the consumer decides. No matter where you land, investing in telling your story can help to drive perceived value.
- Cultivate brand trust through competency and intent. The liquid in your bottles should be authentically positioned, live up to its marketing claims, and be reliably on shelves and behind the bar.
- Avoid chasing flavor variety, novelty, and approachably sweet tastes. It can work for some, but it can be a more difficult platform for sustained value advantage. There is likely risk in trying to find today’s hits, and shifting trends can turn past advantages into tomorrow's liabilities. The strategy may also attract a consumer less aligned with long-term loyalty or future premiumization.
- Build value through on-premise availability. Brand presence in bars and restaurants creates opportunities to establish new rituals, drink recipes, and associations that can boost your brand’s perceived value and translate into at-home consumption habits.
- Use the MVP framework to help expand portfolio value. Manage value at the portfolio level through acquisitions, divestitures, and stock keeping unit reductions. The MVP framework can help identify favorable acquisition targets or existing brands to sell or discontinue if improvements are too costly.
By
Andrea Bell
Justin Cook
Vivek Dogra
Nimisha Mohanan
The authors would like to thank Steve Rogers, Akash Kumar, Marcello Gasdia, Ben Boczulak, Kirsten Royster, Andre Benjamin, Alexander Cromwell, Blake Guidry, Jon Kaplan, James Jennings, Mara Wrzesniewski, Clark Passino, and the greater Deloitte Converge Consumer data team.
We would further like to thank Rithu Thomas, Preetha Devan, Jim Slatton, and Jaime Austin for their contributions to the production of this report.
Editorial (including production and copyediting): Rithu Thomas, Preetha Devan, Shyamili, and Pubali Dey
Design: Molly Piersol, Natalie Pfaff, and Jaime Austin
Cover image by: Jim Slatton; Adobe Stock
Knowledge services: Agni Wagh
Visit the Deloitte Consumer Industry Center
Access more insights for the automotive, consumer products, food, retail, wholesale and distribution, airlines and hospitality, and transportation sectors.