
Uncertainty clouds the US Fed’s future rate path
The May 2026 Economics Insider examines the key forces shaping the future of US monetary policy
At the start of this year, two main questions regarding the trajectory of US monetary policy arose: First, who will replace Jerome Powell as the chair of the US Federal Reserve? Second, what could that mean for the path of interest rates and the US Fed’s balance-sheet strategy? Both are pertinent questions, given the US economy is witnessing an investment boom in artificial intelligence and facing key risks to inflation and jobs growth simultaneously.
Decisions on the federal funds rate impact the prime lending rate, which, in turn, influences near-term borrowing costs like those for auto loans and credit-card debt. On the other hand, the Fed’s balance sheet strategy, including decisions on purchases or sales of assets like US Treasury bonds, impacts longer-duration yields that are closely tied to long-term borrowing costs like the 30-year fixed mortgage rate.
The air cleared on the first question on Jan. 30, 2026, when President Trump announced the nomination of Kevin Warsh, a former governor at the US Federal Reserve between 2006 and 2011, as the next chair.1 Warsh’s nomination, however, hasn’t cleared economic uncertainties for the Fed. The disruption of the Strait of Hormuz has pushed up energy prices, especially gasoline, in the United States. If the conflict persists, it may raise production costs, which have already picked up over the past year due to US tariffs.
Warsh has spoken about AI productivity gains offsetting price pressures elsewhere,2 but it is still early days. And while a smaller balance sheet may support monetary policy, it could increase the strain on fiscal balances if bond yields go up.
Inflation has the US Federal Reserve on tenterhooks
In March, the median view of the Federal Open Market Committee was that core personal consumption expenditure inflation will average 2.7% in 2026 before slowing to 2.2% in 2027.3 That’s still higher than the committee’s 2% target. There are three key reasons why inflation is elevated and may remain that way.
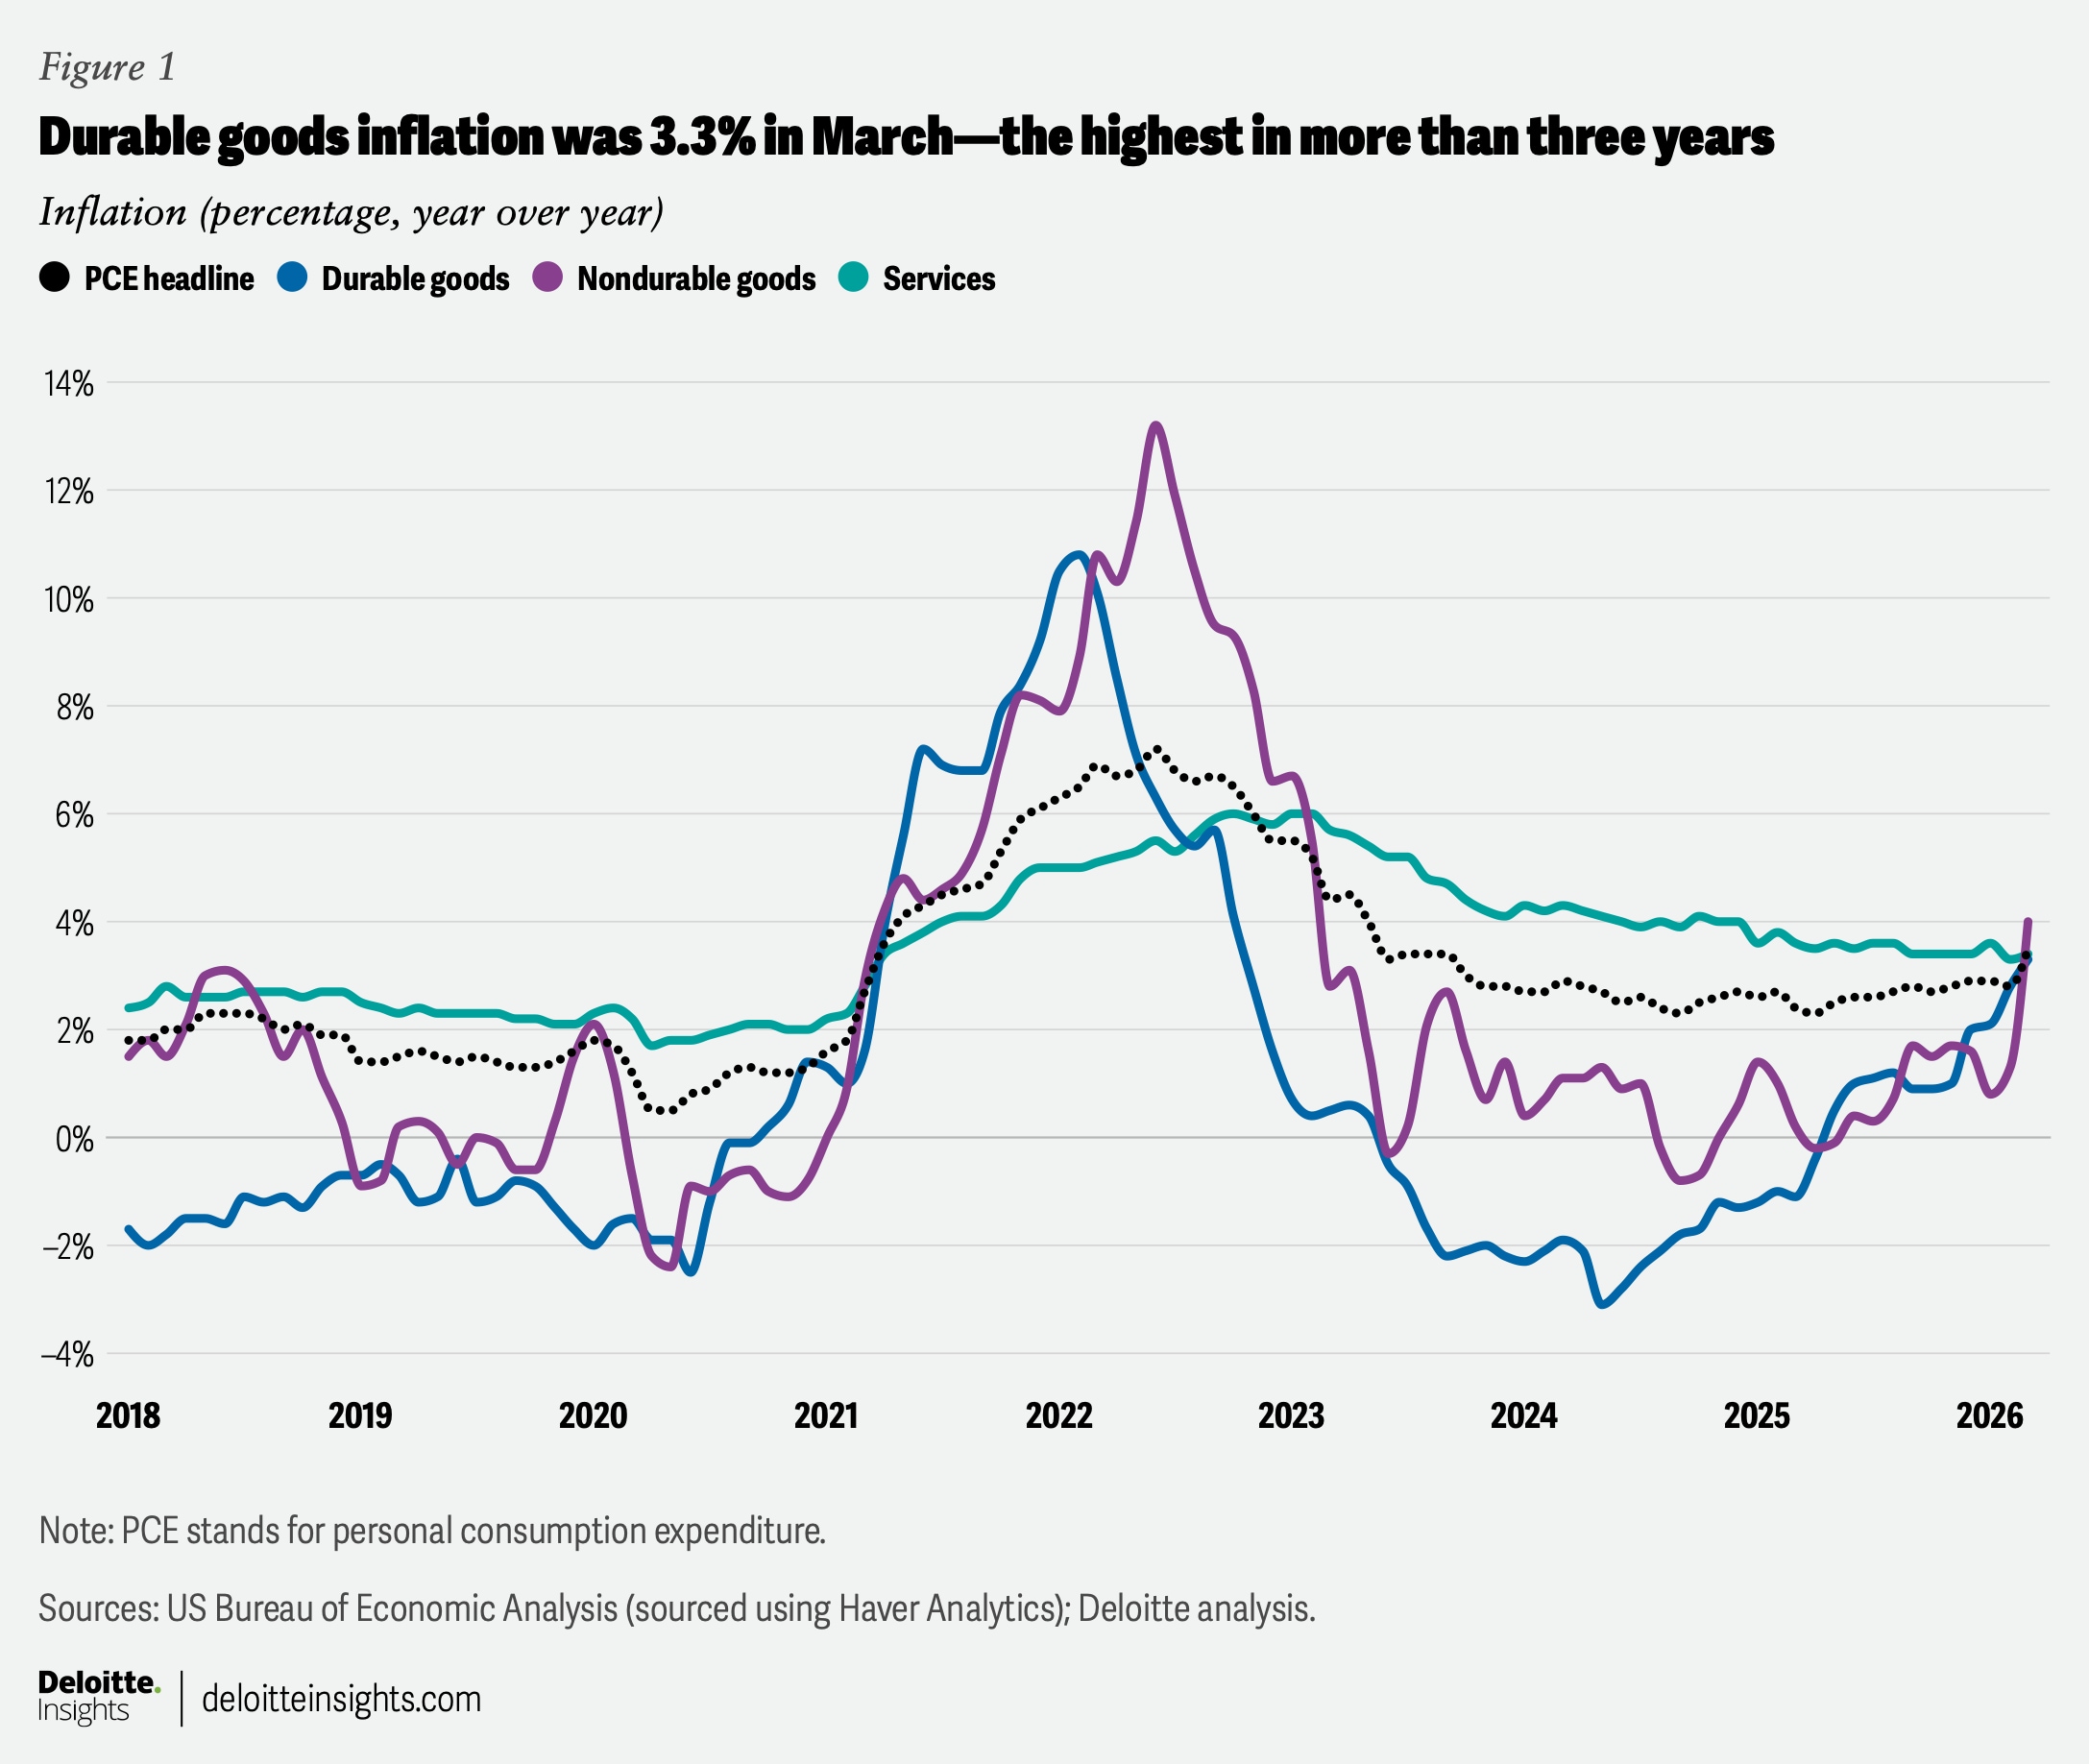
First, the effects of US tariffs have likely percolated down to consumer prices of durable goods.4 Durables inflation has been going up and was 3.3% in March—the highest in more than three years.5 While this is still lower than the supply and demand–driven surge between 2021 and 2022, rising durable goods inflation has offset some of the gains from slowing services inflation (figure 1). And although the US Supreme Court ruled reciprocal tariffs illegal in February, subsequent efforts by the US administration to raise tariffs under section 301 of the Trade Act of 1974 would keep tariff rates high compared to end-2024.6 Deloitte economists forecast an average effective tariff rate of 12% by the end of 2026 in their latest baseline scenario.7
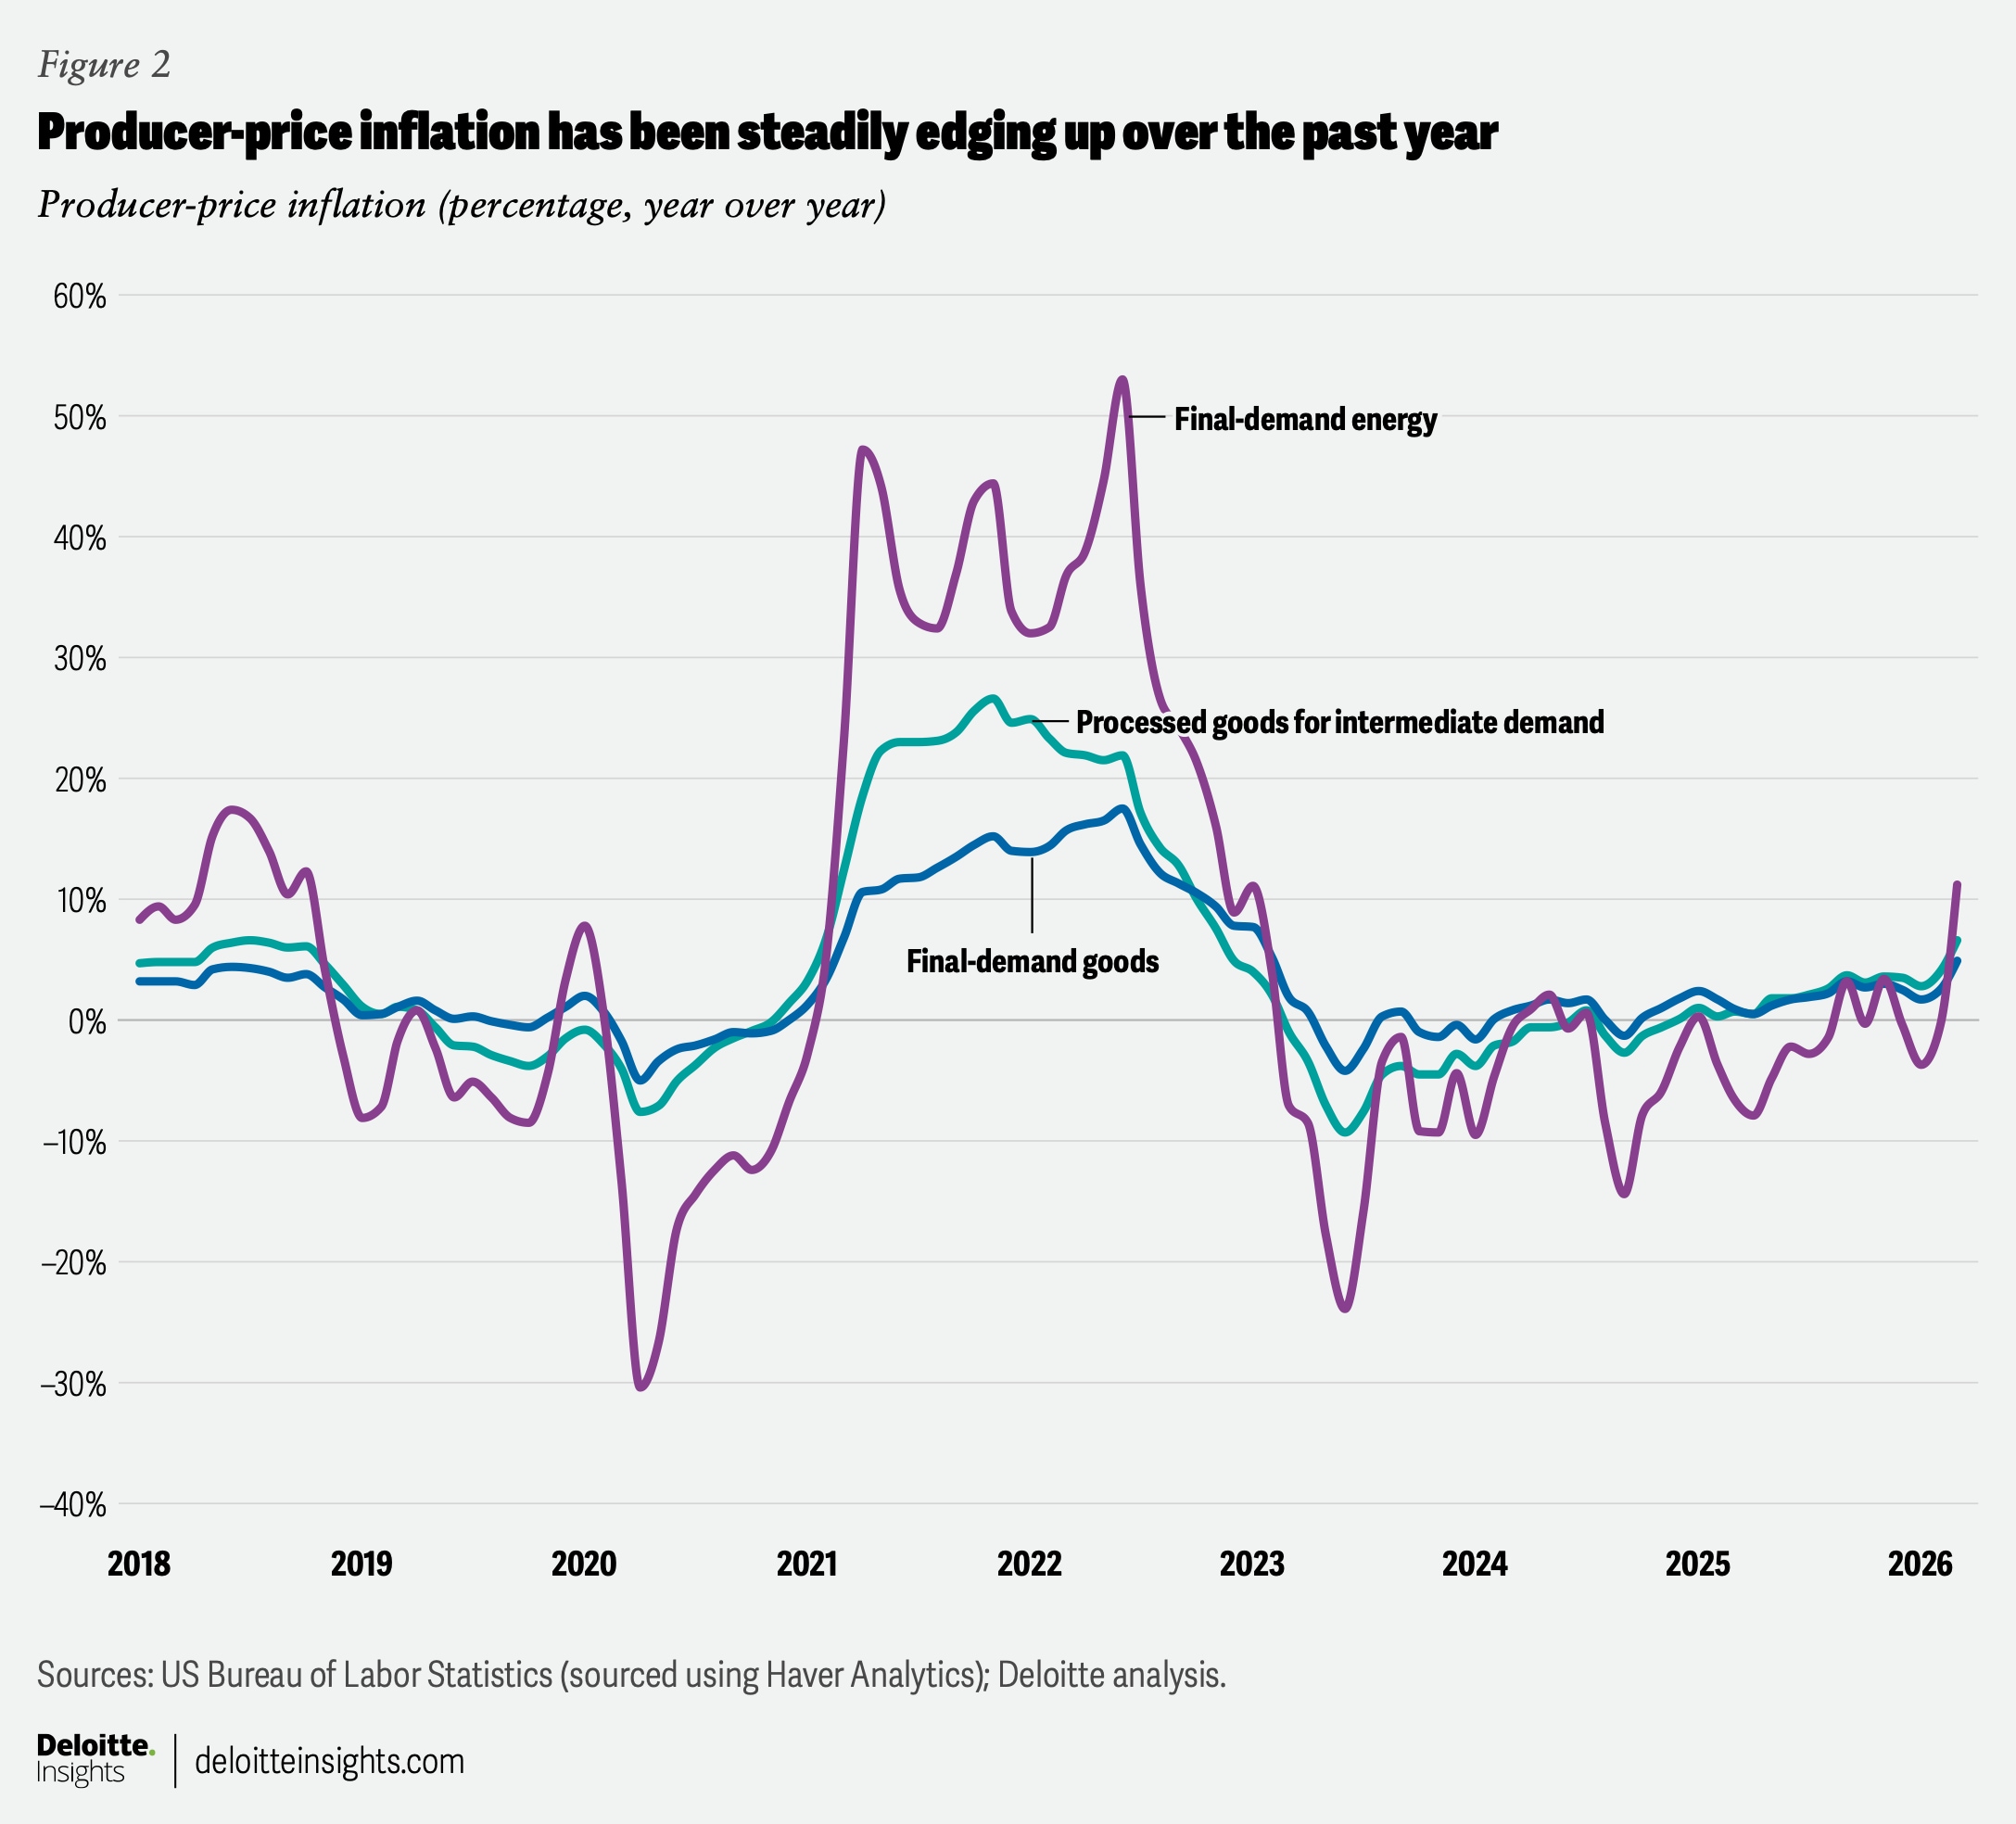
Second, not all increases in production costs—either due to tariffs or the recent surge in energy prices due to the Middle East conflict—have found their way to consumer prices. That, however, may change as margins of producers and importers come under pressure. Producer-price inflation for final-demand goods, for final-demand energy, and for processed goods for intermediate demand are now at their highest levels in three years (figure 2).8 In addition, auto manufacturers are likely to remain attentive to any major changes to the free movement of goods across borders as the United States-Mexico-Canada Agreement comes up for renegotiation in July 2026.9
Finally, inflation dynamics have changed, with prices of essentials like utilities (electricity and gas) and certain food items steadily going up over the past year.10 The ongoing conflict in the Middle East could add to those pressures. Gasoline prices, for example, were up 22.2% in March from the previous month—the sharpest monthly increase since August 2022.
The conflict also poses a risk to global food supply chains.11 About 20% to 30% of global fertilizer exports pass through the Strait of Hormuz.12 Production of urea, a nitrogenous fertilizer, has also been disrupted due to the shutdown of liquefied natural gas plants in Qatar.13 This is likely to impact crop yields and, hence, food prices. And although the current oil shock may have a lesser impact on the US economy than previous ones (see “A Hormuz-sized problem, but maybe not as big as previous ones”), the US Fed will likely remain cautious, especially to keep inflation expectations in check.
A labor-market conundrum: Slowing job growth and low unemployment
US labor market signals appear somewhat conflicting. First, job growth has slowed;26 and second, unemployment is still relatively low.27 This pattern reflects both demand and supply within the labor market. For the US Fed, any demand slowdown is likely a bigger worry as monetary policy has limited influence on labor supply.
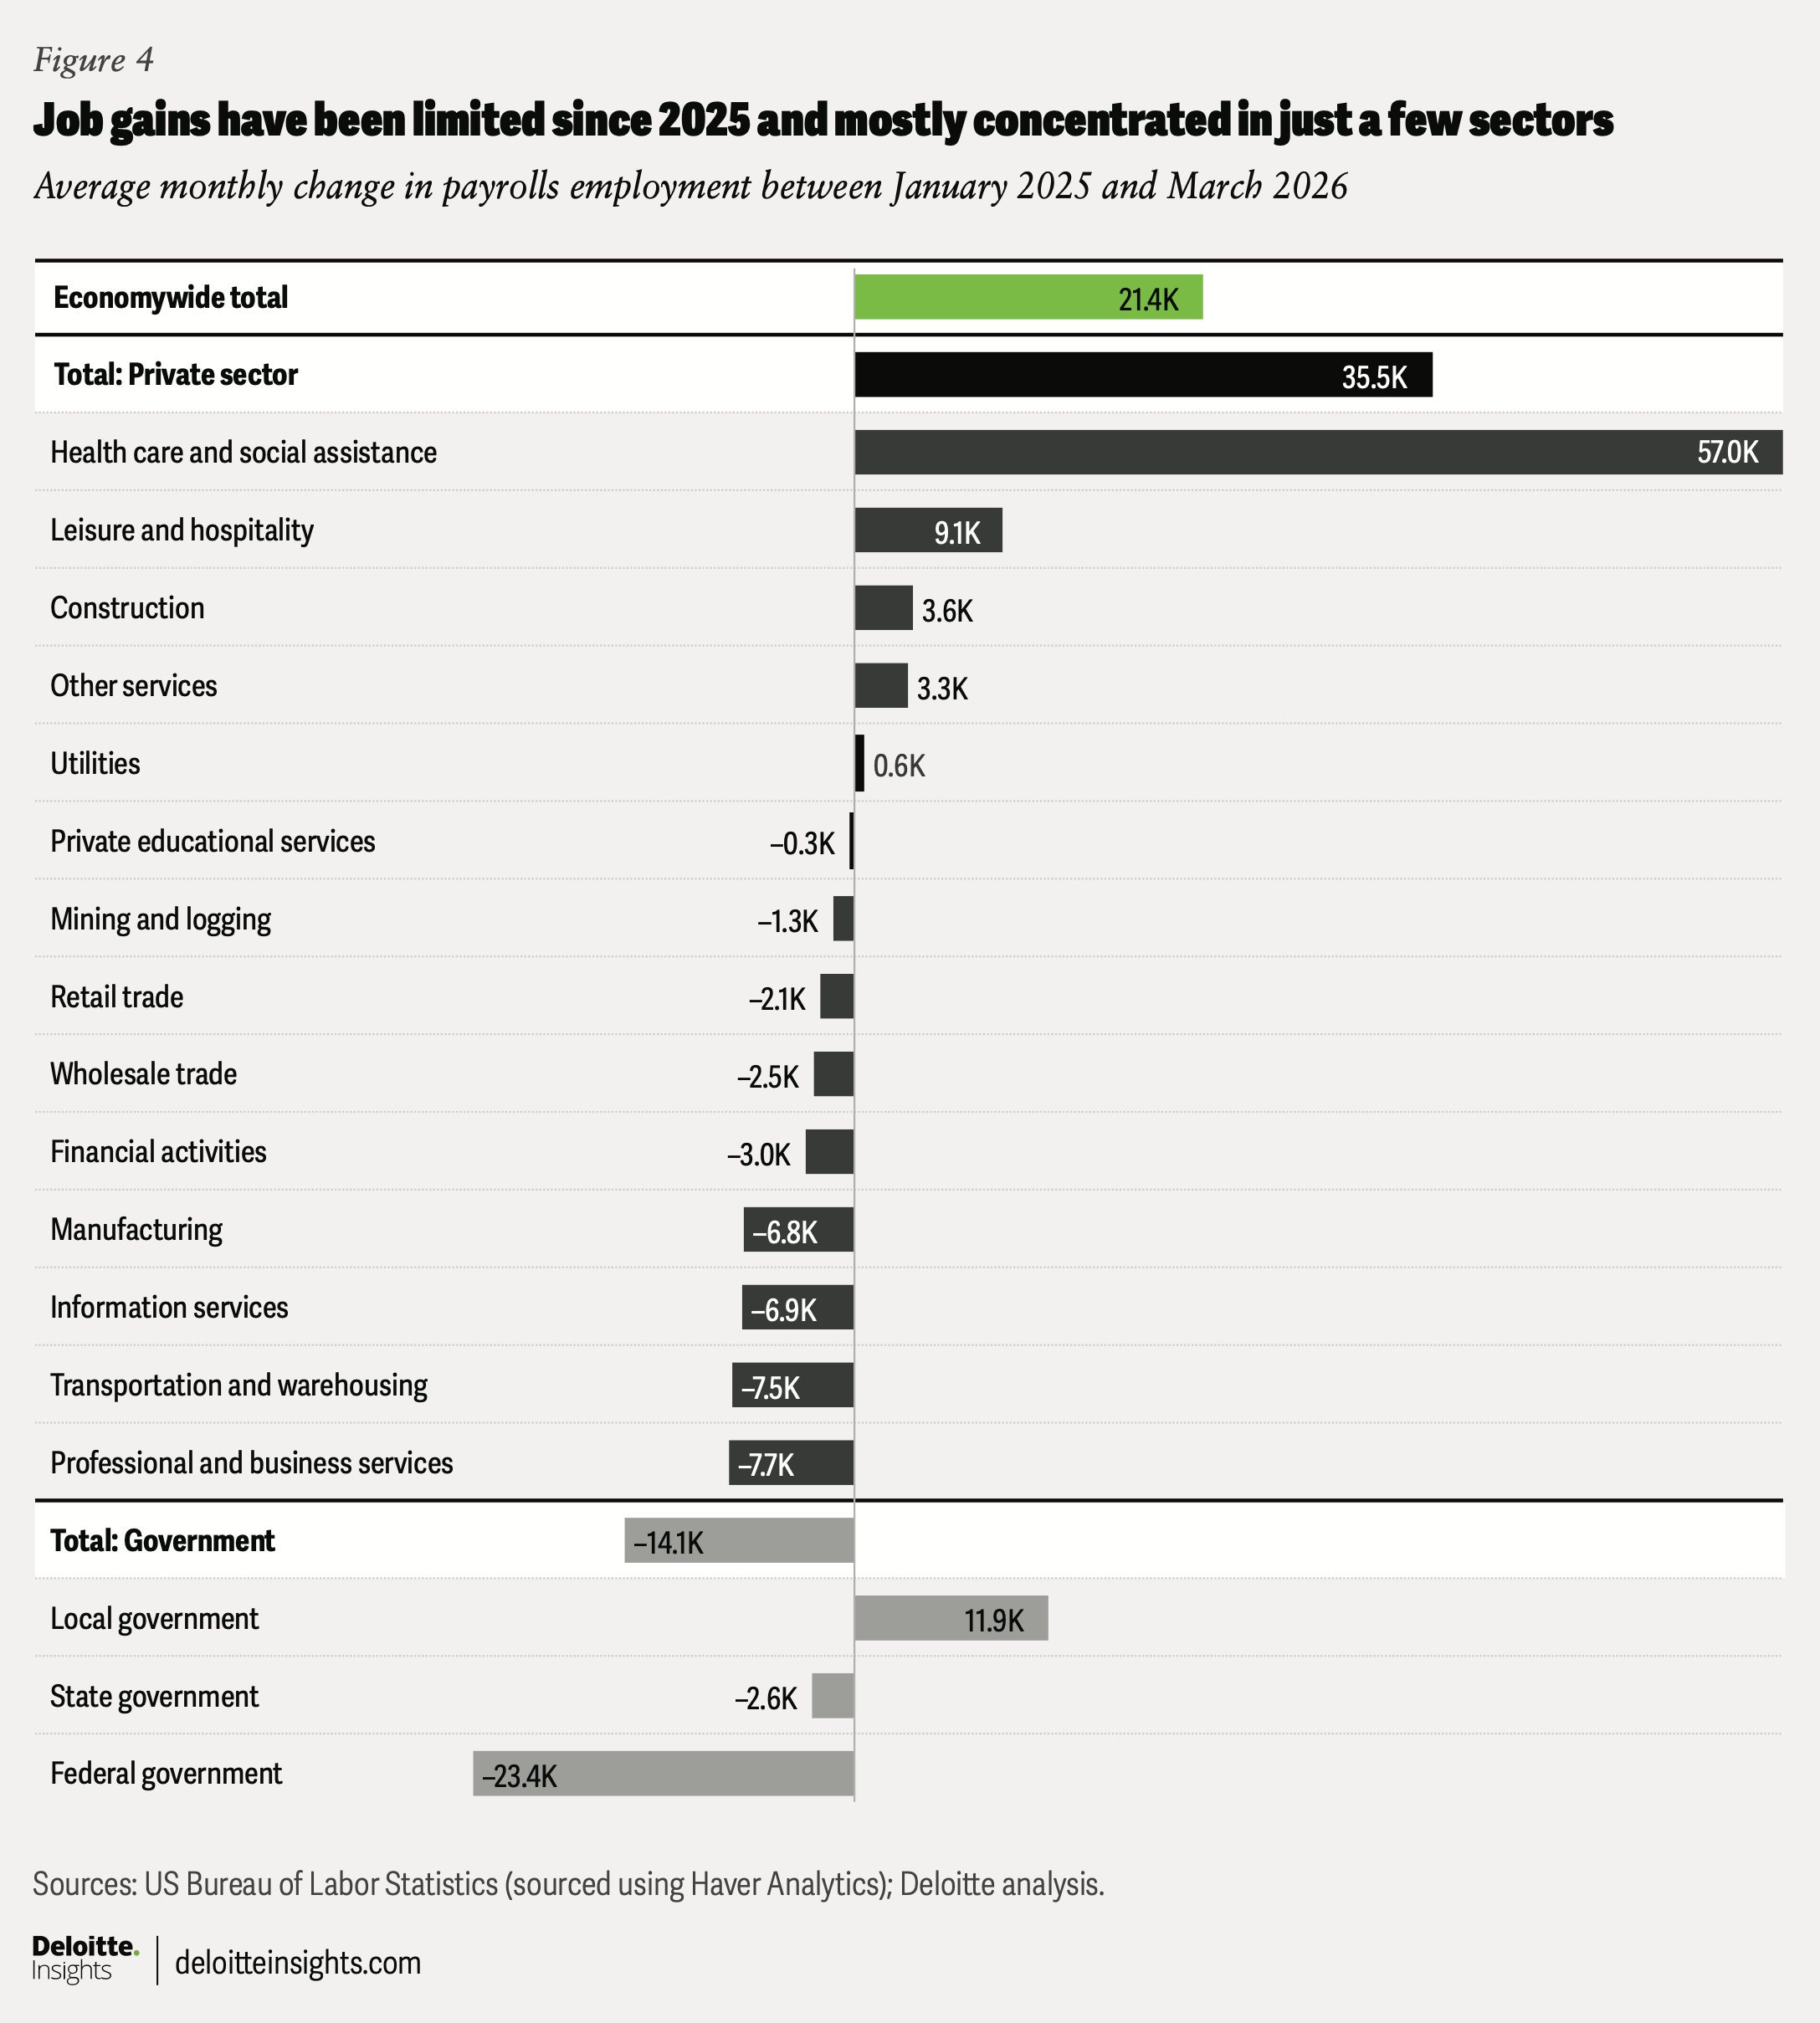
The Establishment Survey by the US Bureau of Labor Statistics shows that nonfarm payrolls have gone up by 321,000 since the end of 2024, with an average monthly growth of just 21,400.28 That’s below the average pace of growth of about 122,000 per month seen in 2024 and 210,000 per month seen in 2023.
Jobs growth hasn’t been uniform. For example, since January 2025, most gains have been in health care and social assistance and, to a lesser extent, in leisure and hospitality. Without these two sectors, payrolls fell during this period, with the sharpest declines seen in federal government, professional and business services, and transportation and warehousing (figure 4).
Despite low payroll growth, the Household Survey by the US Bureau of Labor Statistics shows that unemployment is still relatively low at 4.3% and hasn’t changed much over the past year.29
This is likely due to supply-side factors. Labor-supply growth has slowed since 2024. In fact, the civilian labor force has declined by 0.8% since December 2025. This shows up in the labor-force participation as well, with the rate declining to 61.9% in March—about 1.4 percentage points below pre-pandemic levels. The slowdown in labor supply is likely due to immigration restrictions. According to the US Census Bureau, net international migration fell to 1.3 million in 2025 from 2.7 million in 2024 and is projected to fall further to just 0.3 million in 2026.30
For the US Fed, slowing job growth and labor-supply constraints suggest that easing monetary policy may not necessarily lead to a labor-market uptick. Instead, it may lead to higher labor costs for businesses as they end up competing for a smaller talent pool. Demographic changes will likely add to this concern. Currently, 23% of the US labor force is 55 years of age or older—nearly 10 percentage points higher than in the year 2000.31 This trend is unlikely to change, given an aging population and lower immigration: The US Census Bureau projects that nearly 35% of Americans will be 55 years of age or above by 2050—up from 31% in 2025 and just 21% at the start of the new millennium.32
Mind that balance sheet
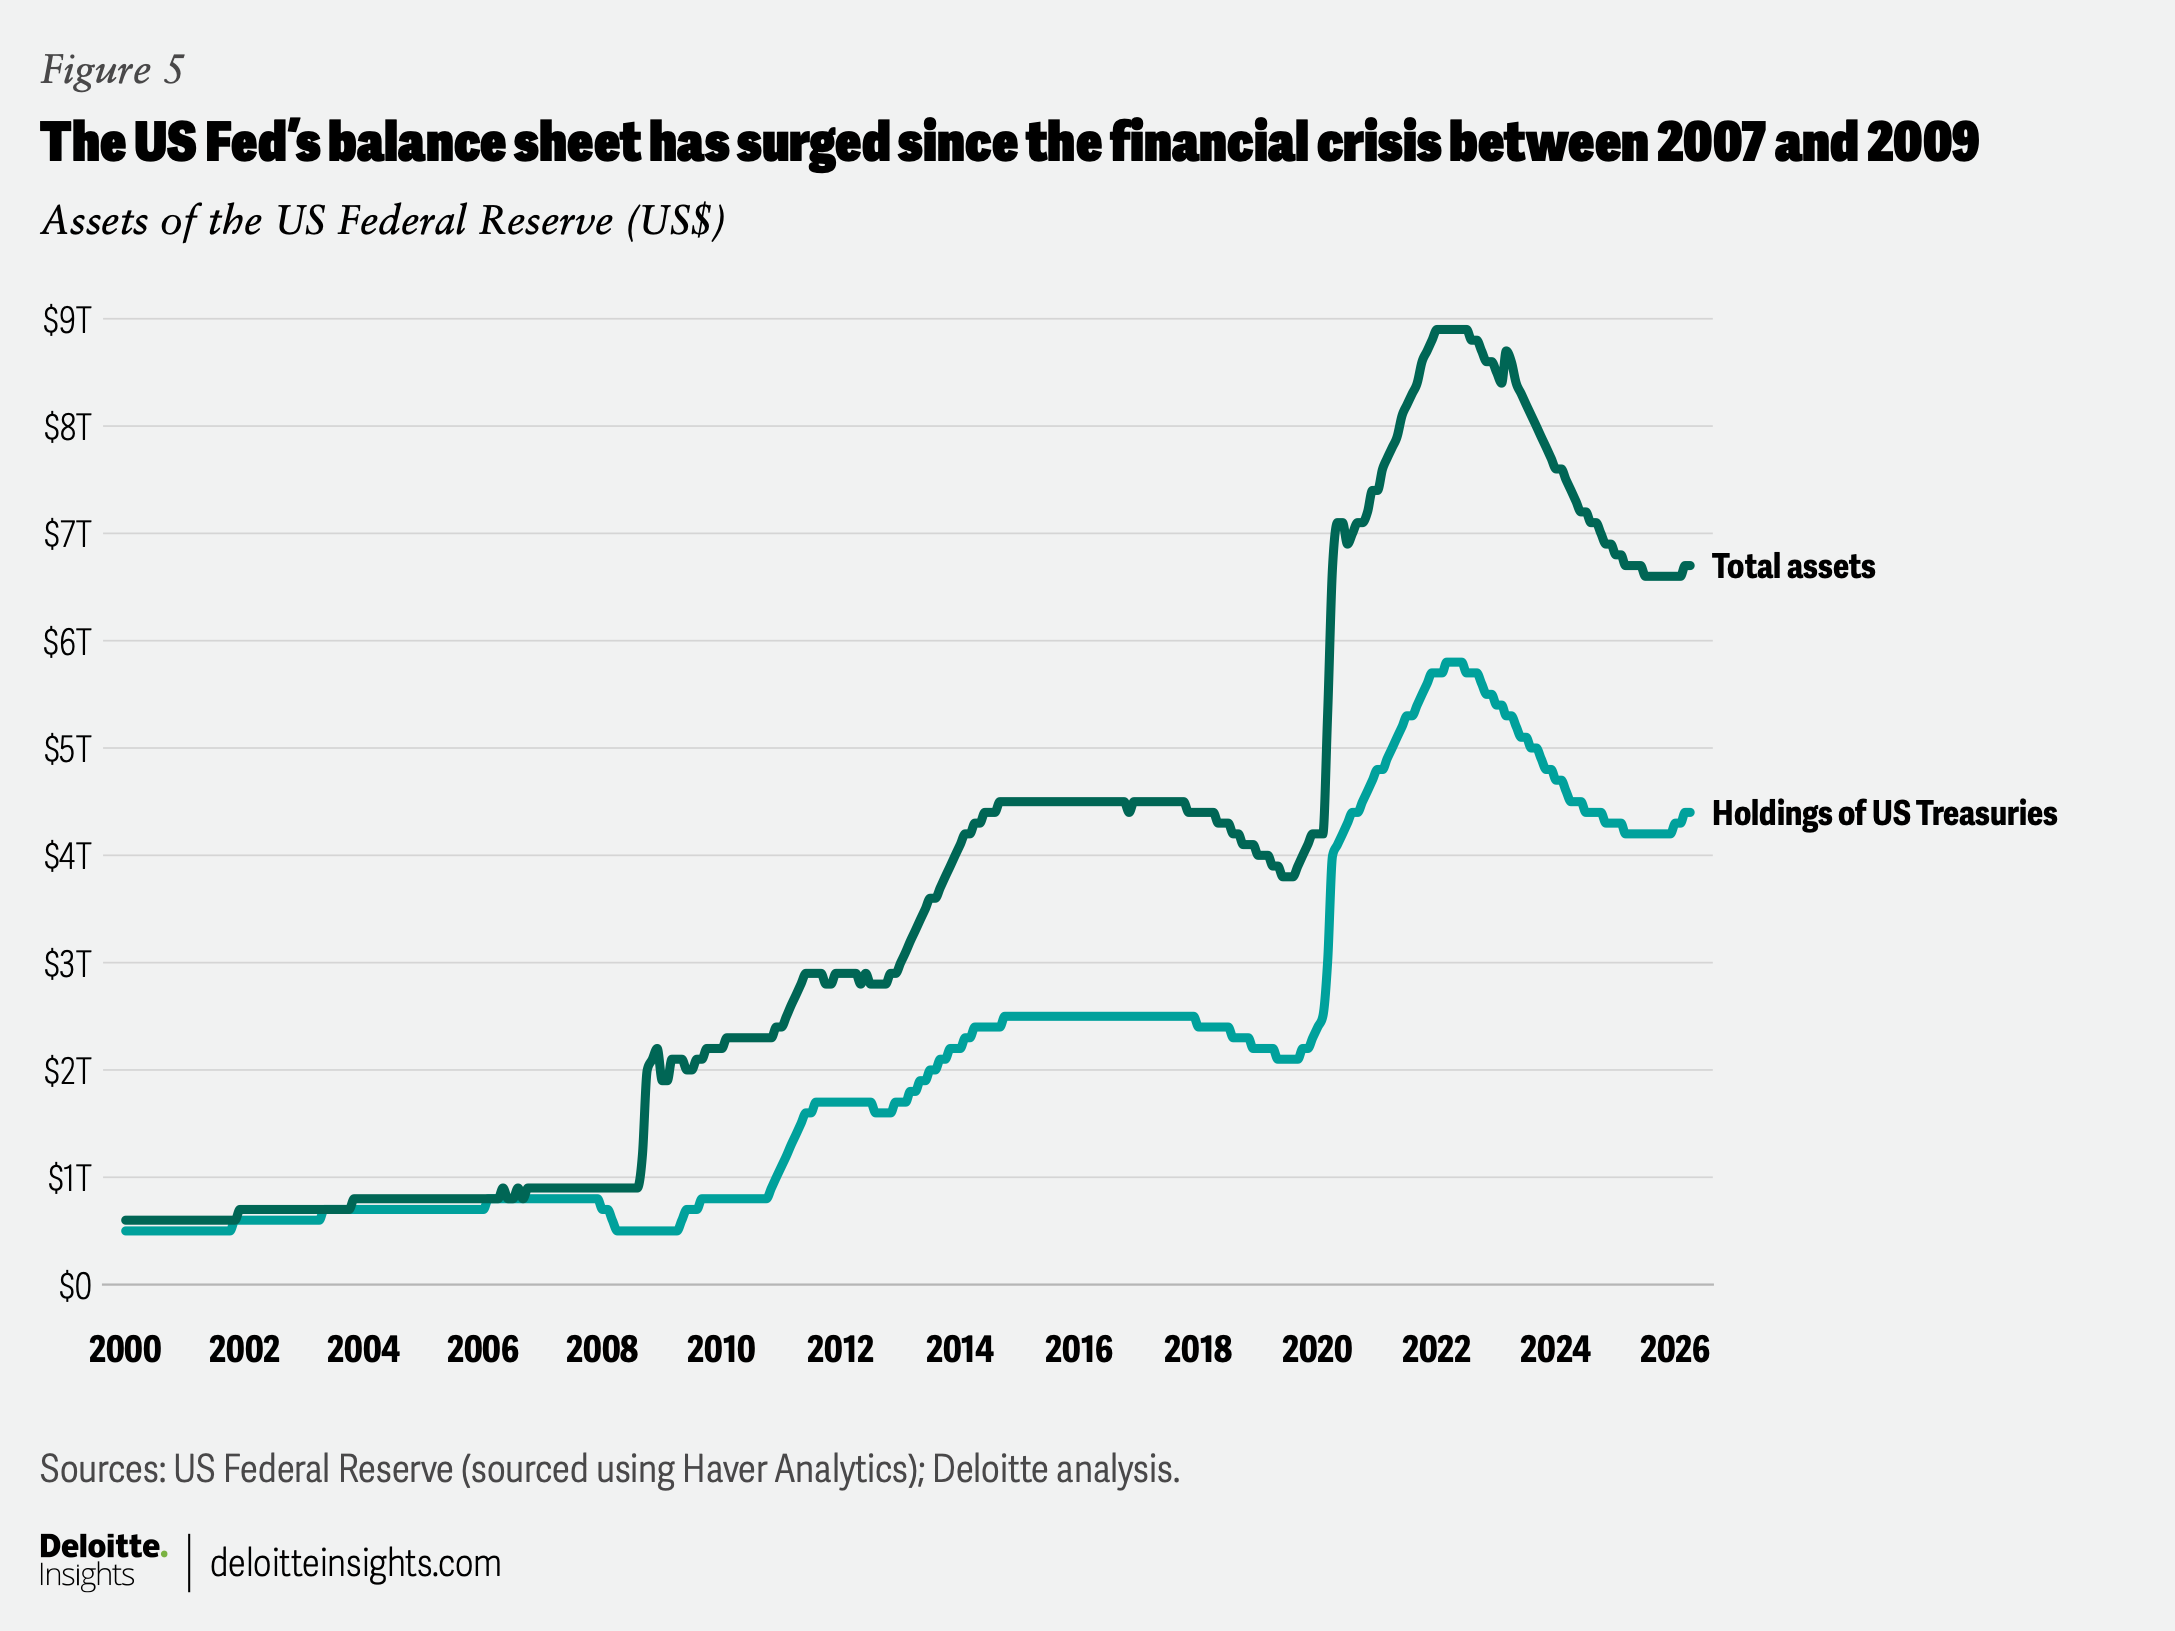
The US Federal Reserve’s balance sheet is nearly eight times what it was 20 years ago, with its holdings of US Treasuries rising about 500% during this period (figure 5).33 Much of that growth happened in two phases (close to the previous two recessions), when the Fed embarked on quantitative easing to help stabilize banking and financial markets. In the first phase (January 2009 to June 2011), Fed holdings of US Treasuries more than tripled due to quantitative easing. The second phase began right after the start of the pandemic and lasted till early 2022. During that time, the Fed’s holdings of US Treasuries rose 125%. While the size of these holdings has declined, at US$4.4 trillion, the Federal Reserve is still the largest domestic holder of marketable US government debt.
One of Kevin Warsh’s stated objectives is to reduce the size of the US Federal Reserve’s balance sheet.34 Theoretically, that makes sense, given that it allows the Federal Reserve more leeway to operate in future crises. It could also increase pressure on the government for fiscal reforms to trim debt and deficit levels, without raising concerns of “fiscal dominance.”35 Yet, a rapid reduction in US Treasury holdings through any quantitative tightening may not be easy.
Any sharp offloading of Treasuries in the market may lead to a rise in yields. With US public debt standing at about US$39 trillion, rising yields may increase the fiscal burden through higher interest payments.36 In 2025, interest payments were the third-highest spending item for the federal government after Social Security and Medicare.37 One only needs to look at the “taper tantrum” of 2013, when a mere mention of cutting down the Fed’s holdings led to an increase of nearly 1 percentage point in the 10-year Treasury yield between May and December of 2013.38
Any rise in longer-duration US Treasury yields could push long-term borrowing costs upward. The 30-year fixed mortgage rate, for example, is influenced as much by 10-year Treasury yields as by monetary policy. Any rise in yields, therefore, could keep mortgage rates elevated, weighing on the housing market. Since the start of the Iran conflict, 10-year Treasury yields have risen by 41 basis points (as of May 4, 2026), with the 30-year mortgage rate following suit and reversing the declines seen between April 2025 and February 2026.39
Rising Treasury yields may also weigh on business investment, especially AI-related tech investments. In the first quarter of 2026, business investment in software rose at a seasonally adjusted annual rate of 184%, while investment in information processing equipment surged 43%.40 These two categories have been a key driver of overall business investment and wider economic growth since 2025. Rising borrowing costs, therefore, may make new debt-driven investments costlier, potentially prompting companies to slow down and investors to reassess risks and returns in tech stocks. In the latest US economic forecast, Deloitte economists estimate that, in a downside risk scenario, any correction of the AI bubble will send the economy into a recession, albeit a milder one than the previous two.41
Too early to bank on AI-related productivity gains
One of the key elements of Kevin Warsh’s testimony to the Senate Banking Committee in April was the role of productivity gains through rapid development and deployment of new AI-related technology. Productivity may aid the US Fed’s twin goals in two ways.
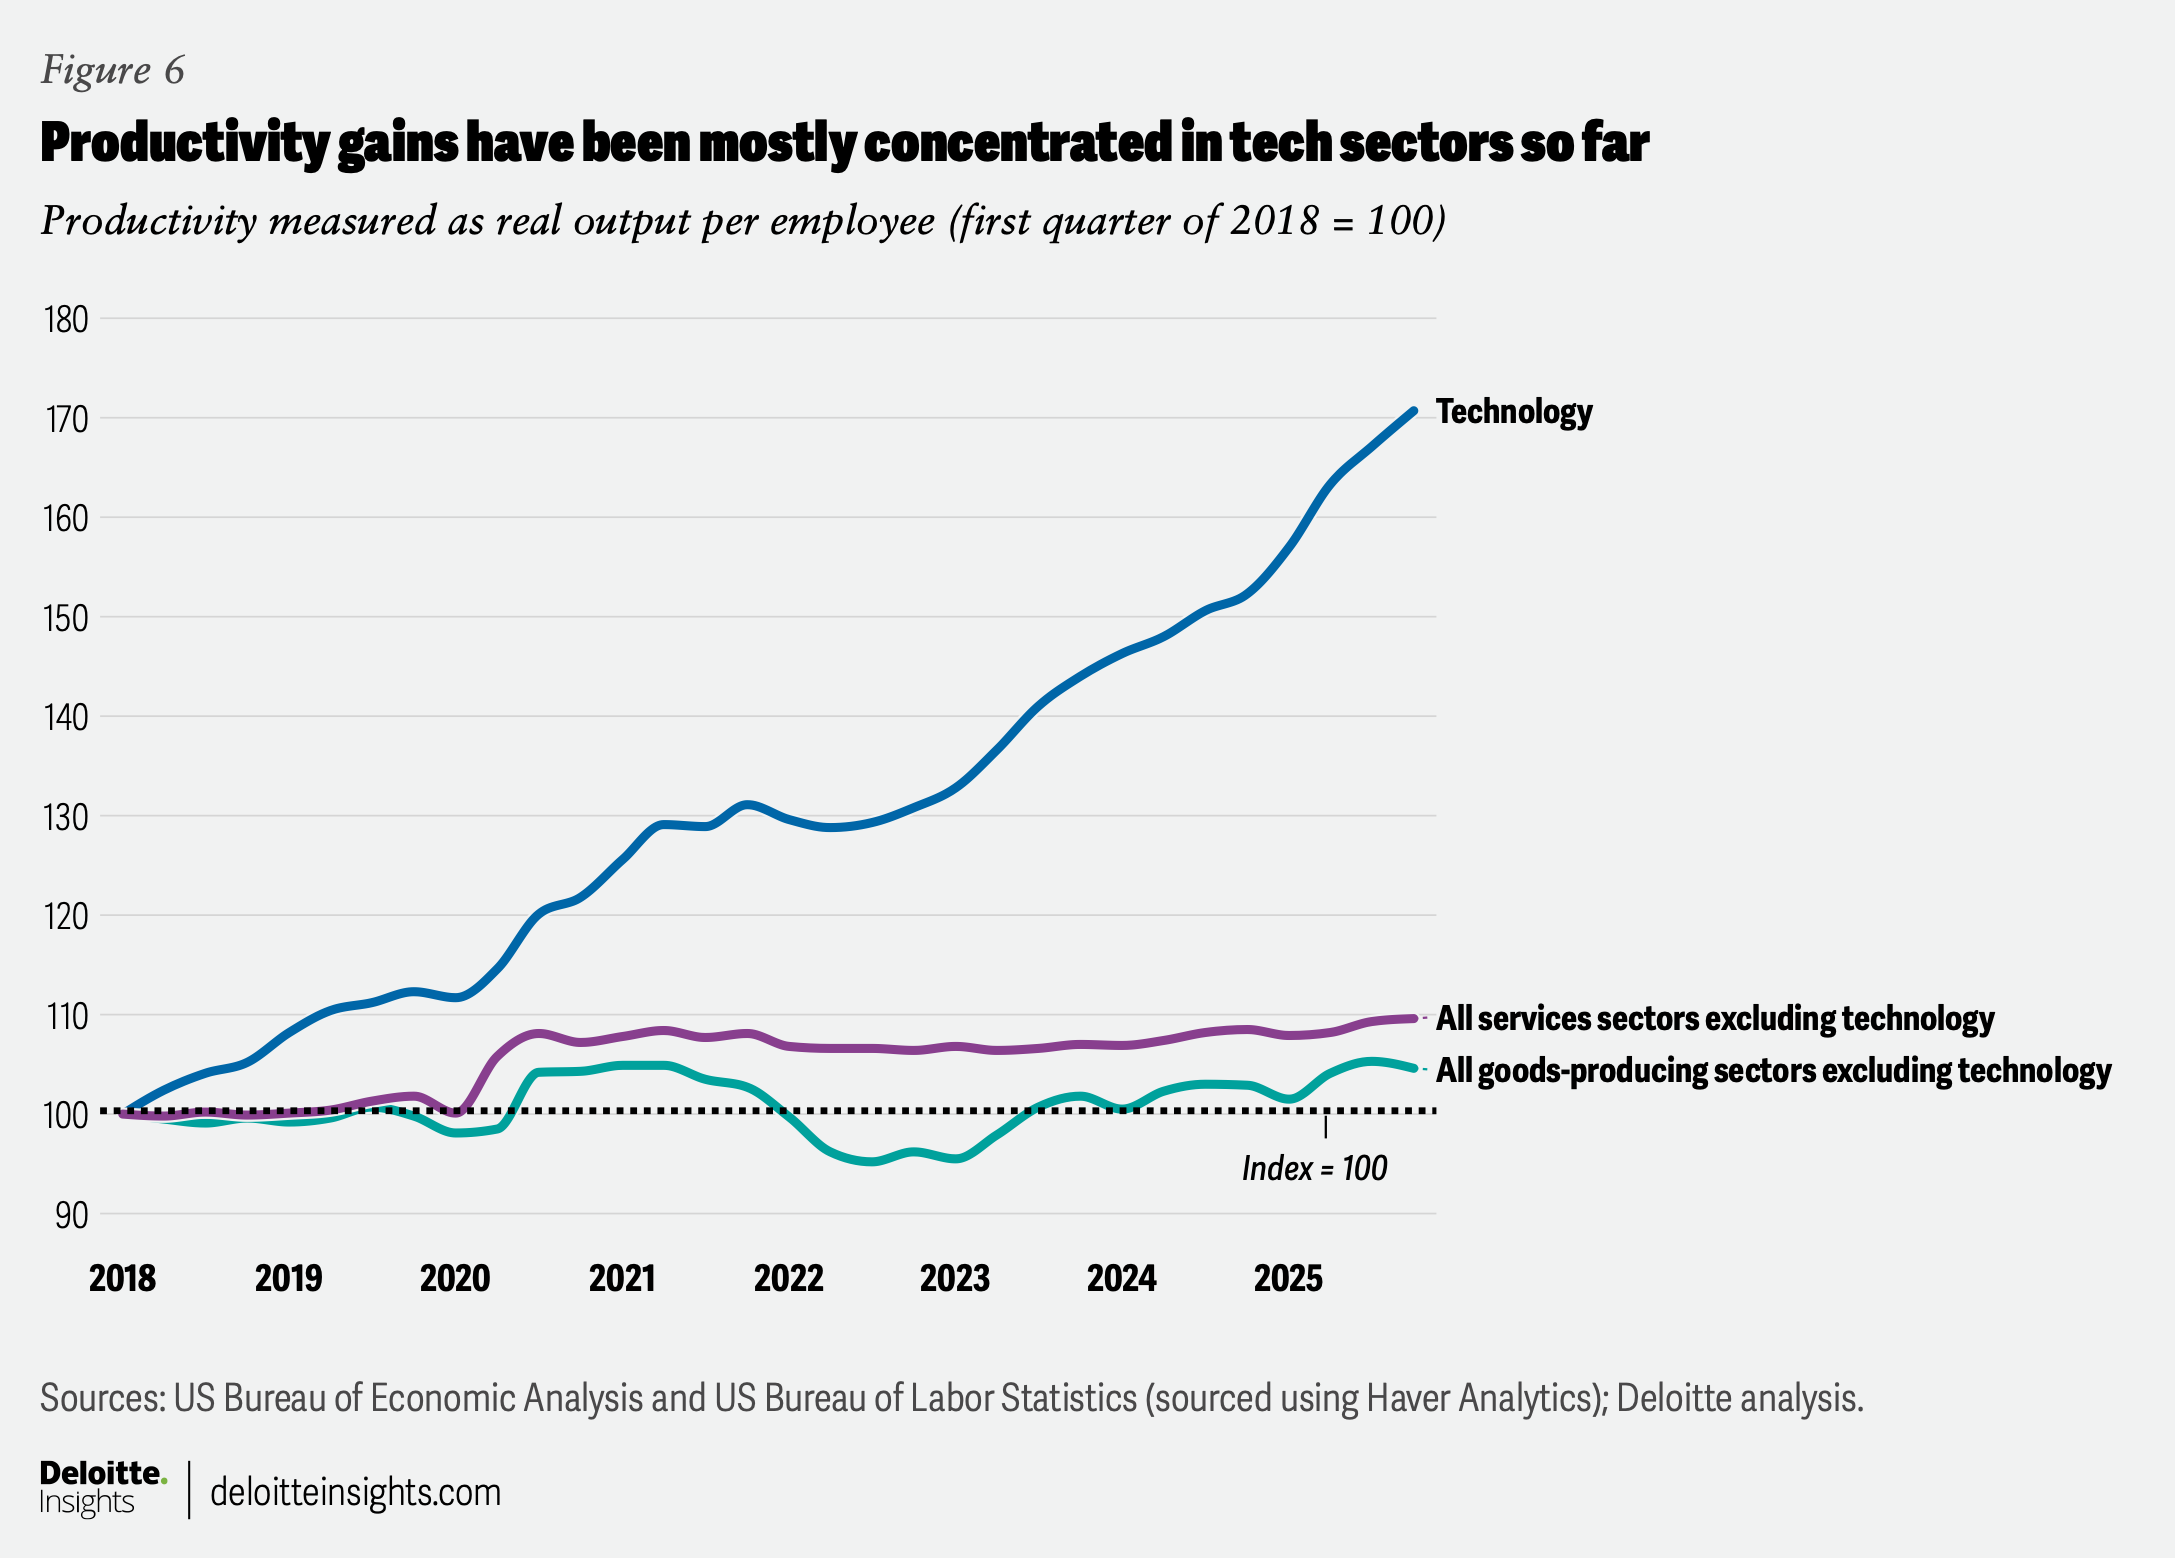
First, it could keep inflation in check by lowering the cost of production. And it could support output gains even with a potentially smaller and aging labor force. Yet, for that to happen, productivity growth would likely need to be broad-based, so that not only a few sectors but the entire economy gains from it (albeit with some variations). Till now, most of the productivity gains have only been felt in tech sectors (figure 6).42 And even in tech, gains have stemmed from higher output even as employment fell between late 2022 and 2025.43
Second, any productivity gains would need to percolate down to cost of production, which, in turn, will likely keep consumer inflation low. Trends in producer prices and employment costs, however, do not indicate any major impact of productivity gains so far.44 And if AI-led productivity growth also boosts aggregate demand through higher investment and stronger consumer spending (due to rising asset prices), then it may offset gains from production costs.45
It will likely take time for productivity growth from AI-related investment to get entrenched in the economy and hence, have a tangible impact on monetary policy. Till then, and at least in the near term, all eyes may solely be on inflation and job growth in the economy.
by
Akrur Barua
The author would like to acknowledge Dr. Ira Kalish, Deloitte's chief Global and US economist, for his reviews, and Rohini Sanyal from the Economics team for her Insights and contributions for this piece.
Editorial (including production and copyediting): Arpan Saha, Preetha Devan, and Pubali Dey
Design: Harry Wedel
Audience development: Pooja Boopathy
Cover image by: Harry Wedel
Knowledge services: Rishitha Bichapogu
Visit the Deloitte Global Economics Research Center
Access more insights for the consumer spending, housing, business investment, globalization & international trade, fiscal & monetary policy, sustainability, equity, & climate, labor markets and prices & inflation sectors.