
High-value grocery stores top shoppers’ lists
Be it through private labels or produce selection, grocery brands that provide more value for the price register with consumers
The grocery business has never been easy. Growing store-brand popularity and retail media revenue are bright spots,1 but rising food costs, changes to nutrition support programs, and reduced spending linked to smaller GLP-1 appetites are adding pressure.2 Overall unit volumes have recently slipped.3
But there is also a broader factor appearing to affect the entire consumer landscape: Many shoppers no longer feel they’re getting good value at fair prices.4
That view took hold during peak inflation in 2022, eroding consumer perception of both price and value,5 and it has persisted even as inflation has eased.6 What’s emerged is a value-seeking mindset.
Deloitte’s ongoing ConsumerSignals survey finds that about four in 10 US consumers are now value seekers, including 23% of households earning more than US$200,000.7 And most surveyed consumer products and retail executives say value seeking is a structural shift, not a passing trend.8
In this environment, which grocery brands can win on value? And how do you measure value to begin with?
We created a framework designed to untangle consumer value from price perceptions and assess each brand in the context of its competitive market. The framework generates a new value score, measured relative to market expectations, and provides a level playing field for comparison at different price points (see methodology).
Using our framework, about one in three grocery brands earn “more-value-for-the-price,” or “MVP,” status.9 Brands that do well on this value metric are pulling ahead in sales growth and household penetration, with consumers saying they plan to buy from MVP grocery brands more often.10
The MVP framework: Assessing value apart from price
Measuring brand value can be tricky:
- Brand value perceptions live in consumers’ heads, so surveys are important for capturing their sentiment.
- Consumers conflate value and price. If you ask about what they get (value), their answer is influenced by what they give (price).11
- Value is relative. A value score for a single brand, outside the full-detail context of the competition, isn’t very useful.
The MVP framework can help address these challenges. It uses consumer survey data from multiple brands to create a broad competitive set, generates a regression line representing the market’s price-value trade-off expectation, and untangles price’s influence by reassessing raw value scores relative to that expectation. Simply put, the more-value-for-the-price brands (MVPs) are those that beat expectations by plotting above the regression line.
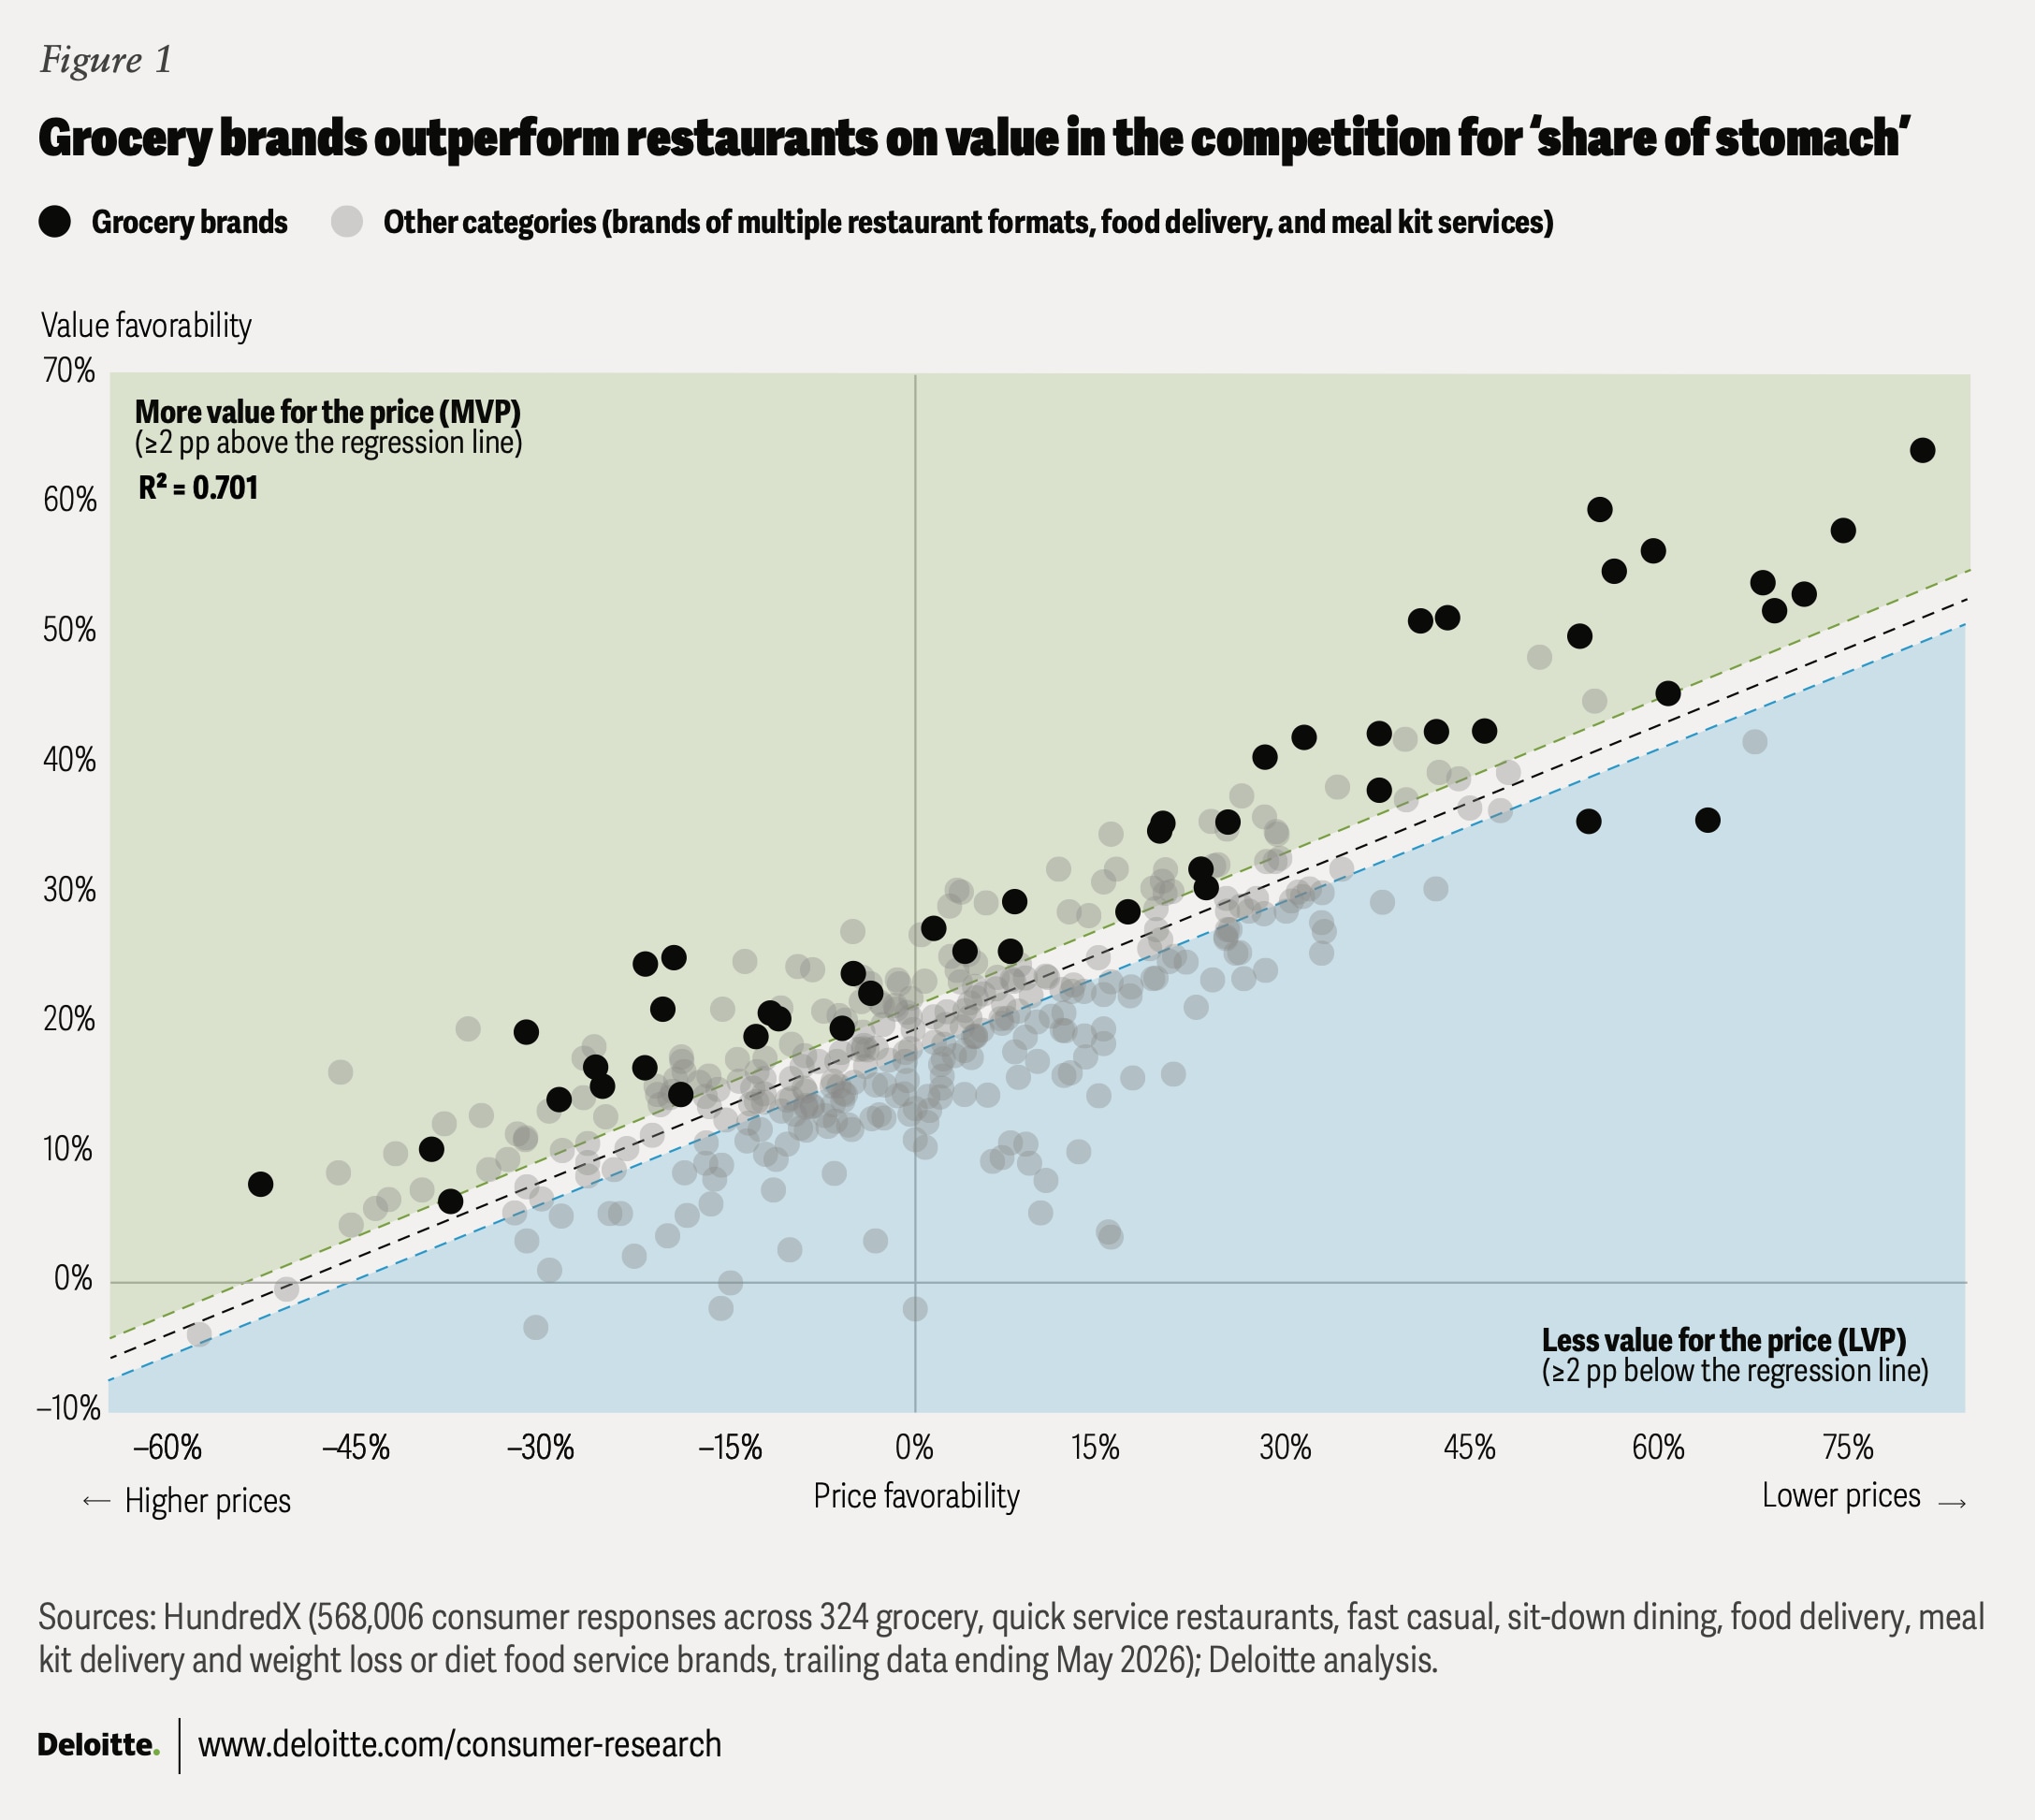
To see how this works, consider an entire “share of stomach” view of value that includes both grocery brands and restaurants (figure 1). Dots on the left tend to be premium-priced brands, and dots on the right tend to be low-priced brands. Within the set, 48 of these dots are grocery brands (colored black), most of which would be considered MVPs on a full share-of-stomach basis because they plot above the regression line. This measurement suggests that consumers generally see grocers as offering more value for the price than restaurants.12
Simply put, the more-value-for-the-price brands (MVPs) are those that beat expectations by plotting above the regression line.
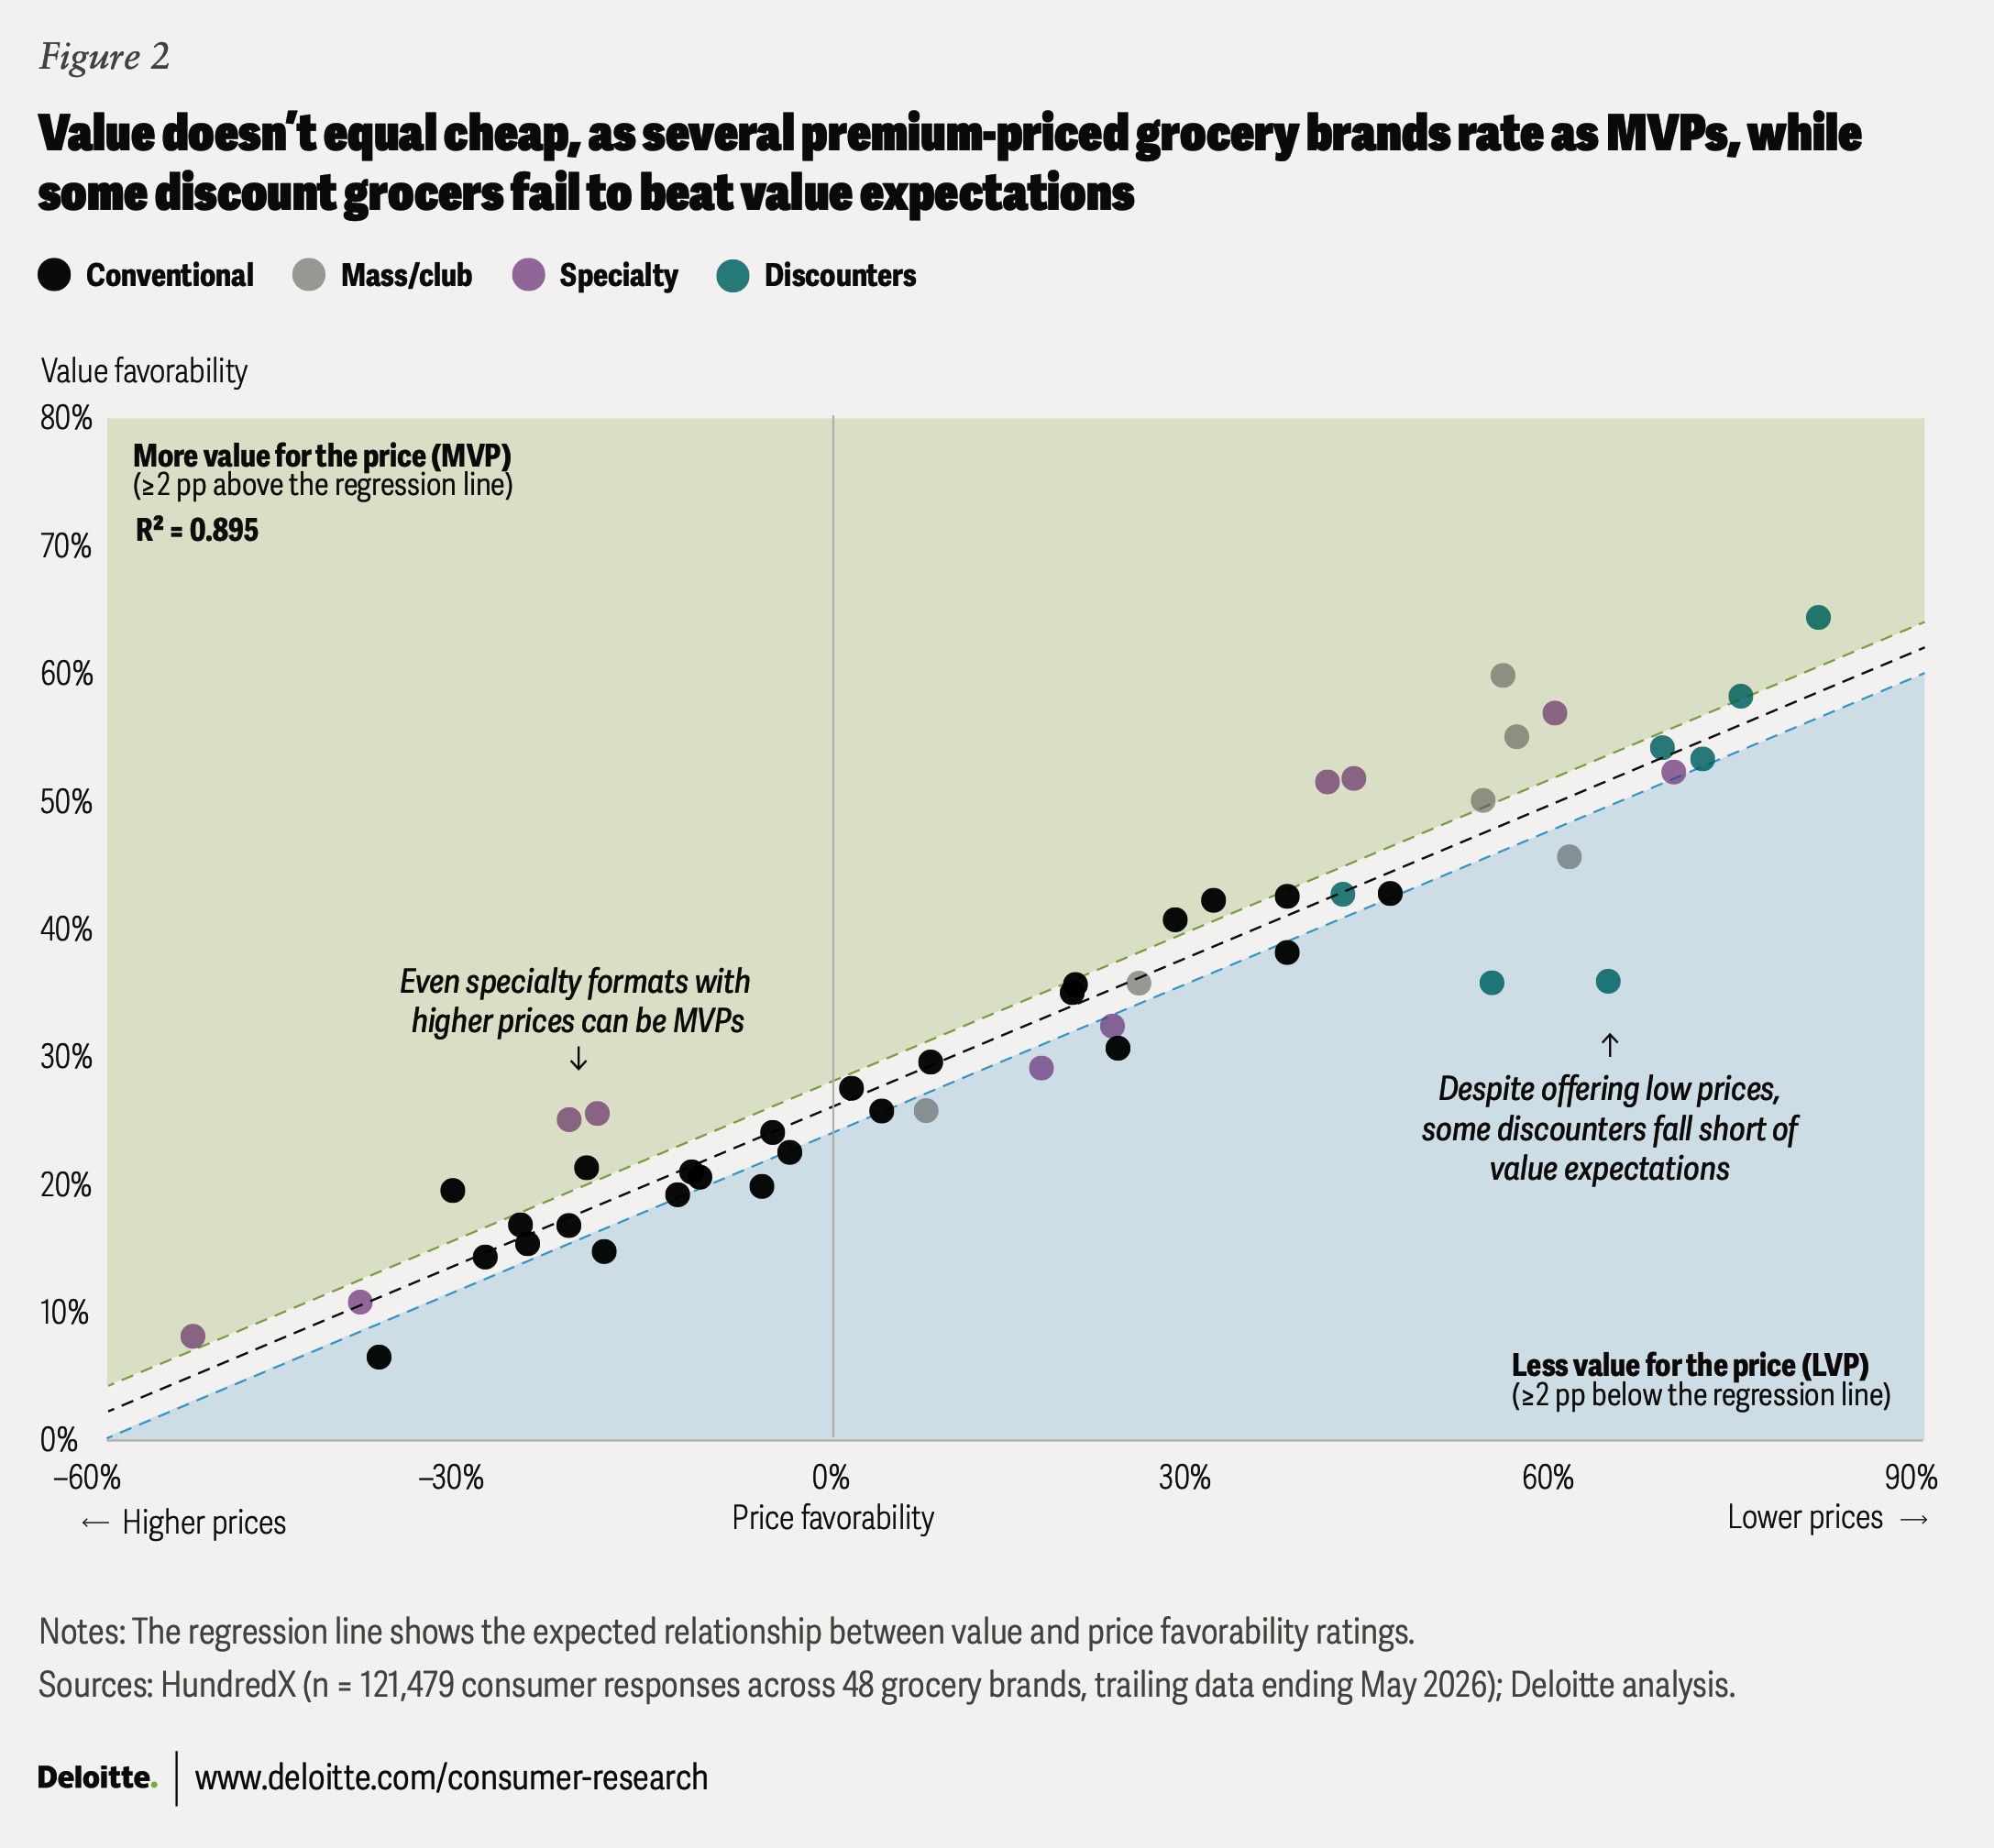
But grocery stores also compete directly with one another to win consumers. Focusing our analysis on only the 48 grocery brands produces a new MVP framework chart with a new regression line (figure 2). In this assessment, only about one in three grocery brands float above the regression line and achieve MVP status.
Assessing grocers by store format reinforces a key point: Value doesn’t equal cheap. While some discounter brands cluster on the right and have high absolute-value scores, many fail to achieve MVP status. Conversely, several premium and specialty-format store brands have low absolute-value scores yet achieve MVP status despite higher prices.
Grocery MVPs bag the competition
Providing more value for the price appears to be associated with stronger performance for grocery brands. We compared MVP brands with their less-value-for-the-price (LVP) counterparts in terms of performance from fiscal year 2024 through fiscal year 2026, using credit card transaction data from approximately 20 million consumers. MVP grocers recorded 13.9% spending growth compared with 3.9% for LVP grocers (figure 3).
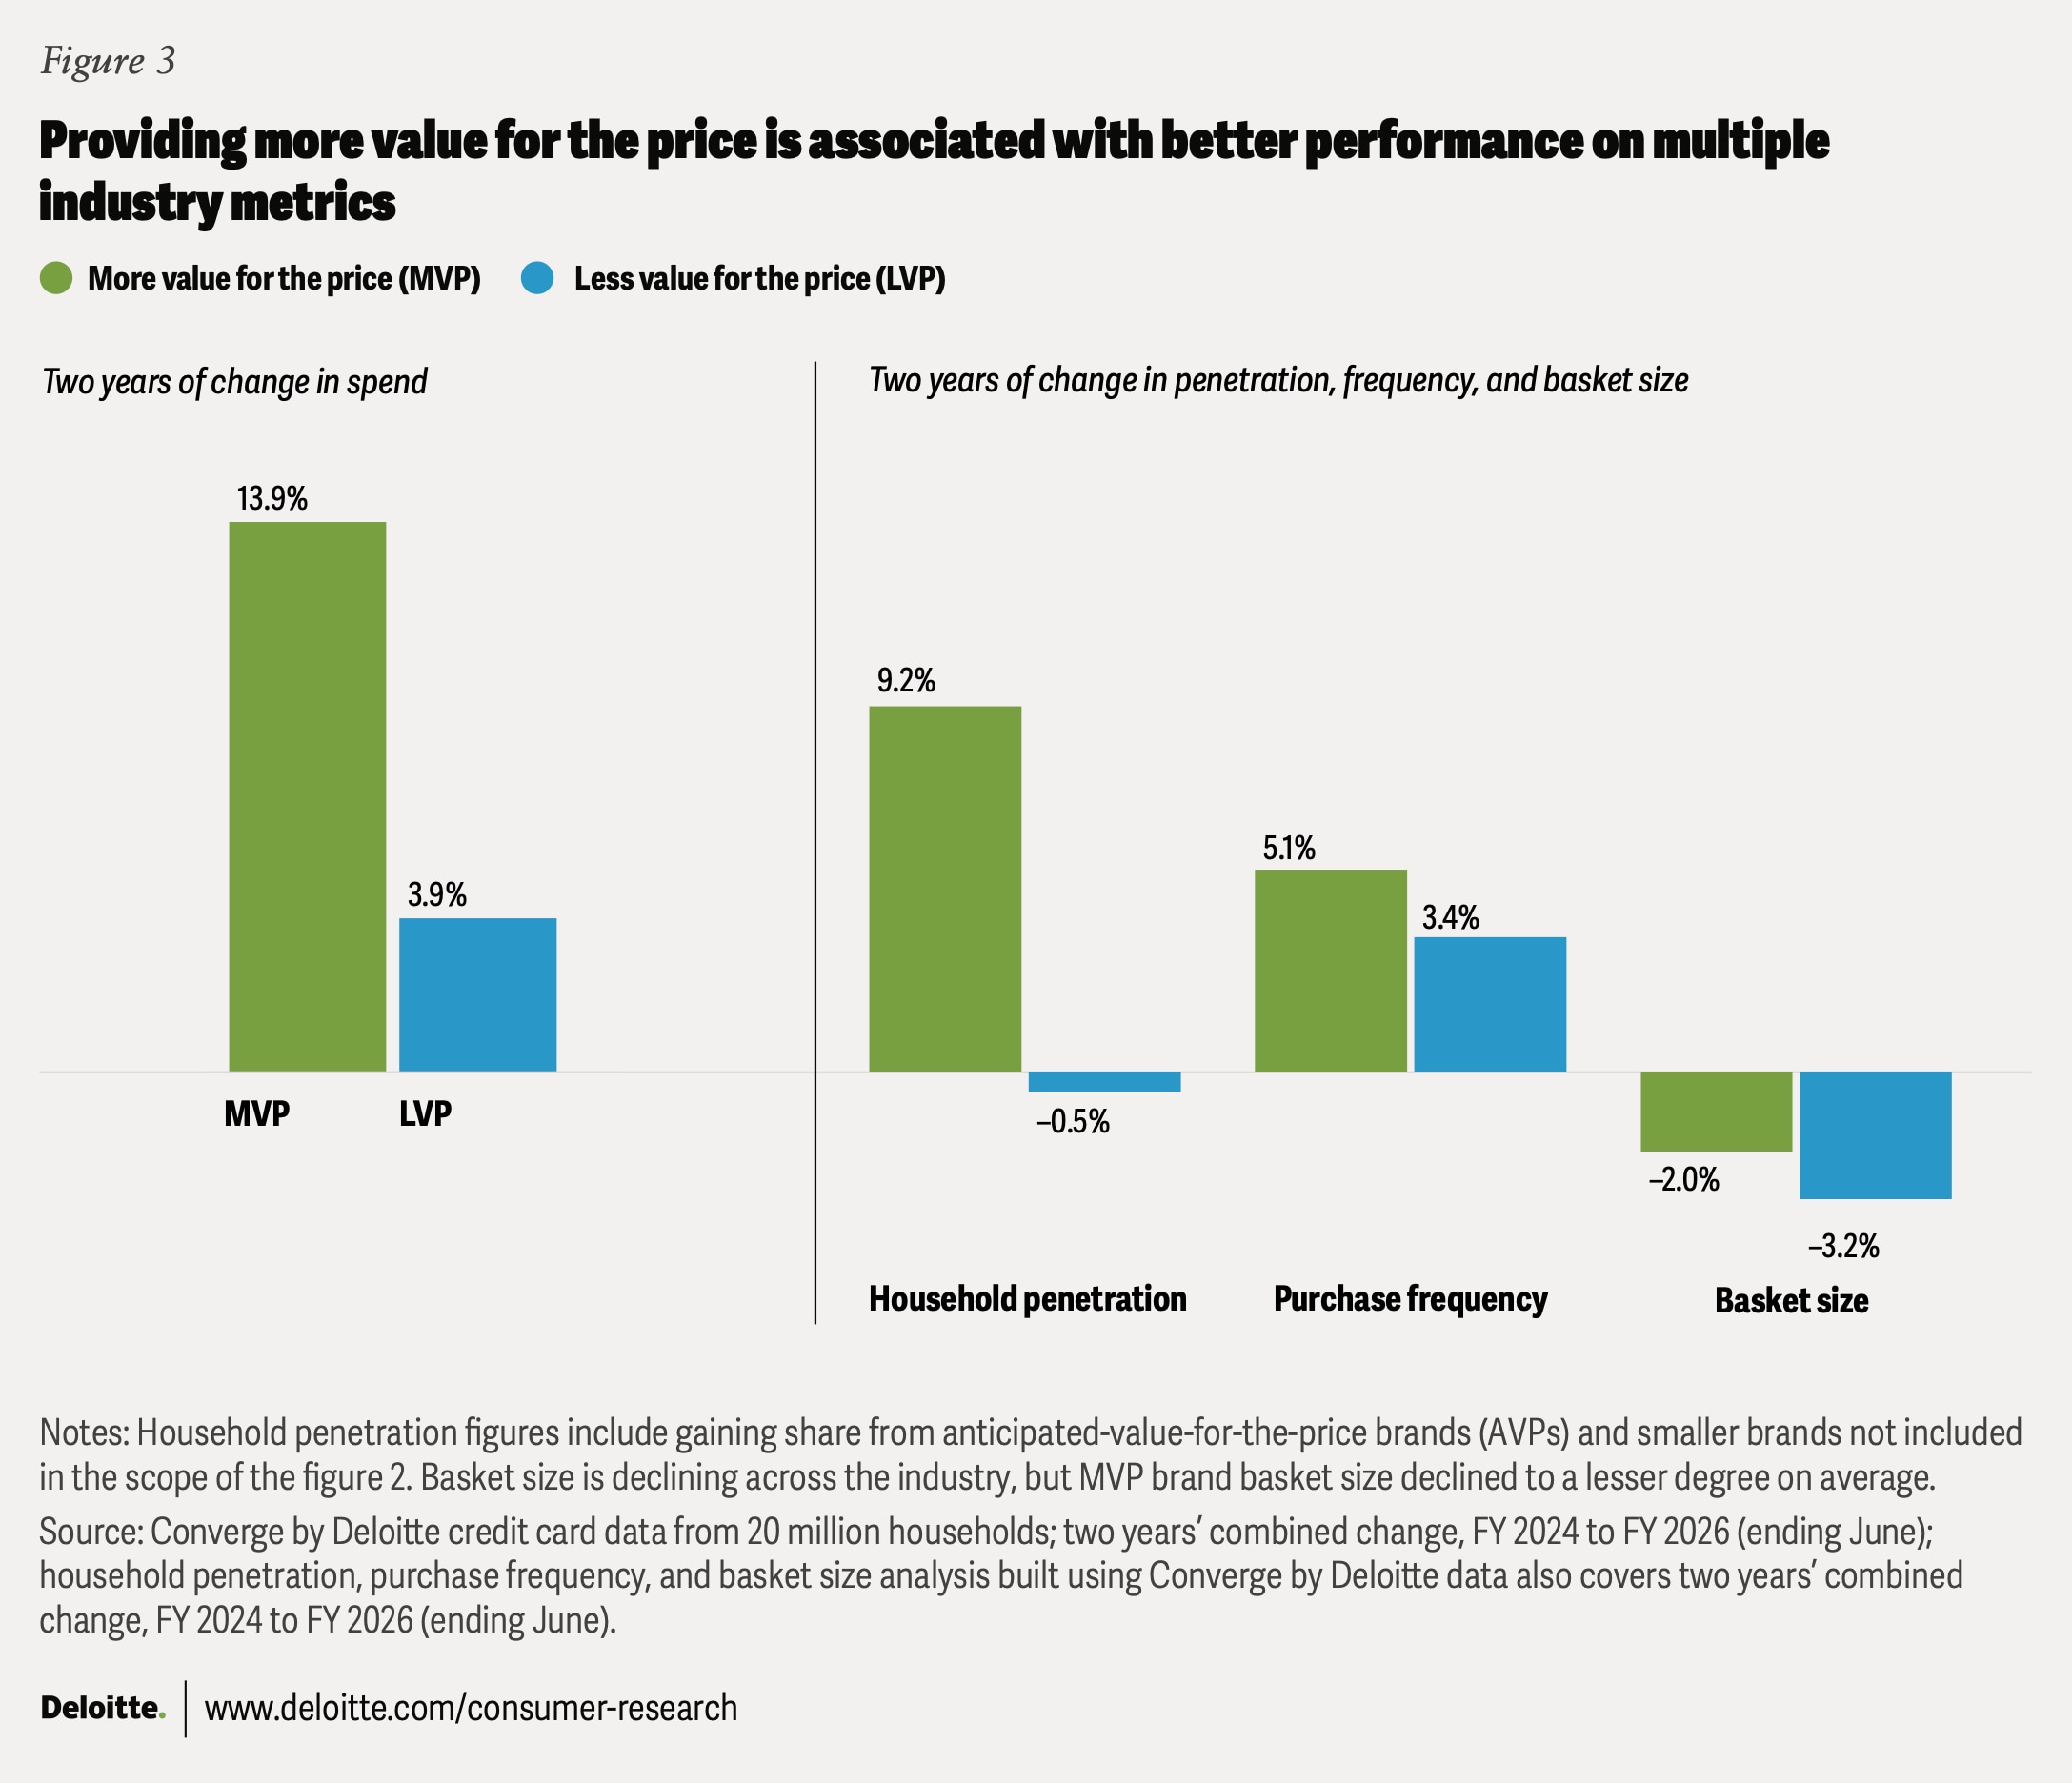
Figure 3 also shows MVP advantages in household penetration and purchase frequency. Basket size declined overall, but less so for MVP brands.
Forward-looking data points to more MVP wins. Over 36 consecutive months of surveys, more consumers, with 9 percentage points (pp) more on average, said they planned to purchase more often from MVP grocery brands than LVP brands in the coming year. MVP grocers also posted better net promoter scores, with consumers surveyed over the same period more likely to recommend MVPs (34 pp more) than LVPs.
What do grocery shoppers value beyond price?
It’s one thing to know how a brand scores on the MVP framework, and another to know how to identify opportunities to improve its value perception. To explore factors that influence those perceptions, consumers of both MVP and LVP brands were asked which non-price drivers most shape their grocery store choices (figure 4).
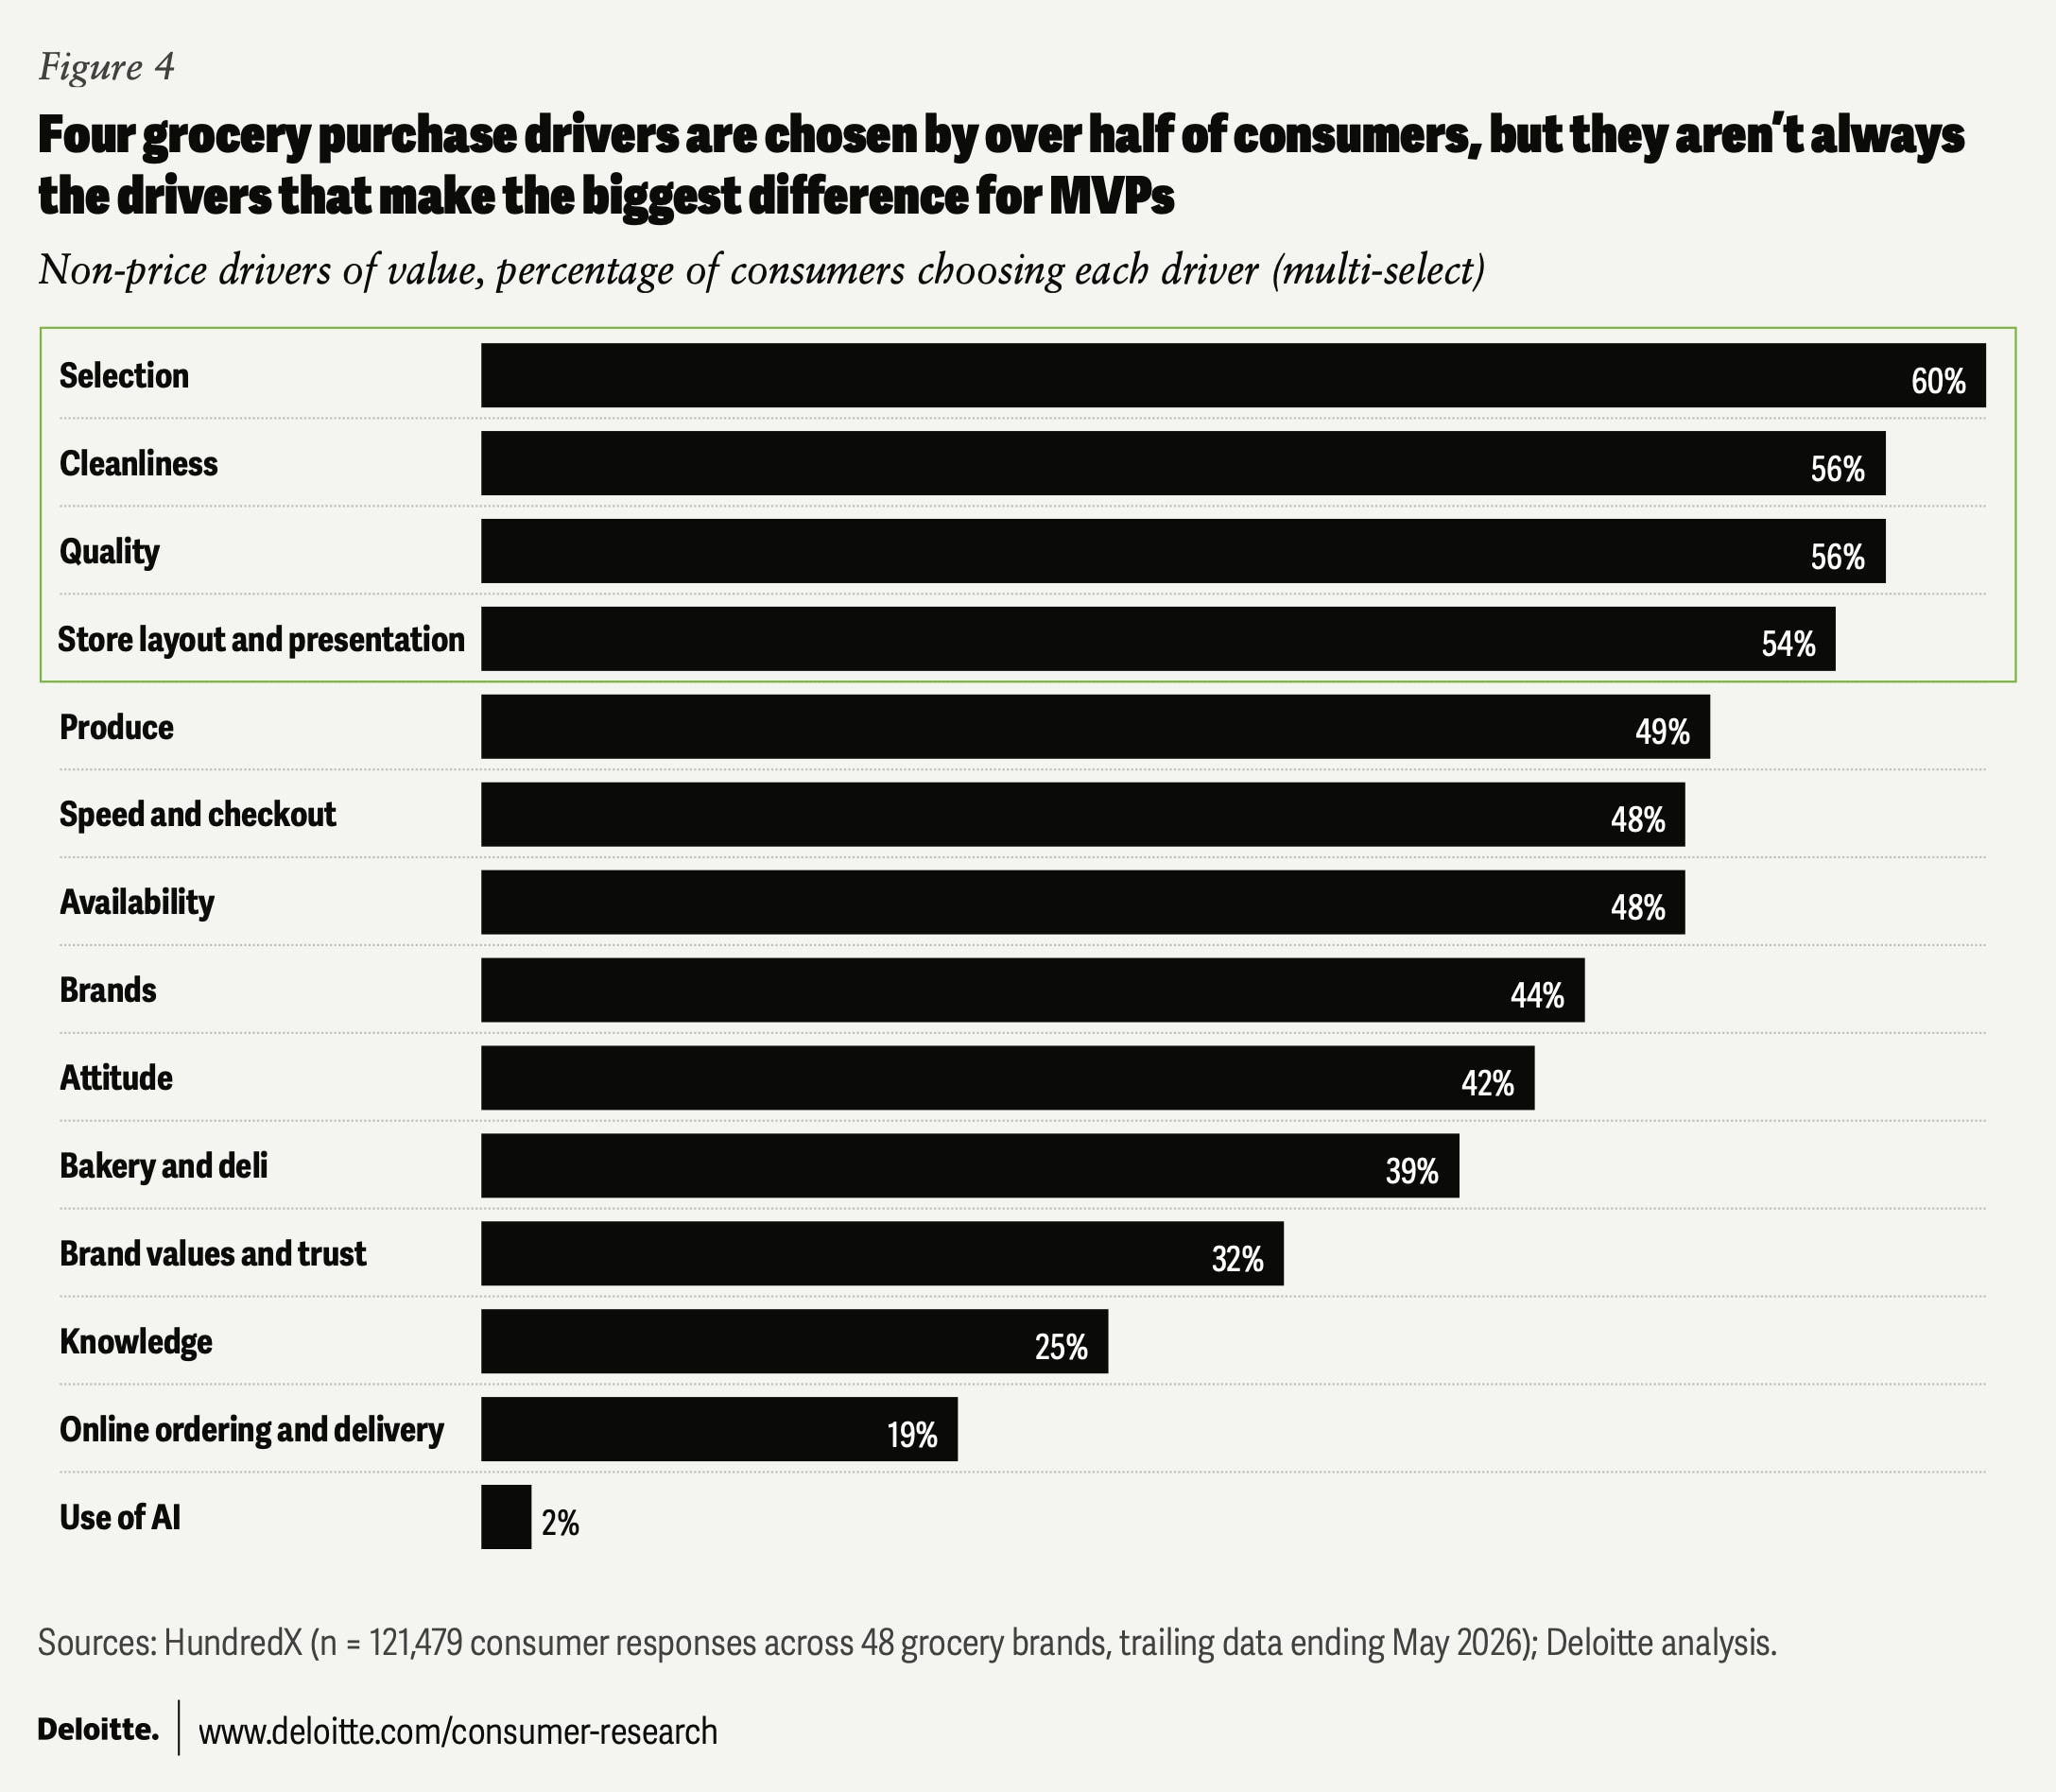
Four attributes were chosen by more than half of the respondents: selection, cleanliness, quality, and store layout and presentation. But selection frequency alone, for instance, doesn’t necessarily make a driver a competitive differentiator. And sometimes the “why” of a differentiator doesn’t come through until we dig into the sub-drivers beneath each.
How MVPs stand apart
Earlier work across consumer sectors, from alcohol to apparel to autos, found that MVP brands consistently score higher relative to LVPs on both quality and trust.13 Grocery MVPs follow the same pattern.
That’s also true when measured at the sub-driver level for quality or brand values and trust. When digging into the reasons behind superior ratings, MVP grocery brands’ quality ranking points to consistency and reliability, good products, customer service, and higher quality relative to alternatives.14 When it comes to trust, these brands outperform in factors such as stock consistency and good intentions, as reflected in how they treat customers and employees.15
Several factors unique to the grocery business also play a role in MVP success.
- Seasonal and private-label selections: A 14-point advantage for seasonal offerings and an 8-point lead for private-label offerings suggest MVP grocers may benefit from execution on occasion-driven shopping and strategically use store brands to get consumers in the door.16
- Clean aisles: MVP grocers shine for cleanliness, especially in the main shopping area and the produce department.17
- Freshness and taste: Produce and bakery and deli departments are differentiators for MVP grocers, with consumers specifically referencing better freshness, organic options, and taste. MVPs are preferred although LVPs have better department-specific price ratings.18
- Friendly associates: Consumers select attitude as a purchase driver for MVPs much more often than for LVP peers (with a 25 point gap). Sub-driver ratings highlight store associates’ consistent effectiveness and helpful expertise, in addition to being friendlier.19
There’s another strategic difference in the one area where LVPs lead: technology-driven service. Consumers rate LVP grocery brands higher in self-checkout, online ordering, curbside, and delivery.20 That doesn’t necessarily mean their technology is better. It may simply mean their technology is more visible.
By contrast, purchase driver ratings of MVP grocers suggest an emphasis on human connection and efficiency rather than on the technology itself. MVPs dominate assessments of cashier ring-up times and customer wait times,21 as well as store layout and checkout flows.22
For MVP grocers, technology is likely working behind the scenes to enable everyday grocery employees to maintain higher customer trust, but without compromising the added value of human interactions.
Strategies to consider: How to be a grocery MVP
As our framework has shown, winning on value is not the same as winning on price. To assess your brand’s current MVP ranking, survey consumers about your brand as well as those from the full competitive set, or use our third-party data to create a custom price-value plot and regression line. Then use those results to identify specific actions, especially those that work best in the hyper-local context of the grocery business, which can give you an MVP advantage over competitors. These actions fall into two categories: value-aware pricing and cost-aware value.
Value-aware pricing
Traditional price optimization considers near-term volume and margin implications. That’s often too narrow. Add perceived value to the equation.
- Focus revenue growth management on longer-term results. Overoptimizing return on investment for short-term benefits can come at the expense of future value perceptions.
- Evaluate promotions’ impact beyond immediate sales. Determine how today’s promotions may enhance or erode tomorrow’s perceptions and refine future actions accordingly.
- Shield consumers from unexpected price hikes. Manage supply chain risks to reduce shocks and avoid passing higher costs to customers reactively.
- Protect margins without sacrificing value. When possible, pull execution levers other than price to bolster margins. Focus on improving efficiency to provide greater future price optionality and resilience.
Cost-aware value
Providing consumers with value beyond price typically requires investment. Store and service enhancements should pay off in increased brand value perception. Reallocate investments that don’t to those that do.
- Build a differentiated brand quality story. From your products to services, quality can be found in many attributes. Lean into the data and consumer evidence to shape a clear brand story that emphasizes your unique strengths.
- Stay human. The latest technology should support your mission by enabling employee and customer interactions that demonstrate competence and good intentions and build trust. Achieving these less tangible outcomes may also require developing new management systems and programs.
- Use private labels to compete on quality, not just price. The best store brands match or exceed national brands’ value propositions.23
- Specialize in seasonal occasions. Give shoppers a reason to visit and help your store stand out by offering a differentiated selection of seasonal goods.
- Invest in other grocery MVP drivers. Keep stores clean; ensure freshness and flavor across produce, bakery, and deli; and nurture friendly and effective staff.
Continue the conversation
Meet the industry leaders
Andy Paradis
Justin Cook
by
Andy Paradis
Adam Almond
Danny Edsall
Justin Cook
Vivek Dogra
The authors would like to acknowledge Steve Rogers, Nimisha Mohanan, Akash Kumar, Marcello Gasdia, Andre Benjamin, Alexander Cromwell, Blake Guidry, Jon Kaplan, James Jennings, Mara Wrzesniewski, Clark Passino, Mudit Gupta, and the greater Converge by Deloitte team for their contributions. Special thanks to the entire HundredX team, including those already listed, for their invaluable data and support.
Further thank yours are due to Rithu Thomas, Preetha Devan, Sylvia Yoon Chang, and Jaime Austin for their contributions to the production of this report
Editorial (including production and copyediting): Rithu Thomas, Preetha Devan, Anu Augustine, and Cintia Cheong
Design: Harry Wedel and Sonya Vasilieff
Cover image by: Tushar Barman
Knowledge services: Viswa Teja Vanapalli
Visit the Deloitte Consumer Industry Center
Access more insights for the automotive, consumer products, food, retail, wholesale and distribution, airlines and hospitality, and transportation sectors.