Loading...

Digital Media Monitor

Based on data from Digital Media Trends, Deloitte’s Digital Media Monitor provides a longitudinal view of US consumers’ engagement and spending on media and entertainment products, services, and subscriptions. We explore the breadth of subscriptions and services consumers use (like streaming video, cable or satellite TV, gaming, and music), their behaviors around subscription video-on-demand (SVOD) cancellations—which we call “churn”—spending considerations for in-home entertainment and attendance of out-of-home entertainment, their preferences for different types of media, and more.

Digital Media Trends has continuously evolved to meet the changing technologies, trends, and consumer behaviors in the media and entertainment (M&E) industry. Every six months, the Center for Technology, Media & Telecommunications surveys a census-representative cohort of US consumers, age 14 and older, to keep an eye on the changes in the M&E industry in American households.

Media & entertainment subscriptions, behaviors, and event attendance

Consumers have a range of media and entertainment (M&E) services and subscriptions to choose from that are instantly accessible wherever they are, including streaming video, cable or satellite TV, gaming, and music. Many M&E services and activities (including live and in-person events) remain popular, while others are waning, and there are often demographic differences in the users of these services and subscriptions. Explore recent trends in media and entertainment subscriptions, consumer behaviors, and event attendance below.


US consumers have a variety of media and entertainment subscriptions, with most adoption rates remaining steady

KEY TAKEAWAY

Adoption of ad-supported video-on-demand (AVOD) services has broadly stabilized, with 65% of SVOD subscribing households now having at least one AVOD service, according to the fall 2026 Digital Media Trends data, compared with 66% in fall 2025.

Filters

Choose data to filter

Age: All


Generation: All


Methodology Note

All subscription share figures are based on all US consumers surveyed, except for the figures presented for ad-supported video-on-demand (AVOD) services, which are based on a smaller subset of US consumers who subscribe to paid SVOD services.


Most US consumers are gamers, and they play video games for several hours weekly

KEY TAKEAWAY

Ninety-one percent of Gen Zs say they are gamers, followed by 86% of millennials who say the same. On average, Gen Z and millennial gamers dedicate eight hours weekly to playing video games—a number that has stayed largely unchanged in recent years.

Filters

Choose data to filter

Age: All


Generation: All


Methodology Note

The number of hours spent playing video games per week is based on “gamers” only.


Most US consumers recently watched a movie in a theater; smaller shares attended live music concerts or sporting events

KEY TAKEAWAY

With the popularity of women’s sports on the rise, data suggests that 38% of consumers who have attended a college or professional sporting event in person in the last six months say at least one of those events was a women’s sporting event.

Filters

Choose data to filter

Age: All


Generation: All


Methodology Note

Figures show the percentage of surveyed consumers who say they’ve attended each of these events in the last six months.
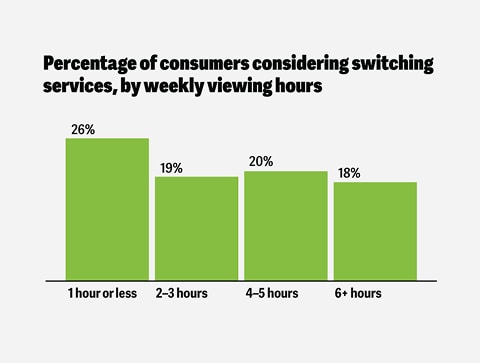
Paid streaming video churn

Some paid subscription video-on-demand services have struggled to become, and remain, profitable. Part of this struggle is subscriber retention and cancellations. Consumers can watch the content they’re interested in and then cancel their subscription. And in some cases, they might sign up for that same service again when new content becomes available: enter “churn and return.”


Churn—and churn and return—remains a challenge for streaming video providers

KEY TAKEAWAY

As of the fall 2026 Digital Media Trends reporting, Gen Zs have the highest churn rate, with 57% of this group canceling an SVOD service in the last six months—a number that has increased by 7 percentage points from the fall 2025 report. This is compared with 43% of consumers overall who have churned.

Filters

Choose data to filter

Age: All


Generation: All


Methodology Note

“Churn” is the percentage of consumers who have canceled any paid SVOD service in the last six months. “Churn and return” is the percentage of consumers who have canceled a paid SVOD service and then later returned to that same service in the last six months.

Media & entertainment spending

Prices for media and entertainment services continue to climb. Subscriptions for discretionary entertainment services (like paid subscription video, music, and gaming services, or cable or satellite TV) may be impacted, as individuals prioritize their spending by reducing or eliminating these subscriptions.


Financial concerns impact spending on media and entertainment services, causing frustration for some

KEY TAKEAWAY

Almost two-thirds of consumers overall say they’re frustrated that the entertainment services they subscribe to continue to raise their prices, according to our fall 2026 Digital Media Trends reporting. Additionally, more than one-third of consumers say they’ve recently cut back on entertainment subscriptions due to financial concerns.

Filters

Choose data to filter

Age: All


Generation: All


Methodology Note

Figures here show respondents who said they “strongly agree” or “somewhat agree” with the statements above.


Monthly household spending on SVOD services continues to climb

KEY TAKEAWAY

The average subscribing household spends $76 monthly on their SVOD service subscriptions, with Gen Zs reportedly spending more than any other generation, at $83 per month. Almost 60% of consumers say they would be likely to cancel their favorite SVOD service if the monthly subscription price increased by $5.

Filters

Choose data to filter

Age: All


Generation: All


Methodology Note

The figure here shows the average monthly spending by a subscribing household on all SVOD services combined.

Shifting video preferences

Social media content is competing with traditional video content for consumers’ time and attention. Given an endless stream of personalized content at no cost and at their fingertips, consumers may increasingly prefer watching social videos as an alternative to streaming video. And some, especially Gen Zs and millennials, say they feel more connected to social media creators than the personalities or actors they see on TV.


Some consumers favor videos on social media over those on streaming video services, and feel strong connections to social media creators

KEY TAKEAWAY

As of the fall 2026 Digital Media Trends reporting, roughly half of Gen Zs say that social media content is more relevant to them than traditional content (54%) and that they feel a stronger personal connection to social media creators than to the actors and personalities they see on TV (48%).

Filters

Choose data to filter

Age: All


Generation: All


Methodology Note

Figures here show respondents who said they “strongly agree” or “somewhat agree” with the statements above.

Continue the conversation

The Deloitte Center for Technology, Media & Telecommunications conducts research and develops insights to help business leaders see their options more clearly. The center can help executives better discern risk and reward, capture opportunities, and solve tough challenges amid the rapidly evolving TMT landscape.

Learn more