Tech decisions can drive big earnings-per-share gains
Deloitte analysis shows that increasing IT, data and AI investments can nearly double earnings per share, unlocking a potentially huge competitive advantage
In a market often defined by disruption and compressed decision-making cycles, business leaders are under pressure to make faster, smarter technology decisions: How much should the IT budget increase? How quickly should they scale artificial intelligence? How foundational is data transformation in driving performance?
The real challenge is not simply deciding whether to invest in data, AI, or larger IT budgets, but recognizing that these choices do not create value in isolation. Organizations operate as interconnected systems, where decisions about data maturity, AI scaling, capability building, and technical debt compound over time, shaping earnings and market performance in ways that are easy to miss when viewed linearly.
To make those dynamics visible, Deloitte’s Center for Integrated Research applied a system dynamics modeling approach (see methodology) to capture organizations as complex, feedback-driven systems in which investments, behaviors, and outcomes evolve together over time. In a typical S&P 500 company, the technology decisions leaders make about data, AI, IT budgets, and workforce capacity can materially reshape earnings per share over just a few years. The model comprises 63 variables that include the tech estate, digital capabilities, and organizational readiness, as well as 20 core variables that tend to most strongly influence outcomes, such as earnings per share (EPS).
This article focuses on the digital investment decisions that can impact EPS growth and the underlying capabilities that enable it. Throughout, outcomes are expressed in EPS terms, giving chief information officers, chief financial officers, and boards a common language for making technology trade-offs.
We conducted a peer-to-peer analysis of two comparable S&P 500 companies to examine the potential EPS impact of different strategic choices.
The first reflects a typical S&P 500 organization operating at an average competitive level. It has a median IT spend, moderate digital maturity, a fairly strong (but not exceptional) ability to manage change, and limited AI activity beyond pilots. Its strategy is to keep technology, data, and AI capabilities broadly in line with market averages. Based on historical S&P 500 patterns, this company starts at an EPS of US$2 in Year 1 and grows steadily to US$5.17 by Year 5, reflecting typical market performance.
The second company is similar in size and starting EPS, but is pursuing a targeted strategic intervention. Rather than maintaining average positioning, it is intentionally testing actions to strengthen competitive advantage—such as scaling AI, advancing data strategy, adjusting tech investment, optimizing tech headcount, and strengthening change execution—to assess how those choices may translate into different EPS outcomes.
Our analysis reveals that three key levers—data maturity, AI maturity, and tech budget adjustments—have the potential to generate significant EPS gains. Deloitte’s model quantifies the impact of specific decisions made in each scenario on EPS growth, identifying which strategic investment choices—or “interventions”—accelerate value creation and which undermine it. These financial estimates can help provide leaders with a clearer picture of how specific decisions related to bold technology strategies may impact EPS in the next two to five years.1
Improving data maturity
Most enterprises hold immense data assets, yet many still struggle to turn them into scalable economic value.2 Without disciplined investment, data remains an operating cost rather than a strategic asset.
Here, scenario 2 reflects an organization that aims to transition from average data maturity to data maturity leadership. An organization might achieve this through actions such as establishing a clear data strategy, data governance, data quality, development of reusable data products, and more. In this model, data maturity refers to the degree to which data is accessible, of high quality, and monetizable for business value.
Given an 18-month window to implement these kinds of improvements, the scenario modeling shows a stronger foundation for data-driven decision-making across the enterprise compared to scenario 1.3 In the model, that change is reflected as a 35% increase in data maturity (figure 1). The organization’s budget remains the same as market averages, but they’re reprioritizing existing spend rather than increasing overall investment. After 18 months, the organization shows an EPS of US$2.43—11% more than the organization maintaining the status quo. For a company competing in the S&P 500, that could be a meaningful competitive advantage.
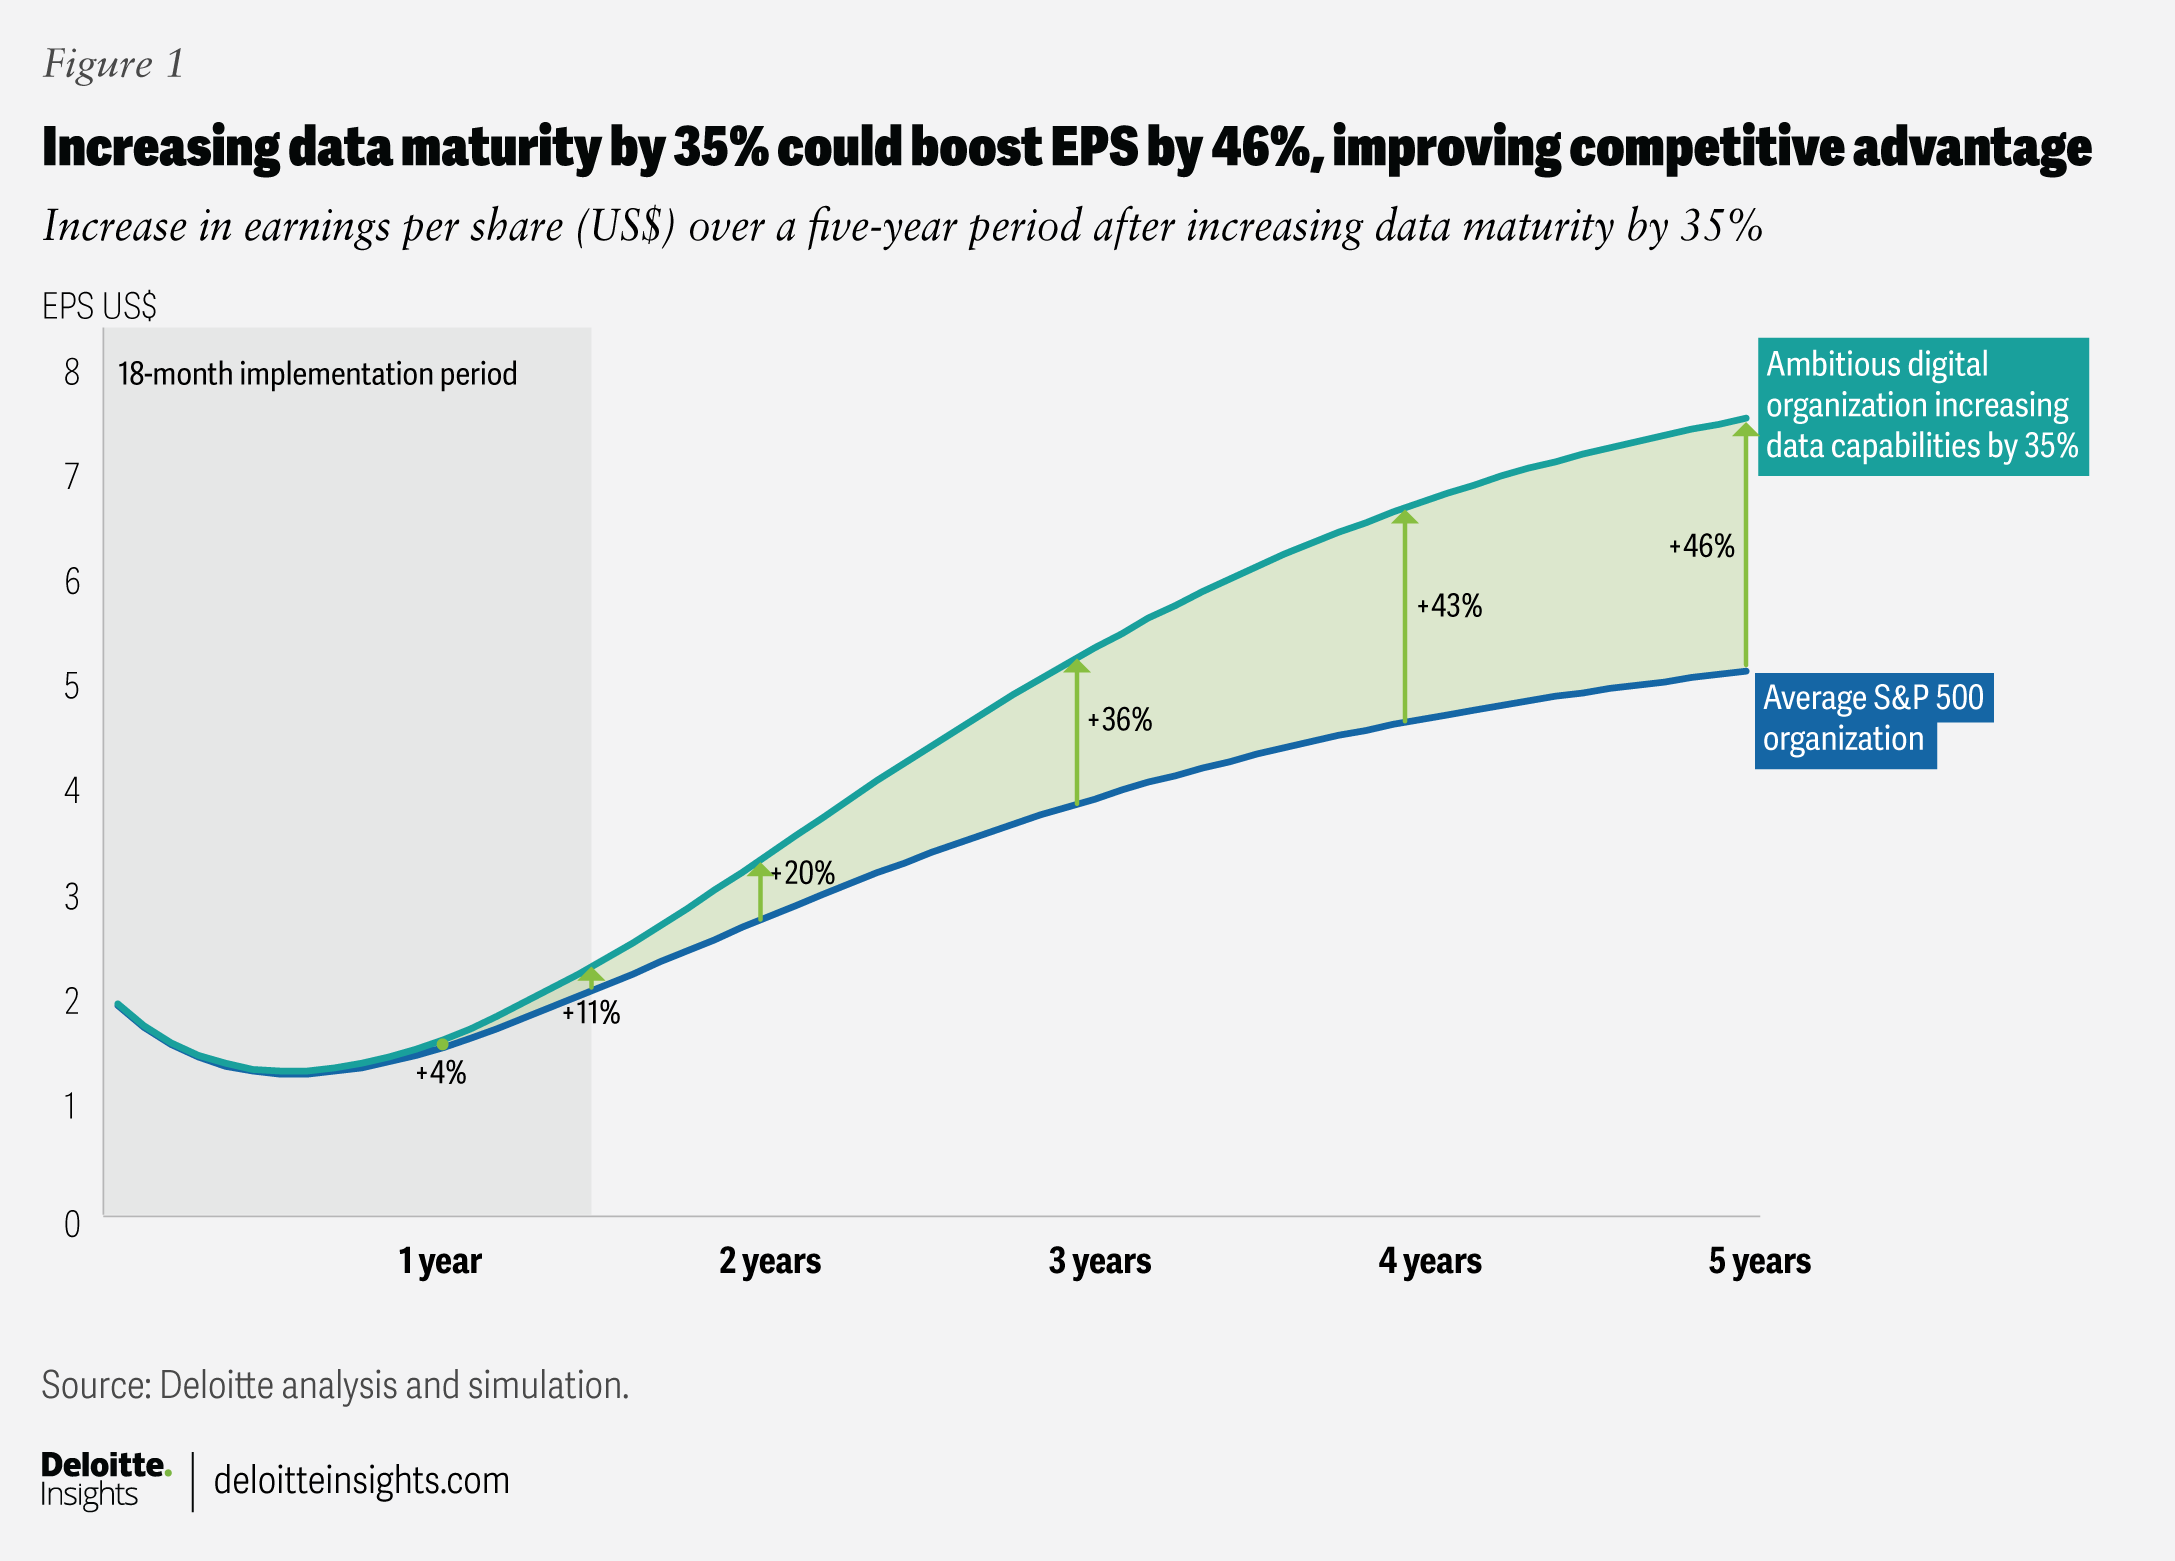
The simulation4 also reveals how this advantage can compound over time, starting with a 20% EPS increase in Year 2, a 36% increase in Year 3, and a 46% increase in Year 5. While continuous growth is important, it is the difference between organization 1 and organization 2 that defines a competitive advantage. From a financial perspective, an incremental US$2.40 increase in EPS—based on 115.6 million shares outstanding5—implies approximately US$277 million delta between the two strategies. In terms of collective gains across the S&P 500, that could add up to around US$139 billion.
This modeled outcome mirrors what some leading organizations are already achieving in practice. Ooredoo Group implemented a data maturity program across its eight operating companies between 2024 and 2025 to unify data capabilities and elevate organizational data maturity.6 The program focused on modernizing the data platform, strengthening governance, standardizing key performance indicators, and enabling self-service analytics across business functions. Within the program’s timeline, participating markets reported 20% to 30% increases in data maturity scores, migration of data platforms to cloud environments, and widespread adoption of automated reporting. These changes reduced manual effort, accelerated analytics for informed decision-making, and positioned data as a strategic business asset.
Boosting AI maturity
Even as AI dominates executive conversations, many leaders are asking, “Where’s the financial impact?” Pilots are abundant, but scaled and monetized adoption remains rare.7 According to Deloitte’s 2025 Tech Value research, nearly 80% of organizations invested in AI in the prior 12 months, making it the single-most funded digital capability; yet most remain at early to mid-level maturity, experimenting rather than scaling.
Our research shows that AI’s return on investment is multifaceted, spanning a range of technologies, strategies, and ambition levels. ROI is being achieved, but often incrementally. Our modeling demonstrates that advancing AI maturity can deliver substantial returns when it moves from experimentation to disciplined scaling.
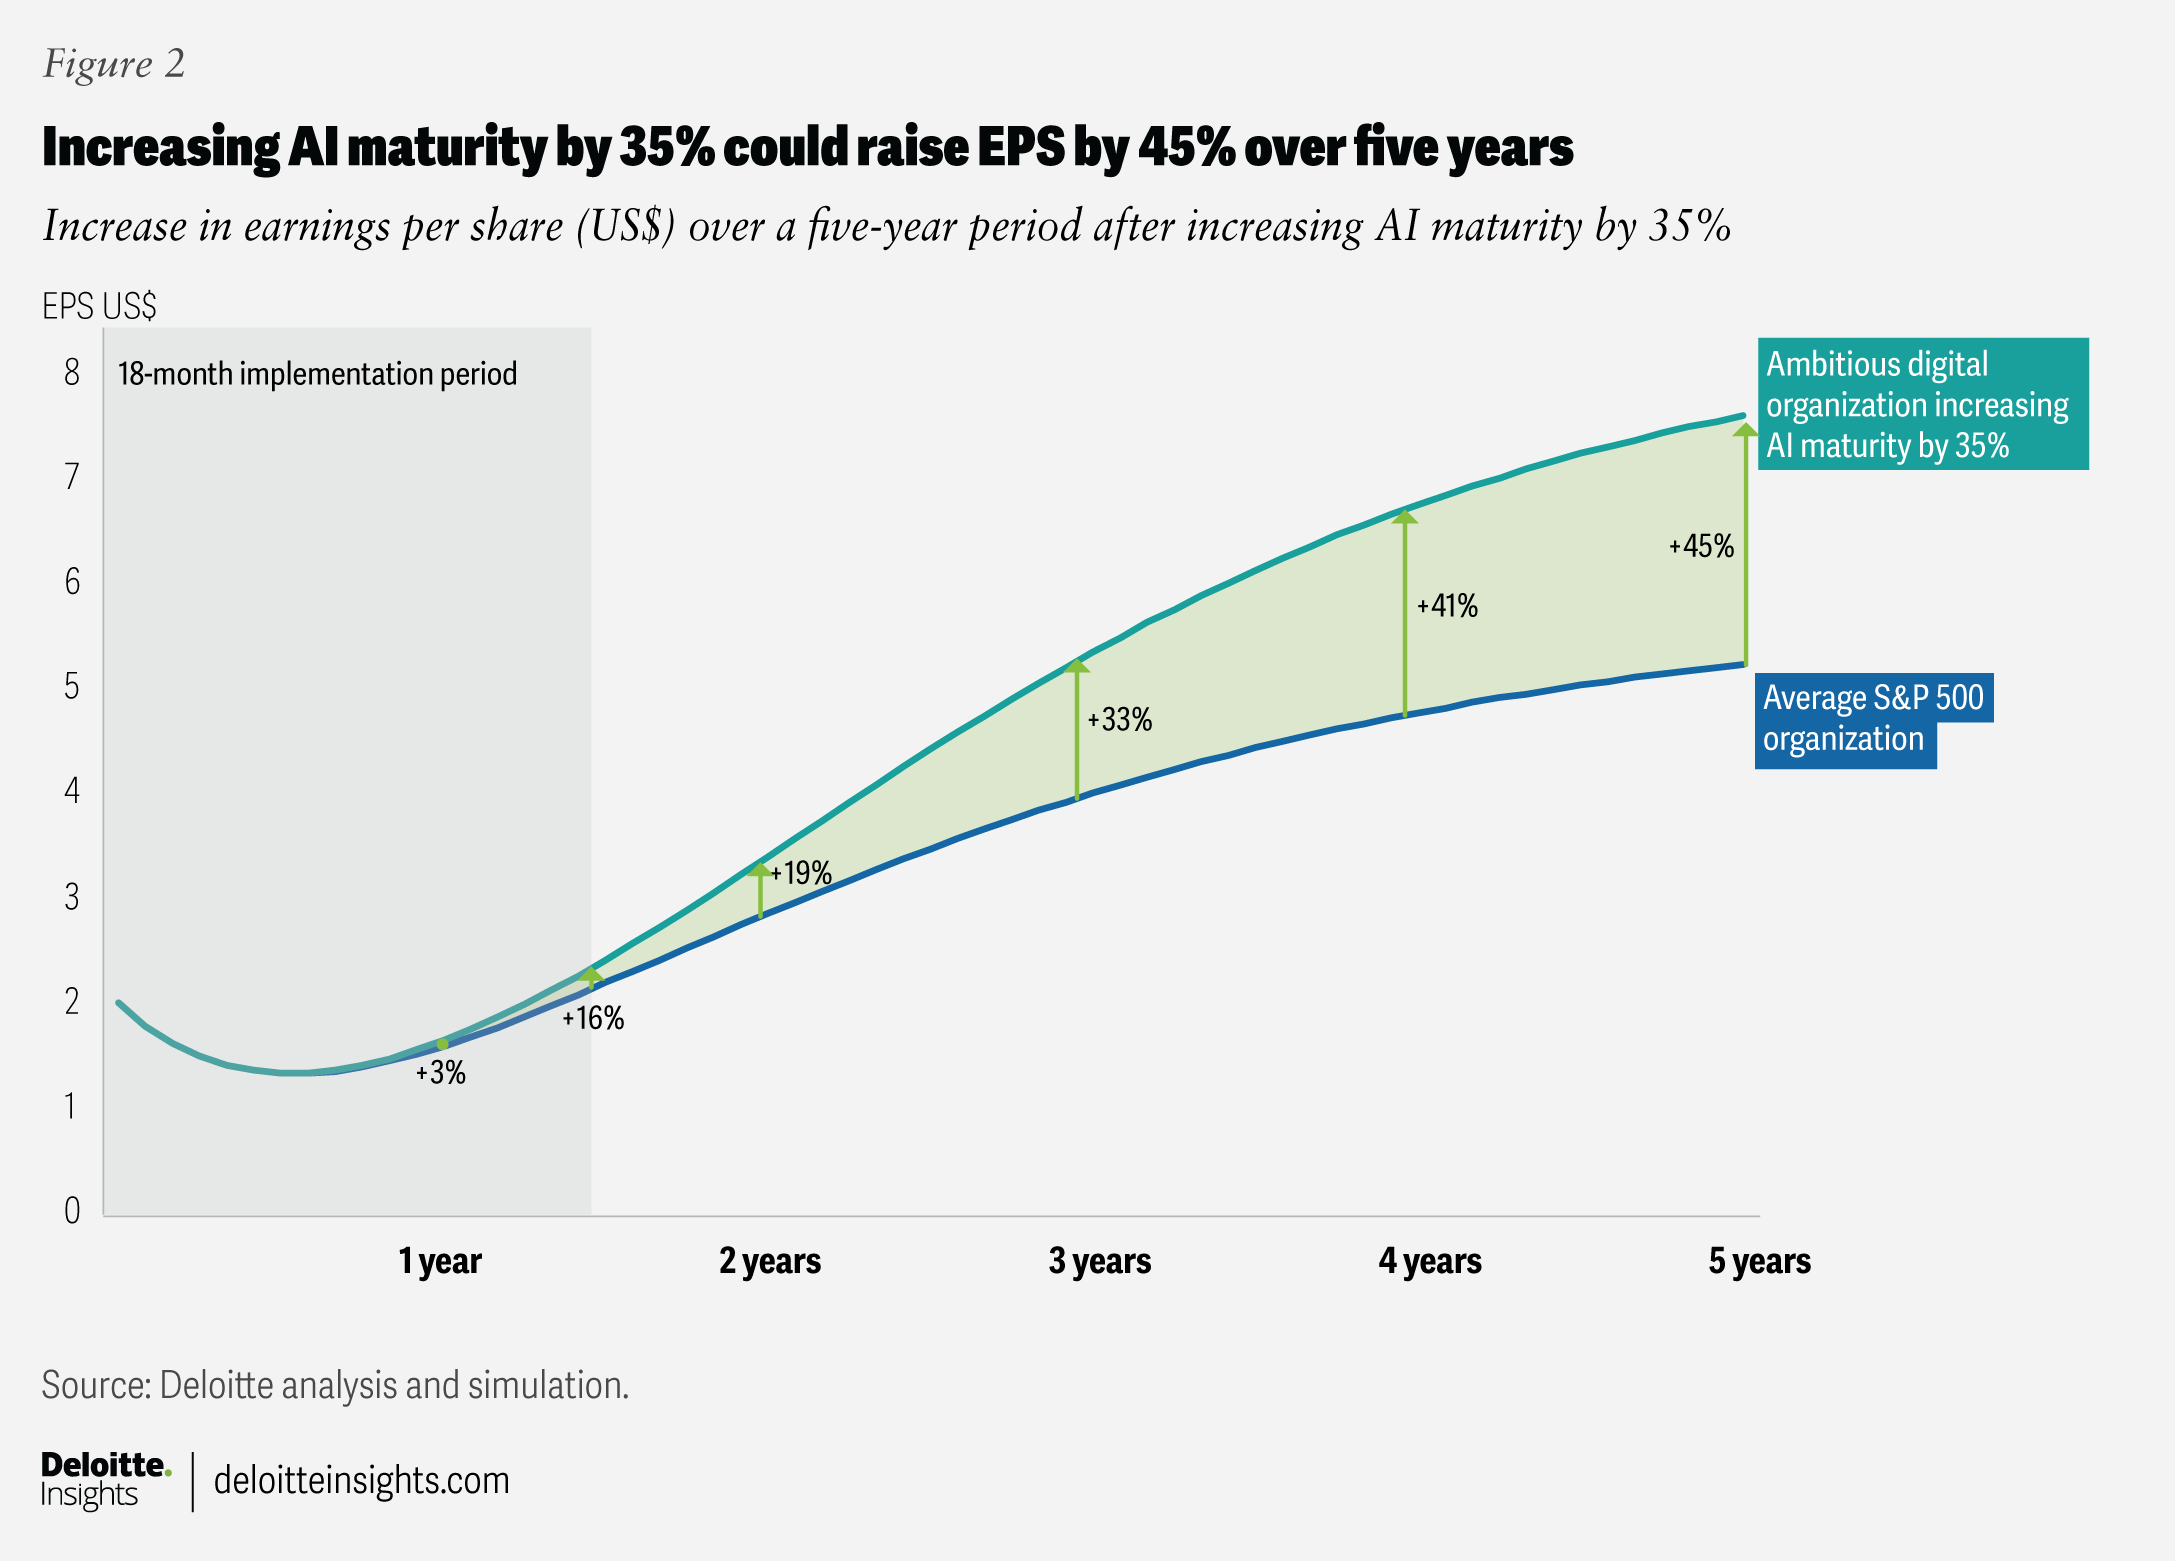
Here, scenario 2 reflects an organization that moves from average AI maturity to AI leadership. A 35% increase in AI maturity—shifting from experimentation to disciplined scaling across core processes, with stronger model life cycle management—raises EPS by 19% in Year 2, 33% in Year 3, and 45% in Year 5 (figure 2). Compared to organizations that maintain the status quo, and given the same average share count, at the end of Year 5, this EPS increase could translate to as much as US$269 million in annual earnings per company, totaling around US$135 billion in collective gains across the S&P 500.
Procter & Gamble provides an example of how scaling AI from pilot to enterprisewide use can deliver significant operational and financial returns. The company has been enhancing its AI maturity by moving beyond pilots in isolated business functions to embedding AI across research and development, manufacturing, supply chain, and marketing processes. Within R&D, AI drives 65% of P&G’s product development processes, reducing development time by 22% and facilitating faster and strategically targeted product launches amid fast-evolving consumer preferences.8 Through its AI-driven supply chain insights, the company is able to better understand and anticipate consumer needs, reducing out-of-stock rates by 15% and making products available when and where they’re needed.9 Additionally, its AI-powered ad testing helps to align marketing campaigns with target demographics and drive higher engagement. Across these applications, the company uses reusable AI platforms and agents and implements enterprise governance frameworks for safe and consistent scaling of AI, creating an edge in a highly competitive consumer products industry.
The broader research landscape points to a measured view of AI value. Some recent studies have emphasized AI’s value-added potential, while others have reported more modest results. Deloitte’s 2025 Tech Value research concludes that the reality likely lies between these poles: AI investments drive capability ROI today, while other value measures are realized incrementally as capabilities mature over time. This stands to reason, as AI encompasses a range of investment levels, capabilities, and complexities.
Making bold and consistent IT investments
Technology budgets are often viewed as costs to control rather than levers to create value. The shift from a status quo S&P 500 organization to an ambitious digital enterprise requires viewing IT spend as a strategic investment—one that delivers meaningful returns when sustained over time.
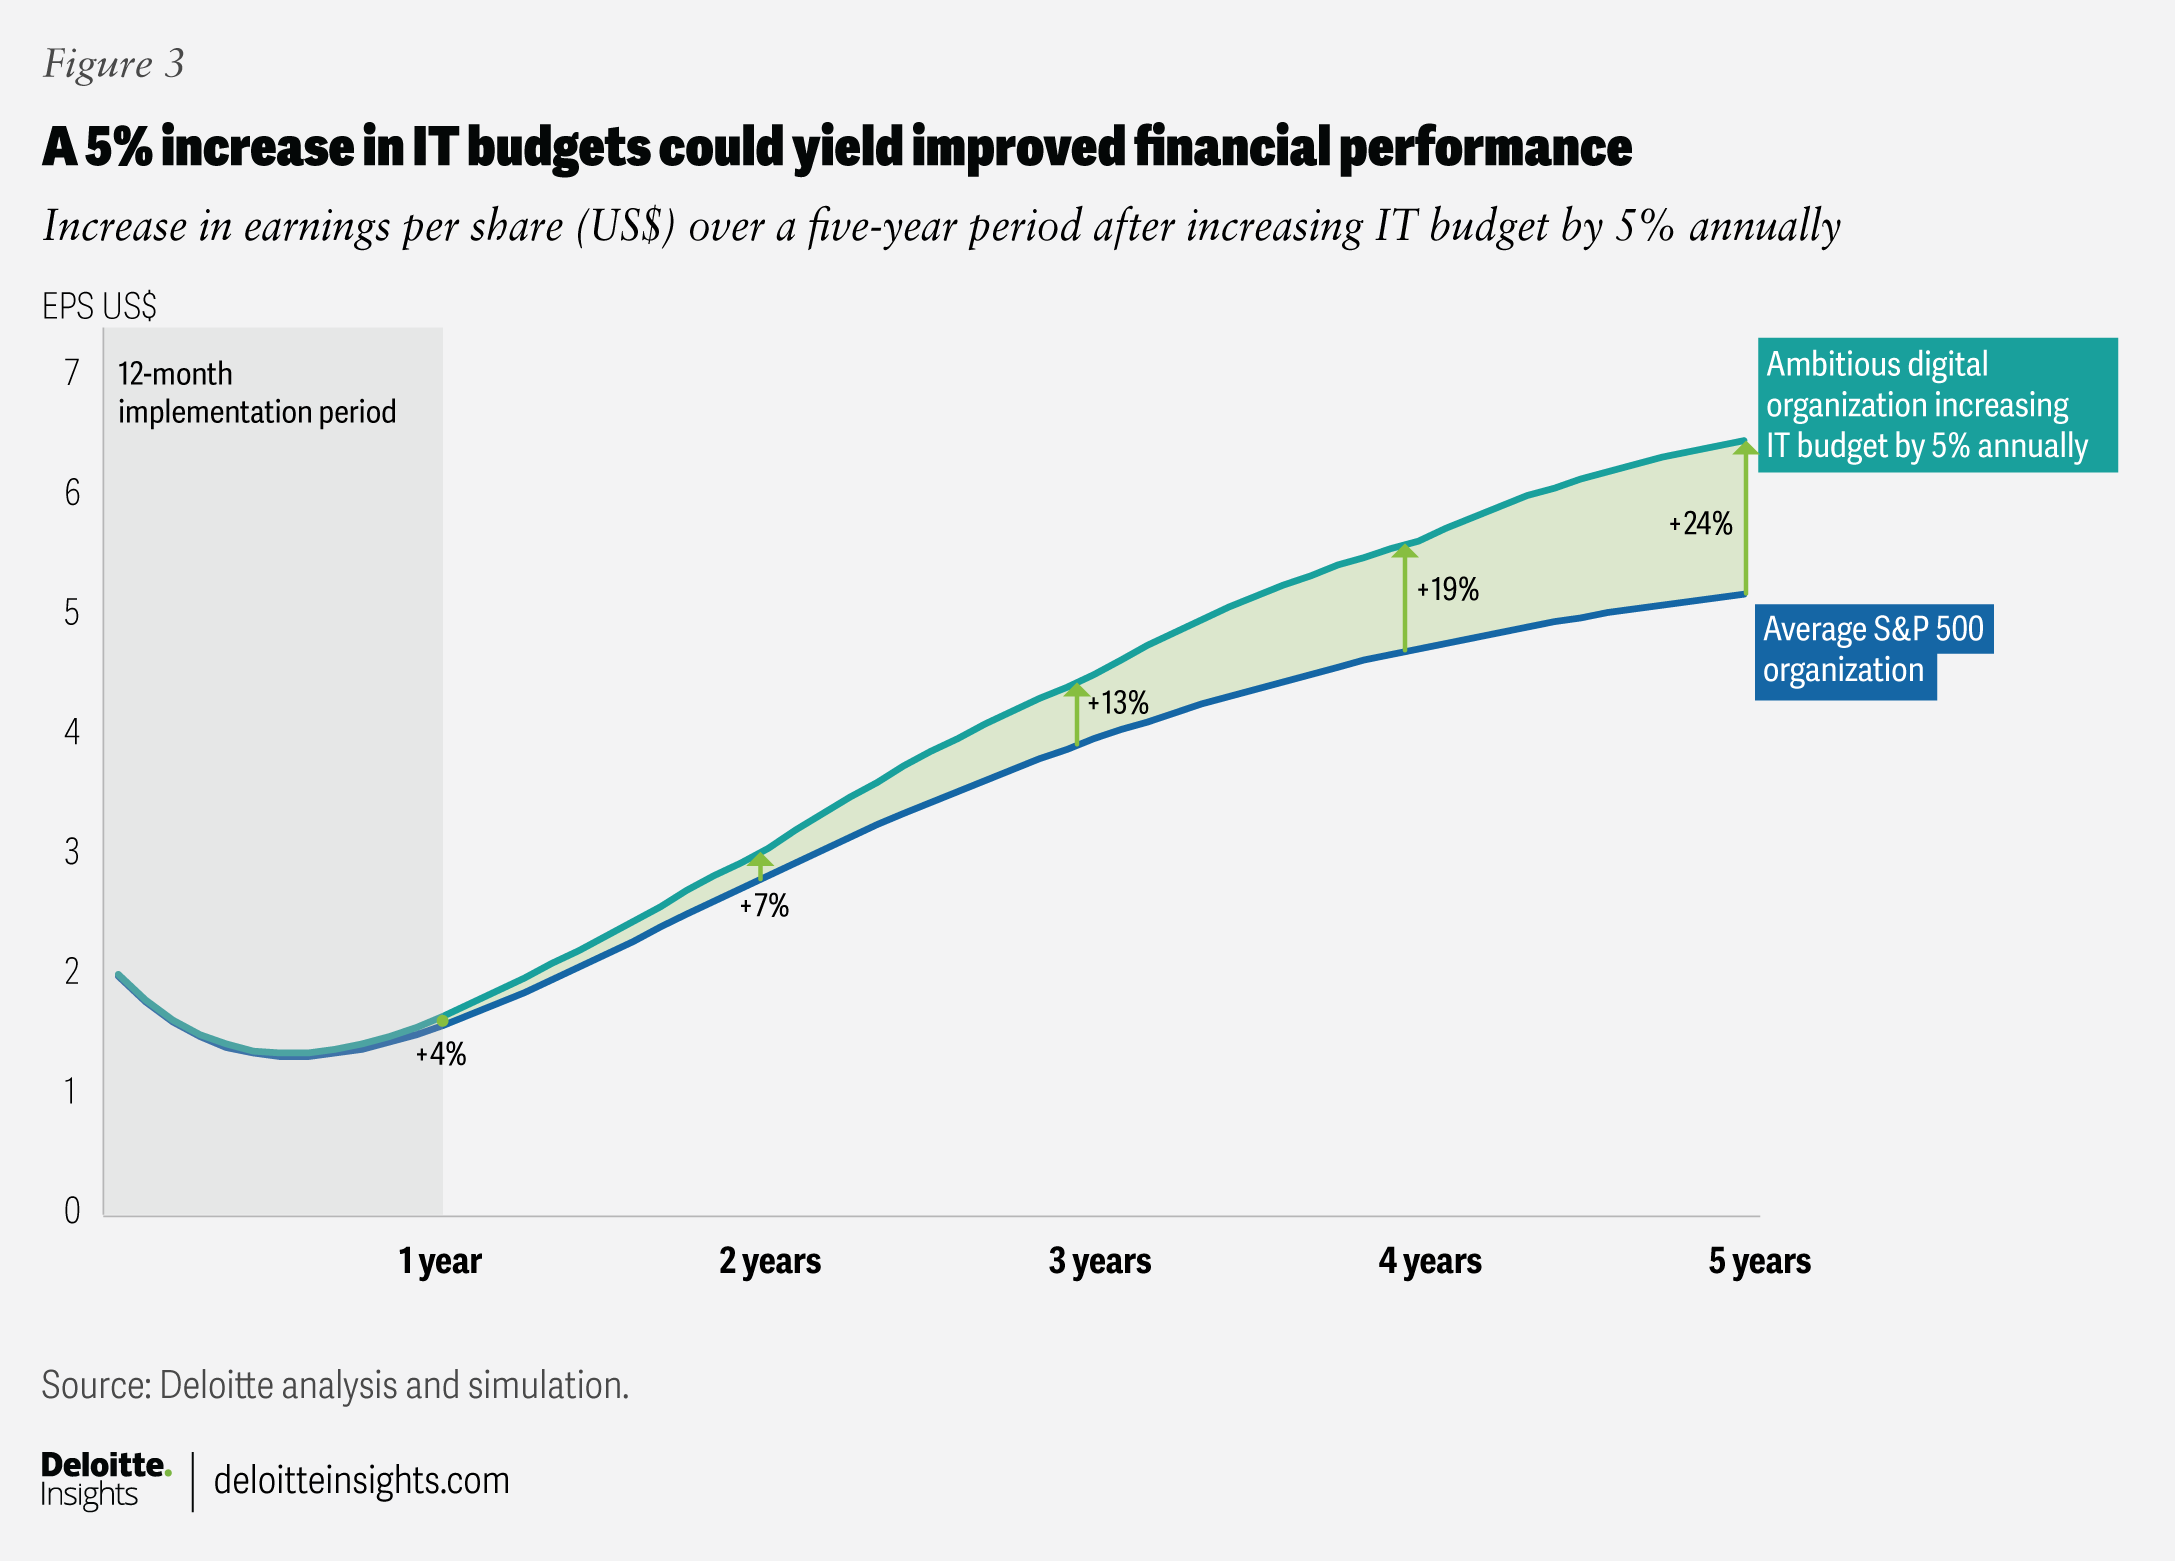
Sustaining IT investment at 5% above baseline each year for five years—focused on modernization, capability building, and adoption support—can drive a meaningful increase in financial performance. In the model, EPS increases from US$3.05 (a 7% increase) in Year 2 to US$4.48 (a 13% increase) in Year 3, and then to US$6.42 (a 24% increase) in Year 5 (figure 3). For a typical S&P 500 company, this could equate to an estimated US$145 million in additional annual earnings and approximately US$72 billion in aggregate value across the S&P 500 Index.
Capturing this value may require treating IT budgets as capital allocation decisions and pairing increased funding with governance that directs investment toward modernization, digital capabilities, and data and AI enablement. Deloitte’s 2025 Tech Value research has shown that while the market trend has been for budgets to increase on average, budgets are also being strained to manage the push to innovate with digital and AI and the pull to modernize core IT. Both are needed, and the tech budget increase in this scenario model assumes technology budgets that are increasing at above-average S&P 500 rates to address areas that may be experiencing budget shortfalls, such as cybersecurity and core IT systems.
A 5% annual increase in IT spend represents a moderate and realistic scenario, designed to illustrate the incremental gains that come from sustained investment in modernization, capability building, and adoption support.
Optimizing the tech workforce to sustain EPS gains
While our analysis shows that certain tech strategy actions can have a positive and significant impact on EPS, not all variables exhibit this behavior. As Deloitte’s 2025 Global Human Capital Trends report notes, organizations often over-index on short-term business outcomes at the expense of human outcomes whose value emerges over time. During downturns, technology headcount is often an early target for cost savings, so we put it to the test in the model, with our scenario-2 company reducing headcount by 20% over a five-year period.
Our analysis shows that, in some cases, ambitious workforce transformation strategies may not yield positive market returns. For example, standalone reductions in productive capacity without corresponding reinvestment in automation or capability building and scaling could lead to lower output and slower value creation. In other words, strategic decisions related to the tech workforce, skills, and capabilities can reduce productive capacity and adversely impact business outcomes when an organization’s ability to produce high-quality work is constrained. To clarify, this variable does not reflect actions taken to reduce waste and excess capacity. If an organization determines that 20% of its capacity is not productive, then reducing the unproductive capacity will likely improve the company’s EPS. This variable focuses on reducing productive capacity, which directly reduces IT delivery output.
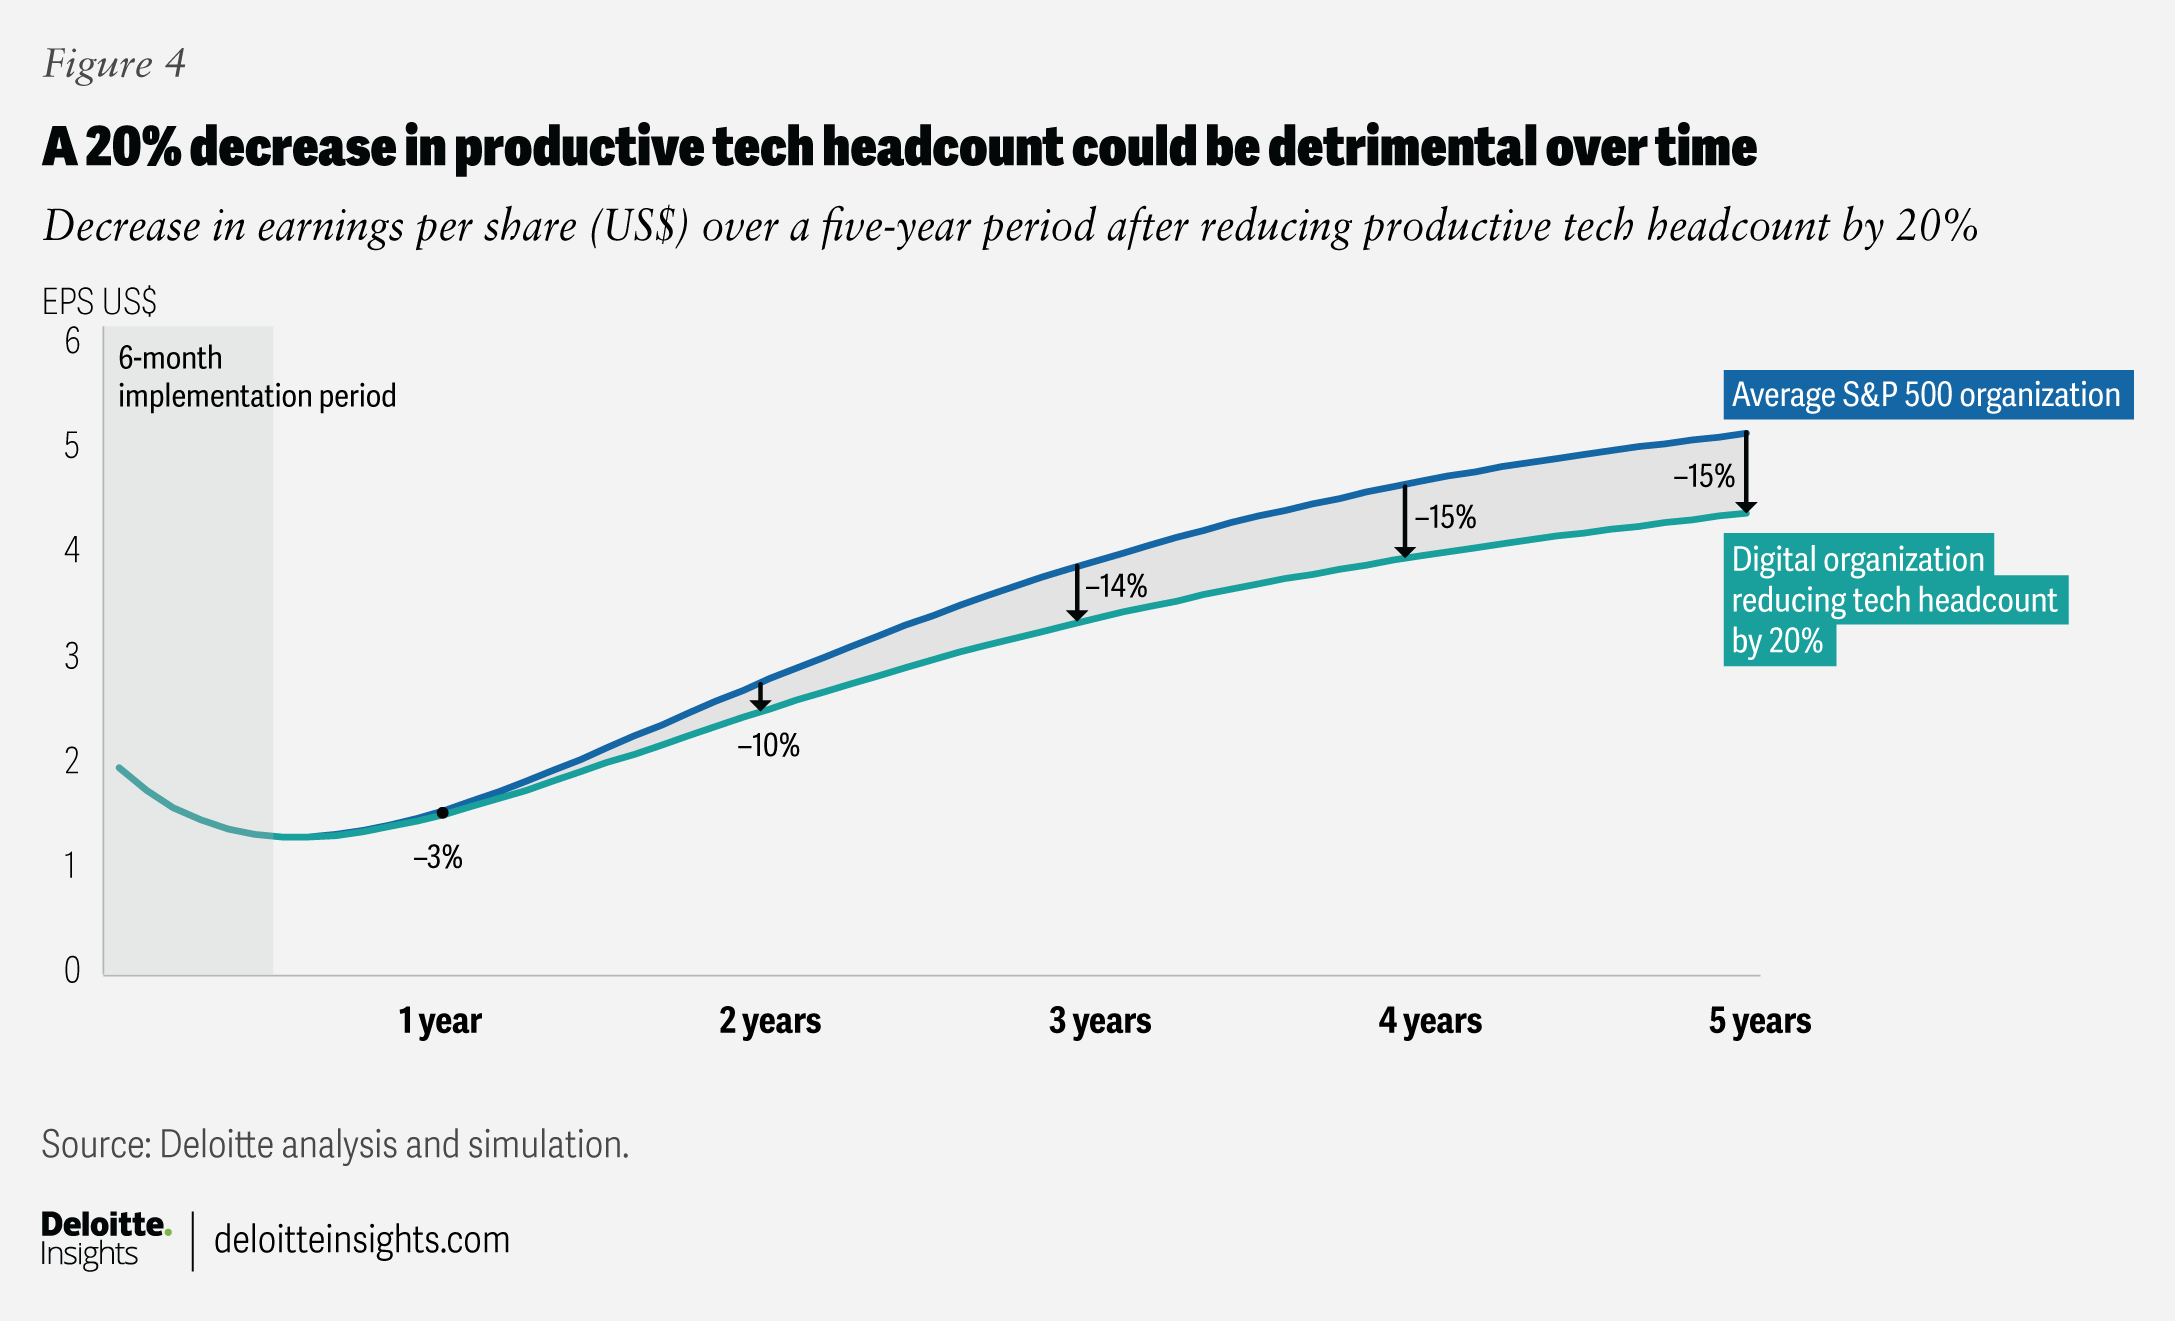
In this analysis, we simulated a 20% reduction in tech headcount and found that when capacity is reduced, value creation slows, reinforcing loops weaken, and recovery becomes more costly. After five years, EPS fell from US$5.17 to US$4.41—a 15% decrease (figure 4), which resulted in a reduction of roughly US$88 million per company, or approximately US$44 billion in total across the S&P 500.
What appears efficient in the short term can erode the very capabilities that sustain resilience and growth. Organizations should take a targeted approach to workforce resets—protecting core modernization and adoption capacity and pairing reductions with operating model changes that sustain delivery speed and capability momentum.
A recent example with clear financial signals comes from a major personal computer manufacturer that plans significant job cuts as it shifts operations toward AI.10 While the company projected US$1 billion in annualized savings by 2028, it also disclosed US$650 million in restructuring costs and issued fiscal 2026 EPS guidance below market expectations. The announcement was followed by a decline of more than 5% in the company’s share price. These outcomes illustrate how large-scale headcount reductions—even when positioned as productivity-driven—can trigger investors’ concerns about future growth and execution risks. This pattern aligns with our model’s findings that reducing productive capacity without targeted reinvestment weakens value-creation dynamics and can lead to depressed long-term financial outcomes, despite achieving near-term cost savings.
The dynamics of technology value and longstanding returns for shareholders
The insights from this scenario-modeling analysis provide clear, quantitative evidence that technology transformation is not merely a cost management exercise; it is a set of interdependent decisions that shape EPS and enterprise value by aligning consistent IT investments with maximizing data and AI maturity and protecting the capacity required to deliver change.
A powerful effect emerges when value drivers are synchronized. This coordinated effort will likely require leaders across the C-suite to set clear tech strategy objectives, direct dollars to initiatives that harness these dynamics, and govern technology as a system so that decisions about assets, methods, and people reinforce one another to drive not just immediate impact but also long-term value into the next decade.
Methodology
A system dynamics model enables users to consider the full spectrum of decision-making complexity and identify ripple effects where one choice can either accelerate or slow progress elsewhere. Instead of assuming linear cause and effect, the system dynamics approach captures delays, reinforcing and balancing feedback loops,11 and unintended consequences that unfold over time. Our model incorporates a combination of real-world data, executive interview insights, financial data, and a set of 63 variables that influence key outcomes, including earnings per share.
This Deloitte Center for Integrated Research analysis was developed through a structured, multistage process that combined qualitative insights and quantitative evidence. The foundation of the model was established through a series of structured interviews with subject matter specialists, during which participants articulated their thoughts on critical drivers of digital transformation and described the feedback loops and dependencies they believe shape organizational outcomes. These insights were synthesized into an initial conceptual model, then refined through iterative reviews with stakeholders and senior leaders to ensure that the evolving structure faithfully captured the complexities of real-world transformation initiatives.
System dynamics modeling
Deloitte applied system dynamics (SD)12 to model how technology, organizational, and financial factors interact over time in an archetypal organization, shaping enterprise value. SD models how feedback loops, accumulation, and time delays shape nonlinear business outcomes, providing a rigorous lens for understanding digital transformation. The approach enables users to model organizational dynamics by examining how elements within the model are influenced by changes in the system, referred to as interventions.13
Building the conceptual model
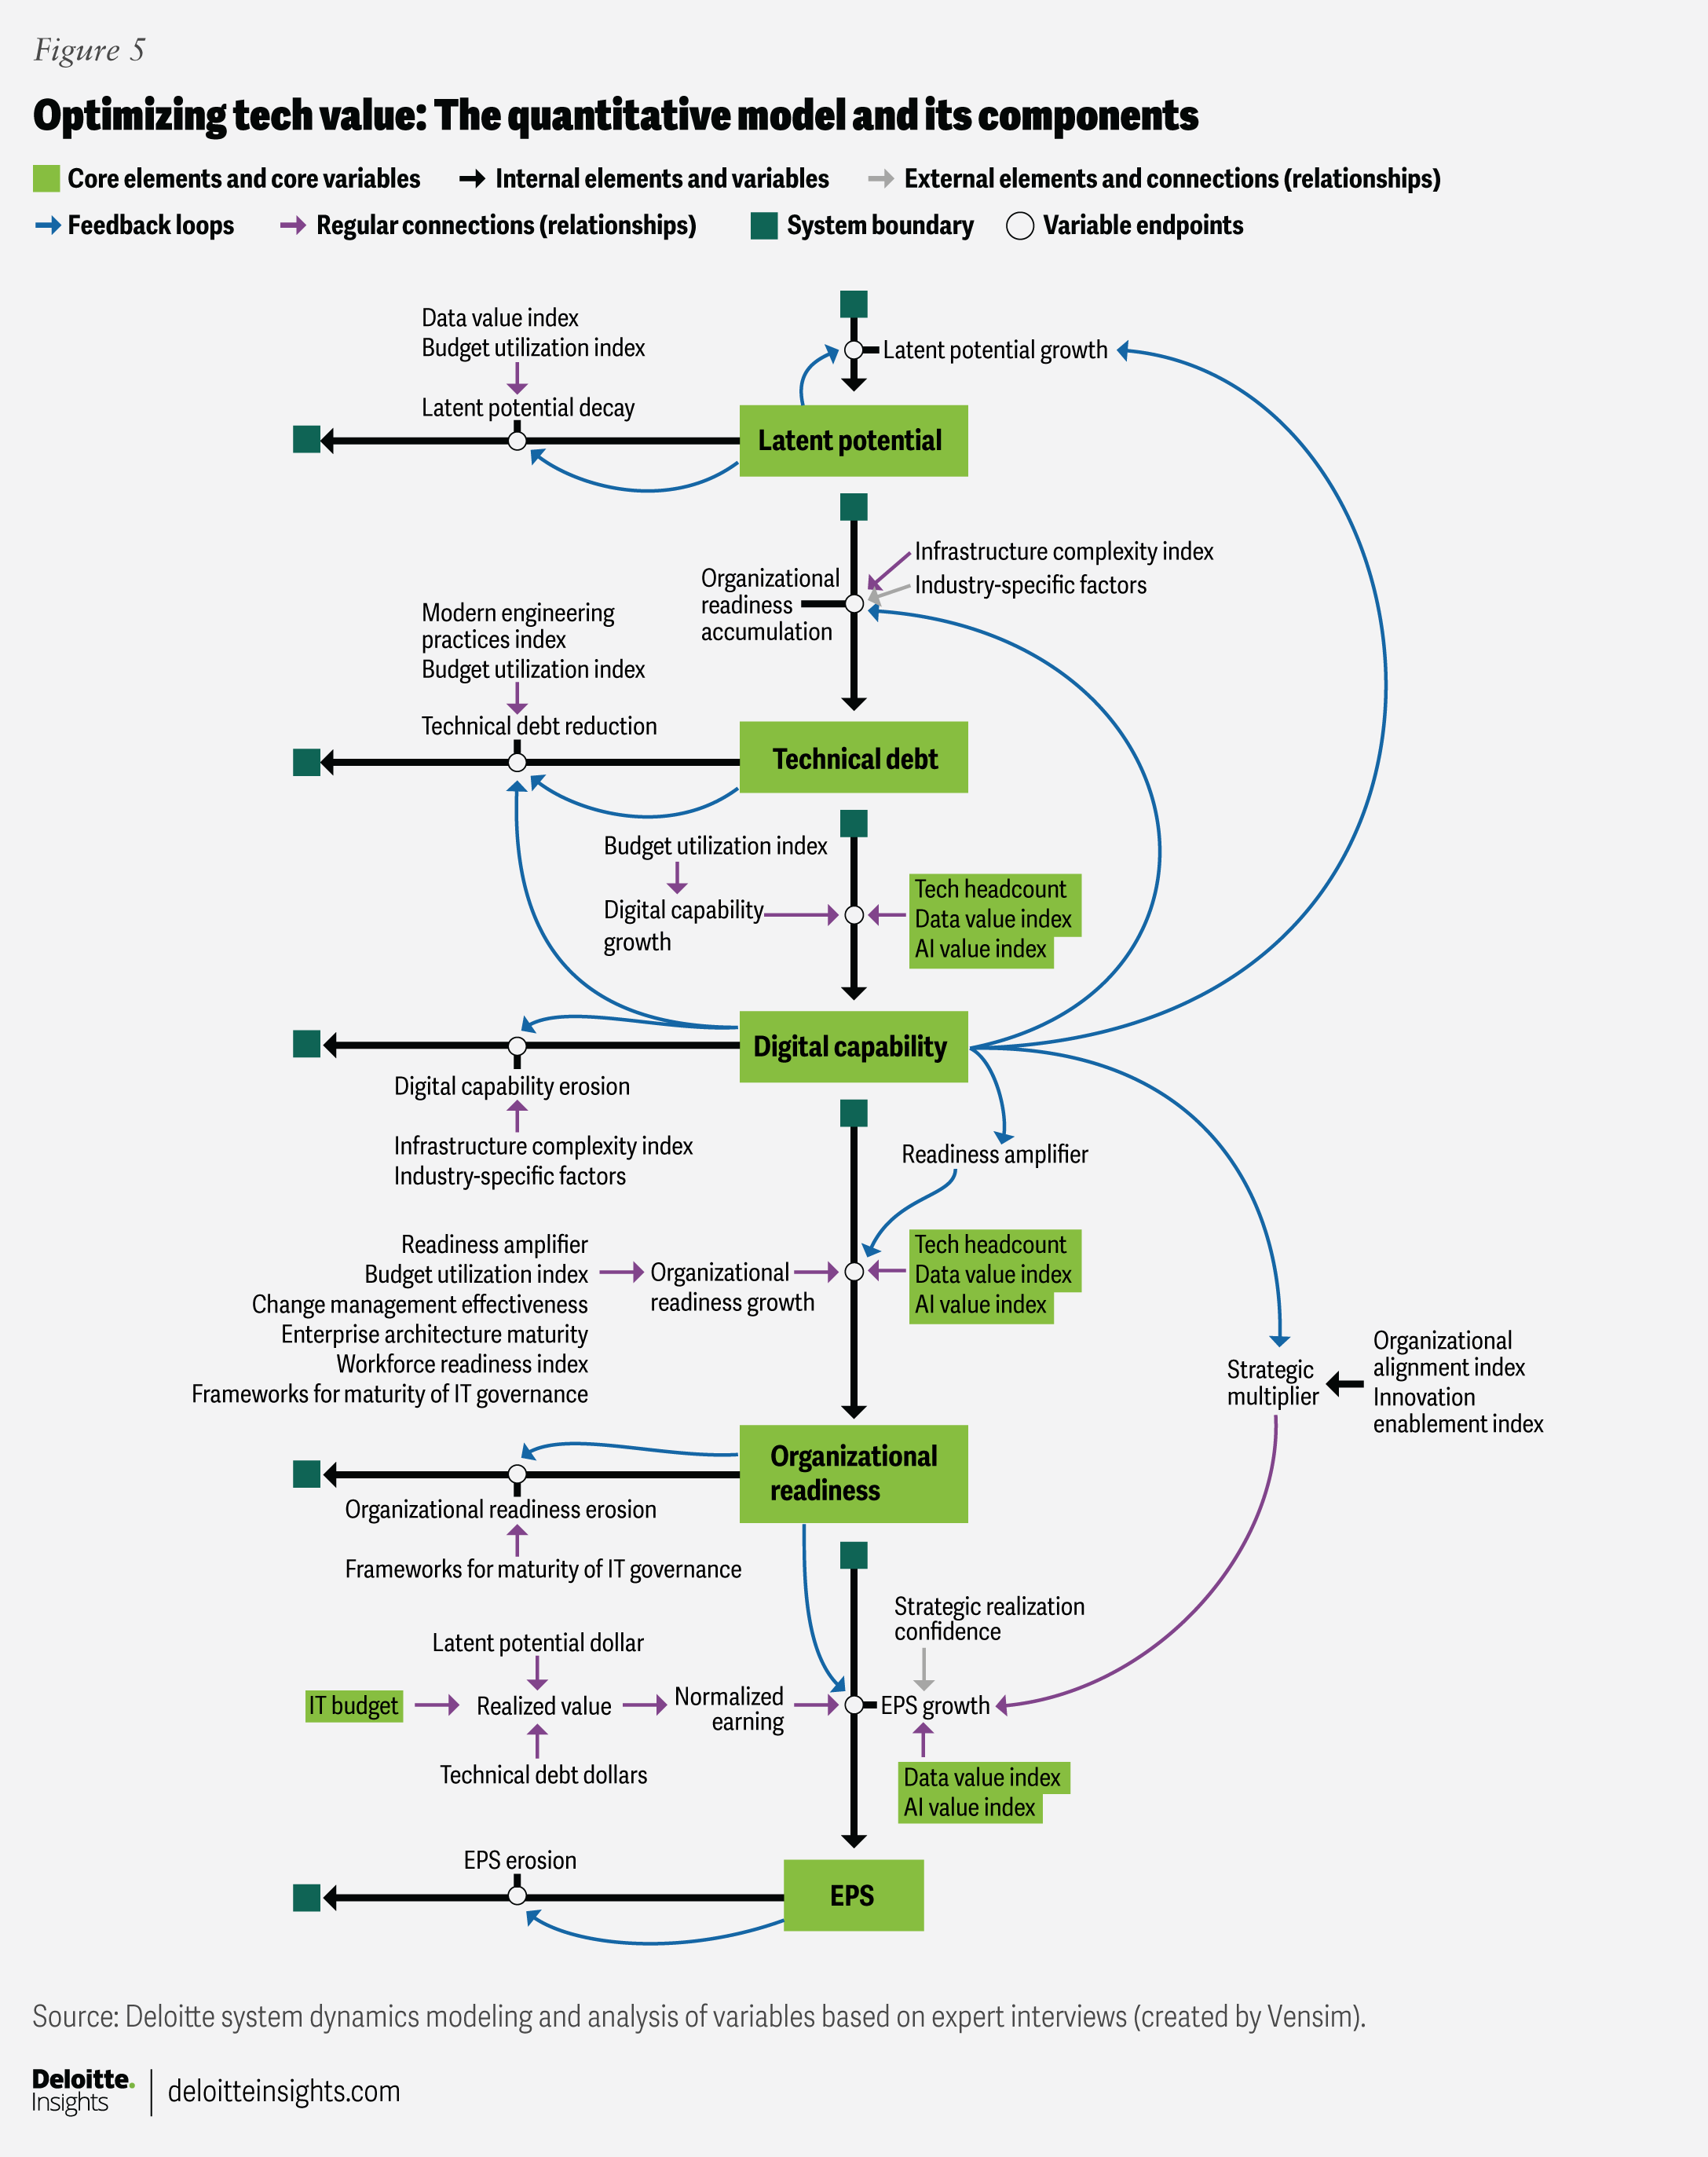
Structured qualitative interviews helped define how executives perceive the connection between technology, digital capability, and business outcomes as the foundation of the model. The model began with 63 variables, each categorized into one of three categories that define the tech estate (assets, methods, and people), ensuring that robust and representative dynamics were reflected. When reducing the model to the desired number of variables, the research team employed standard system‑reduction methods to group variables into indices reflective of a wider set of variables and factors conceptually represented by the index, resulting in 20 core variables. The model below illustrates the interactions among latent potential, technical debt, digital capability, organizational readiness, and earnings per share (EPS), showing how digital maturity and governance influence enterprise value creation (figure 5). It provides a holistic view of digital transformation dynamics, highlighting opportunities to enhance market capitalization and EPS outcomes.
Quantifying the model
The model then translated those insights into a measurable system, drawing on proprietary and public data to set the starting values and assumptions for the archetypal organization and the relational coefficients that define the system as it stands today. For the financial measures, Deloitte standardized the analysis to average EPS values, in aggregate, across the S&P 500 from January 2023 to July 2025, as well as average growth and decline measures.
Additionally, Deloitte ran sensitivity analyses to test the system’s resilience under uncertainty. Industry variations in digital capability moderately impacted the growth pace and potential, while differences in the realization of confidence revealed that delivery discipline has a strong influence on EPS and market capitalization, underscoring leadership’s role in sustaining value.
Simulating the system dynamics of an intervention
The objective of the research was to understand how changes (interventions) in technology strategy impact key components of the model. This was achieved by using SD modeling software to simulate the impact of a defined set of interventions on system dynamics.
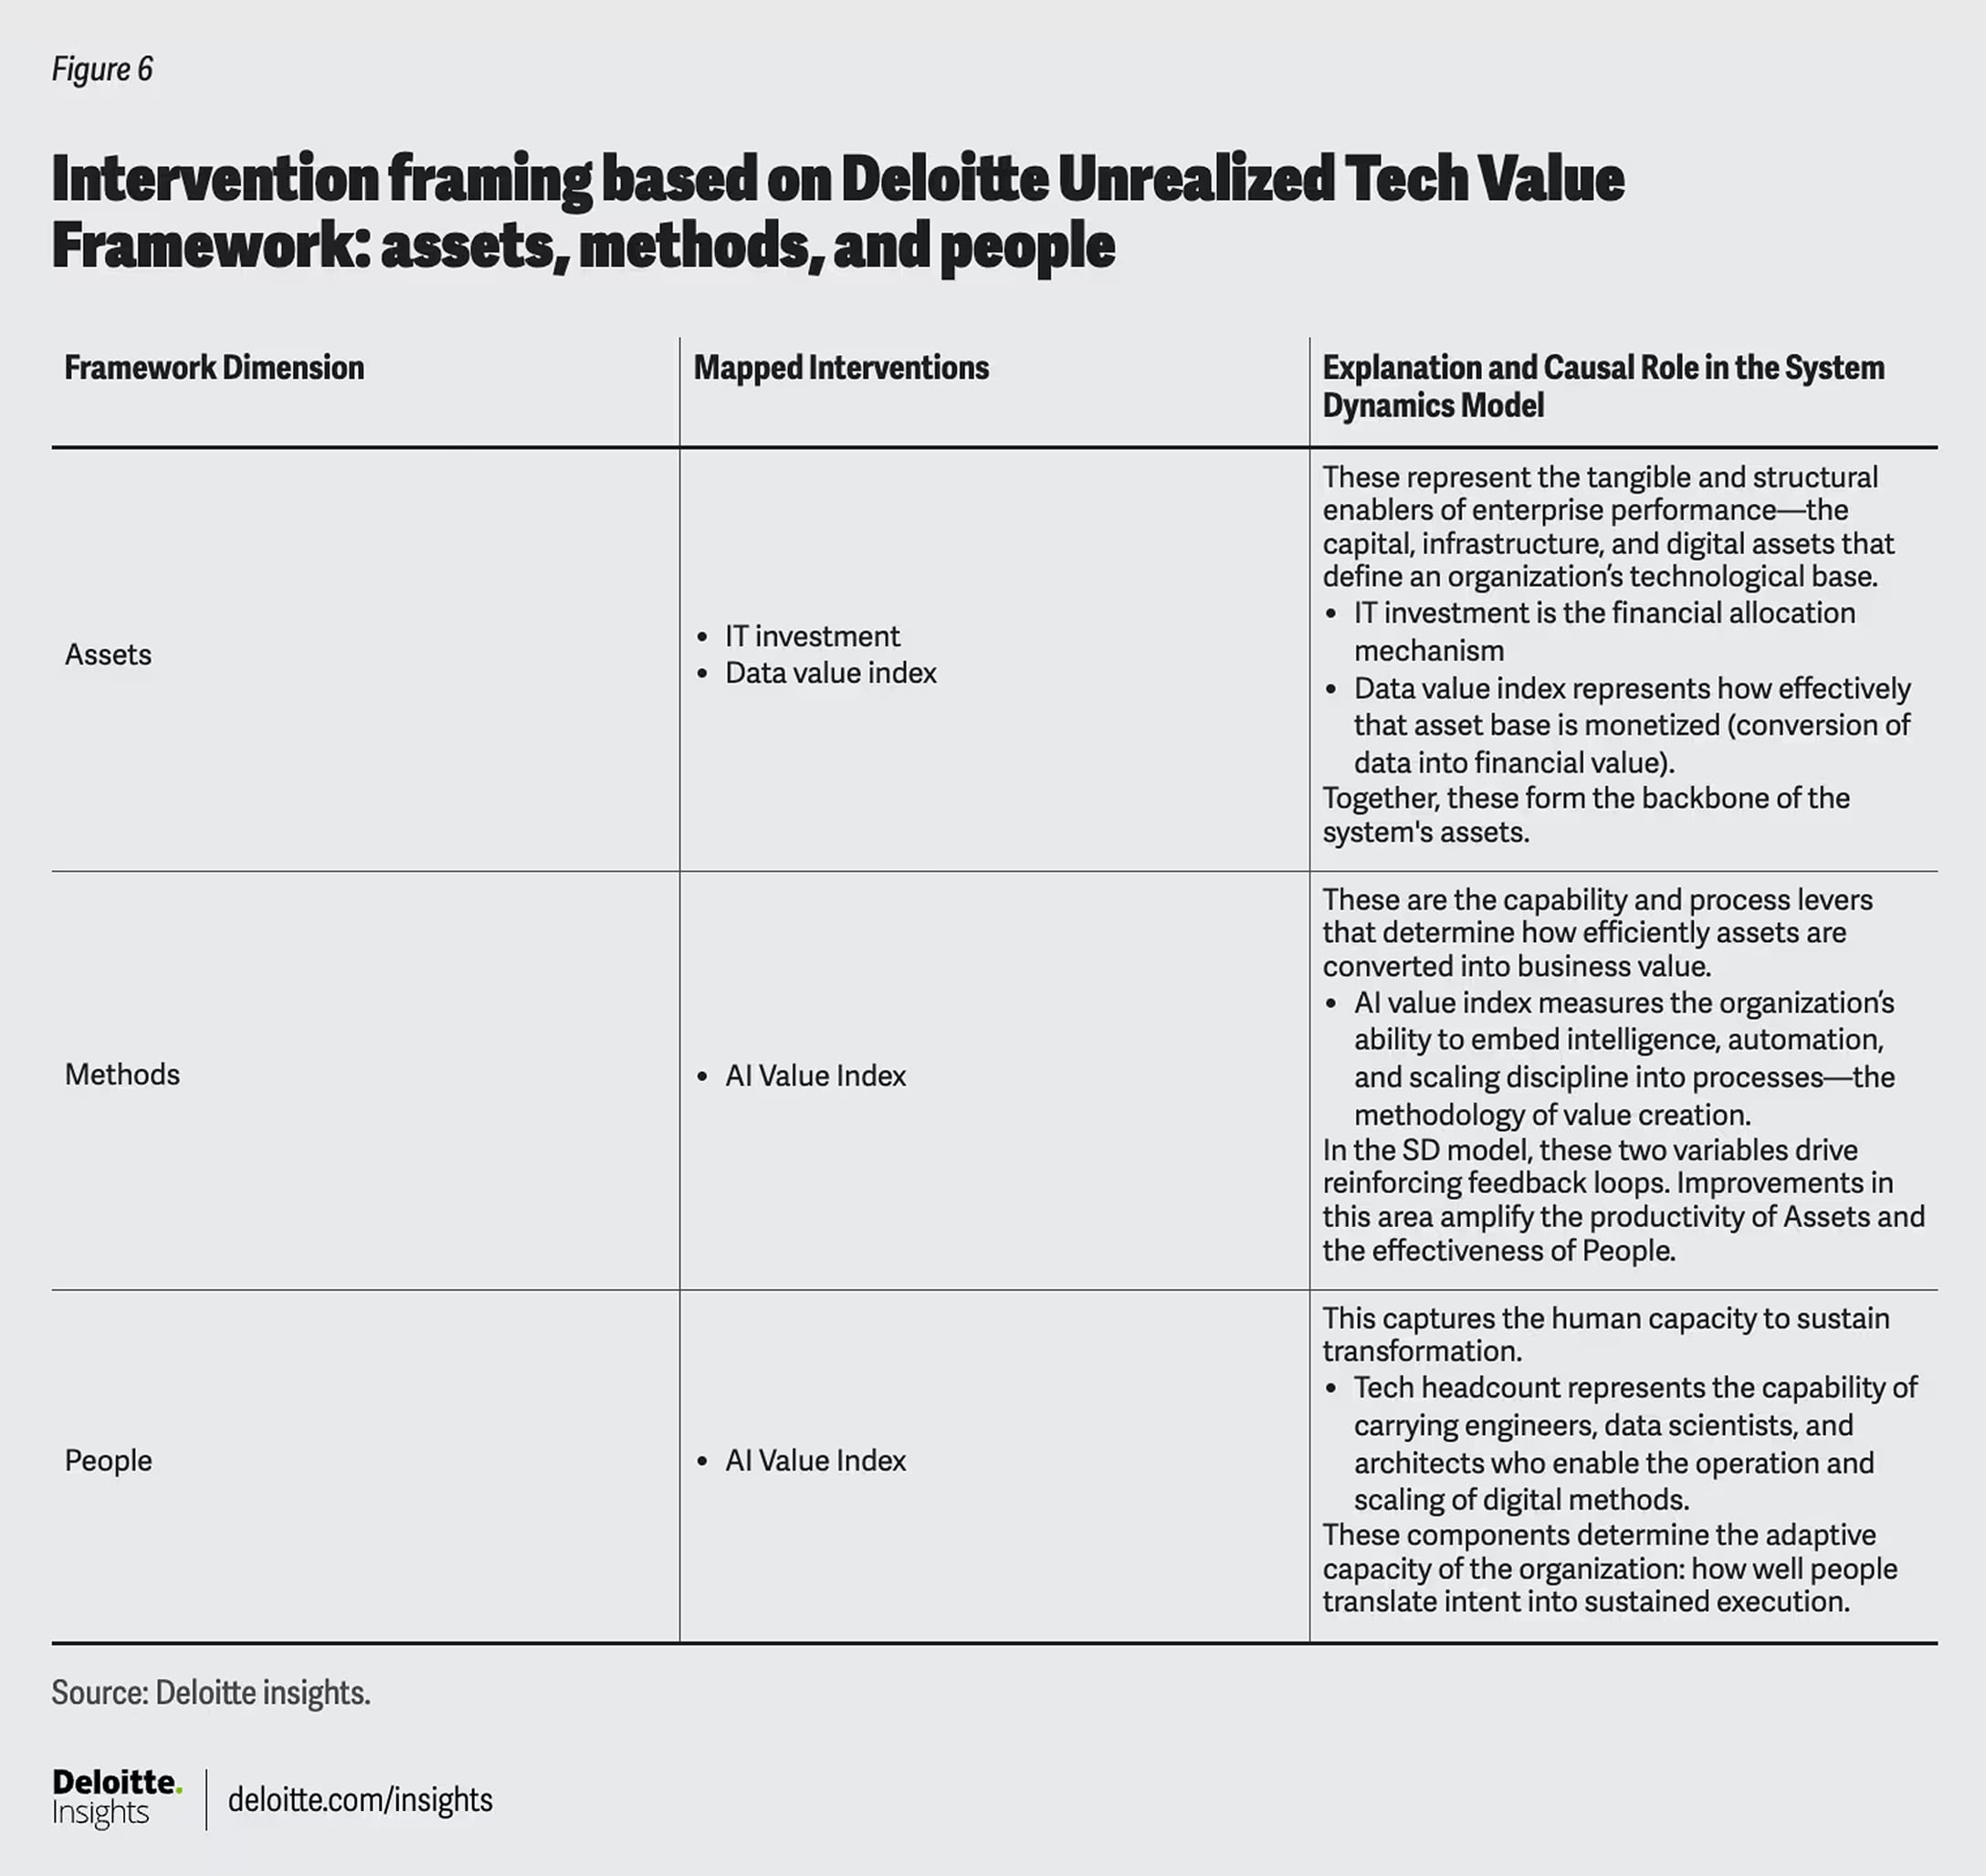
The four interventions (IT investment, AI value index, data value index, and tech headcount) were chosen because they represent the strongest points of leverage on financial performance. These interventions were framed under the asset/method/people framework, as explained below (figure 614).
Continue the Conversation
Meet the industry leaders
Subodh Chitre
Alison Cuffari
Tarun Sharma
Diana Kearns-Manolatos
Monika Mahto
Ahmed Alibage
by
Subodh Chitre
Alison Cuffari
Tarun Sharma
Ahmed Alibage
Diana Kearns-Manolatos
Monika Mahto
The authors would like to thank Louis DiLorenzo Jr. for his support and guidance, which were pivotal in framing the research article and the direction of the storytelling.
We would also like to thank Tim Smith, Nikhil Roychowdhury, Michael Wilson, Mike Caplan, and Sid Seshadri for their valuable insight and knowledge-sharing which have been pivotal in shaping the core model.
We extend our appreciation to the marketing team, Akshay Poojari, Ireen Jose, and Saurabh Rijhwani, for their guidance and leadership in amplifying the impact of these insights.
We are grateful to the Deloitte Insights team, including Annalyn Kurtz and Corrie Commisso for their editorial input and Blythe Hurley and Prodyut Borah for their production support.
Editorial (including production and copyediting): Corrie Commisso, Annalyn Kurtz, Prodyut Borah, Pubali Dey, and Cintia Cheong
Design: Alexis Werbeck and Molly Piersol
Audience development: Pooja Boopathy
Cover artist: Steffanie Lorig; Adobe Stock
Knowledge services: Vanapalli Viswa Teja
Visit the Deloitte Center for Integrated Research
Access more insights on some of the most complex issues facing businesses today.