AI is capturing the digital dollar. What’s left for the rest of the tech estate?
Deloitte’s 2025 Tech Value Survey finds AI capturing a growing share of digital budgets—raising questions about whether enterprises are keeping technology investments in balance.
Last year, artificial intelligence and data emerged as the centerpieces of digital strategy. This year, they’re not just leading—they’re outpacing every other technology, drawing on budgets at a rate that leaves little for others.
Deloitte’s 2025 tech value survey of nearly 550 leaders across five industries draws on four years of research, leveraging longitudinal data, cluster analysis, and predictive modeling to reveal distinct patterns in technology spending and value realization (see methodology).
This year’s findings show that while respondents have increased their overall digital investment budgets, they are becoming more selective about where those dollars go. Out of the 20 technology capabilities we tracked, AI and generative AI were the clear front-runners, with 74% of surveyed organizations reporting investments in those capabilities over the past year. That’s nearly 20 percentage points higher than the next most popular areas among respondents—data management, cloud platforms, Internet of Things, and enterprise resource planning technologies.
Budgets appear to be consolidating around AI, while investment in foundational capabilities continues to erode. Yet no single technology can carry enterprise value alone. Many leaders face a choice: fuel AI at the expense of other tech foundations or expand digital budgets to support the full tech stack as it scales.
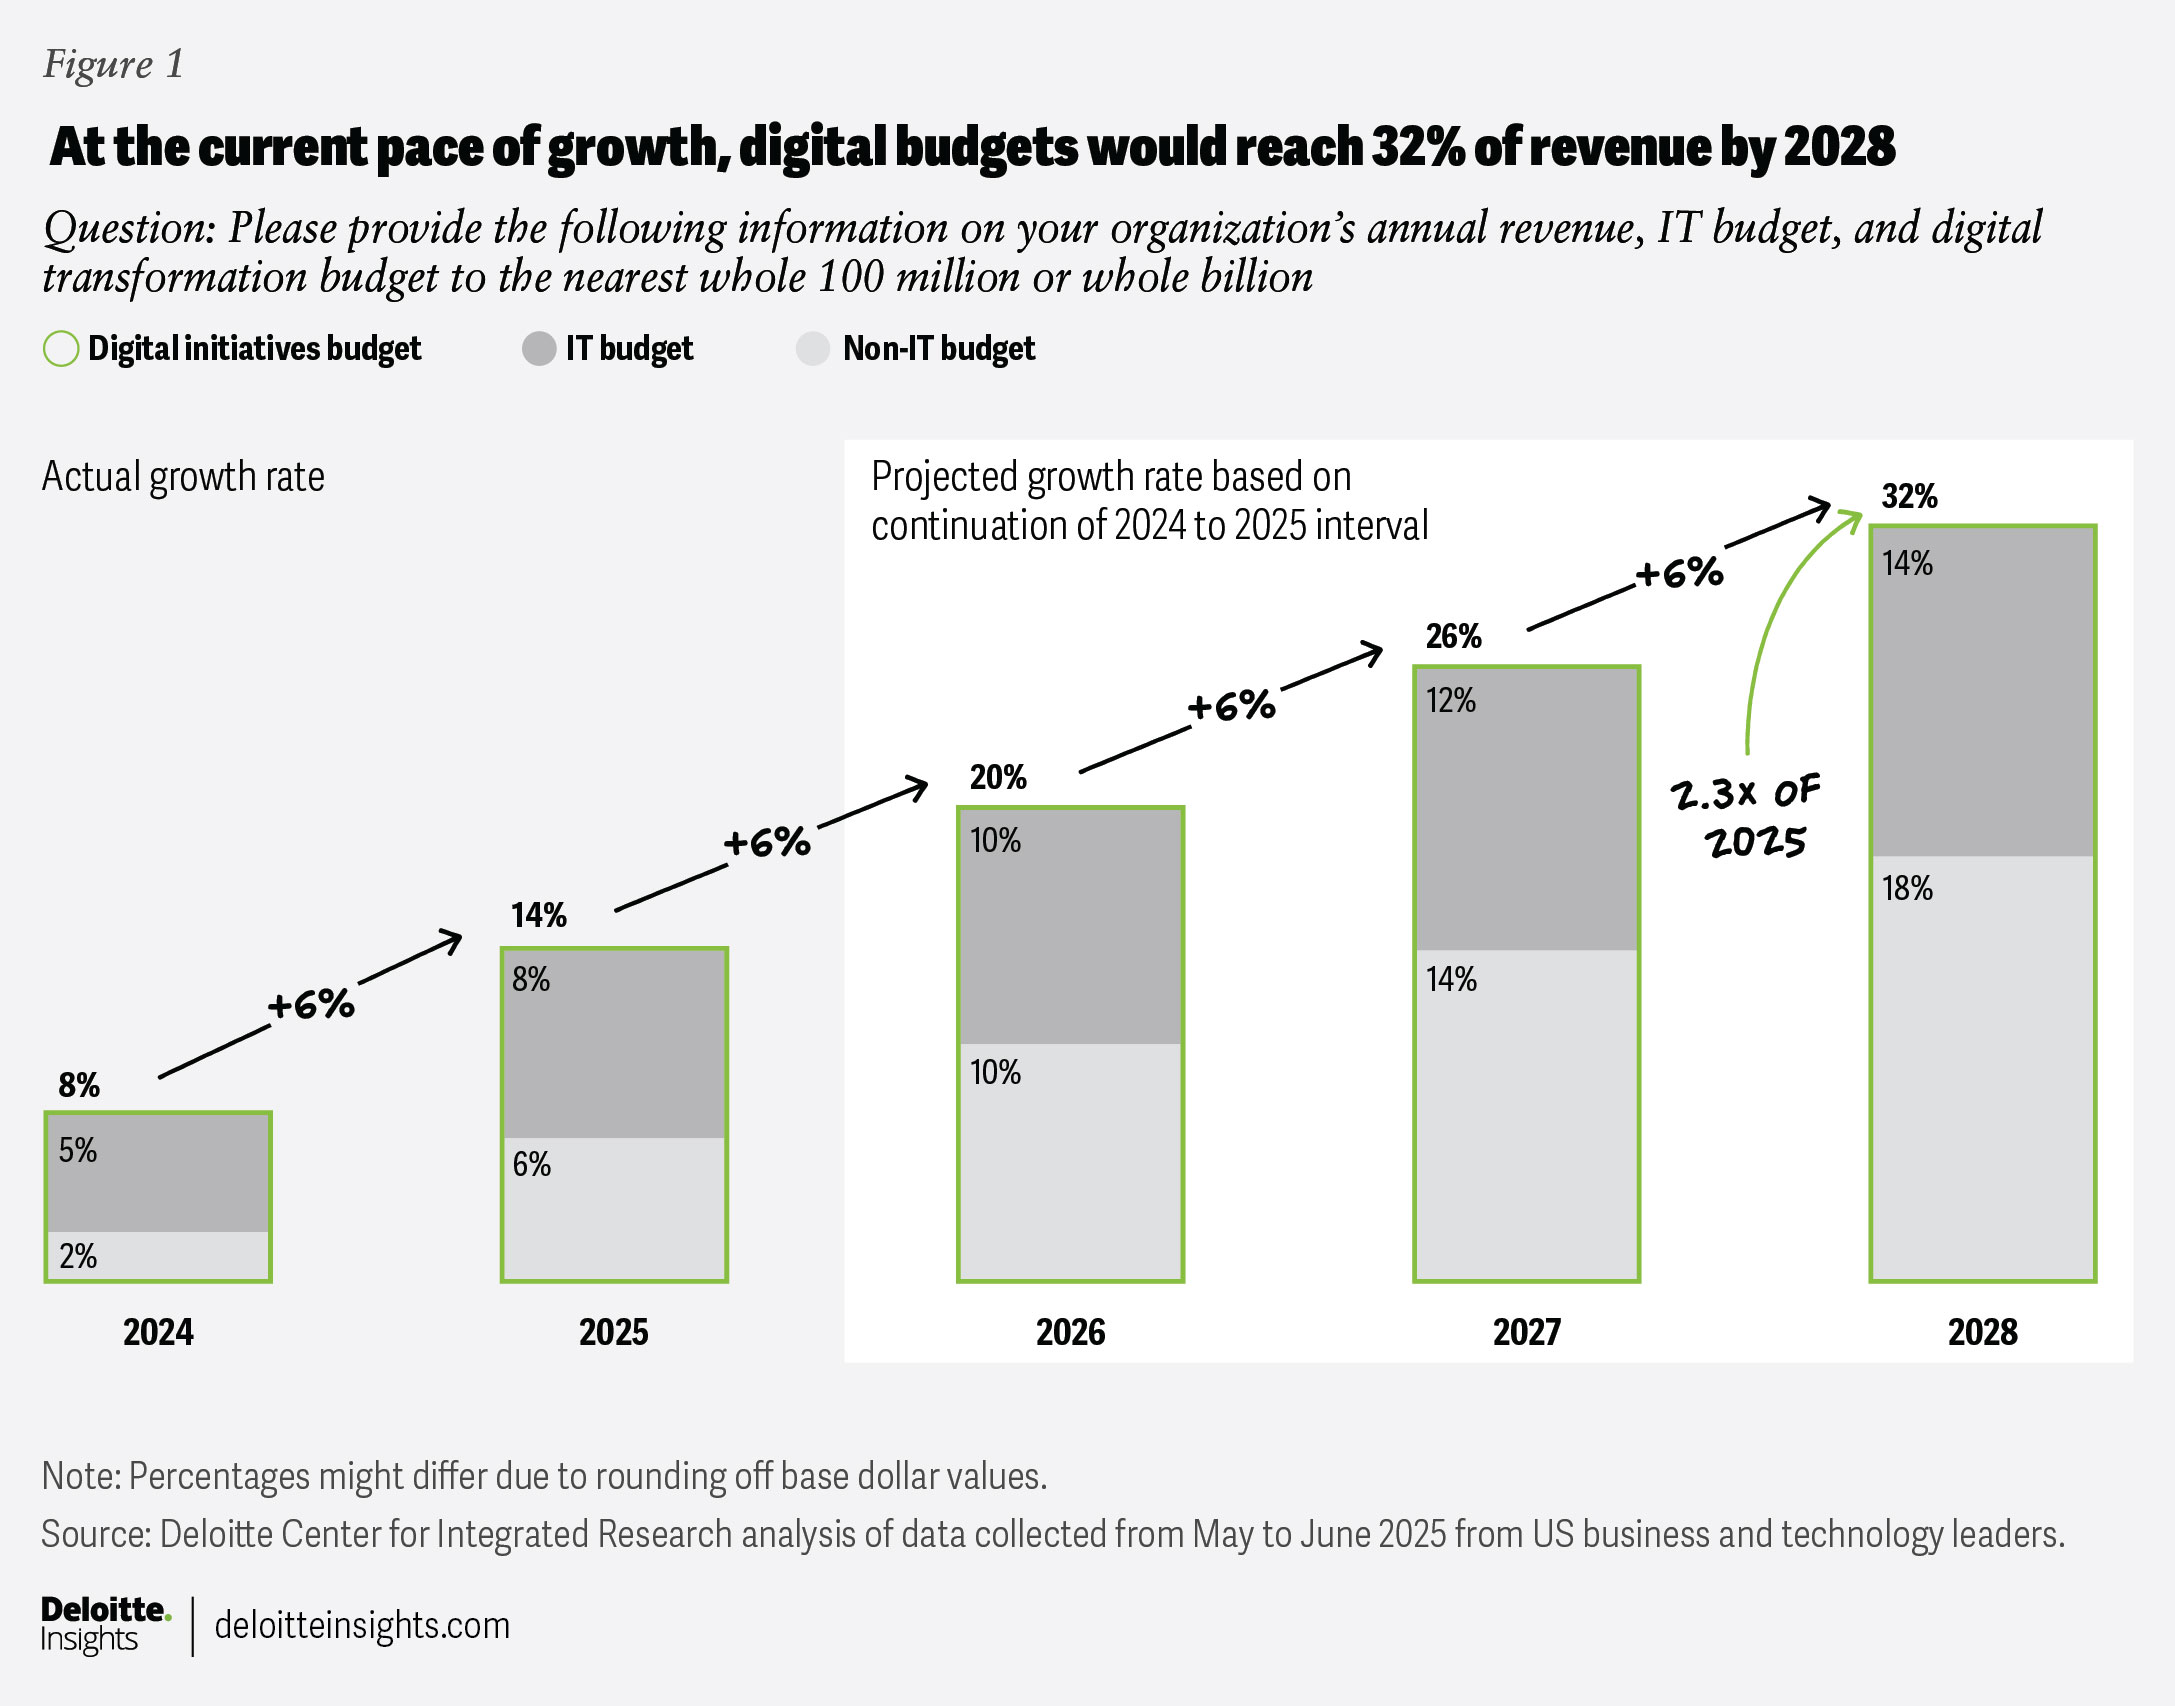
For businesses to succeed, digital budgets will likely need to increase, even as leaders look to manage costs. The magnitude of these increases will likely vary by organization, but assuming the current pace simply continues—with Deloitte’s survey data showing technology budgets rising from 8% of revenue in 2024 to 14% in 2025, and increasing by 6 percentage points each year thereafter—organizations would see their digital budgets reach 32% of revenue by 2028. That’s 2.3 times the 2025 level if growth remains steady. This continuous growth could help better sustain the rising demand across the broader tech ecosystem (figure 1).
Collectively, our analysis identifies key insights that can help maximize value: rethinking digital initiative budgets, expanding value measurements beyond tech return on investment, gaining leadership alignment on priorities, and overcoming a rising tide of challenges through proven success factors—cyber resilience, an aligned digital strategy, and dedicated leadership. These insights can help leaders act for impact.
Digital initiative budgets are up, but is it enough?
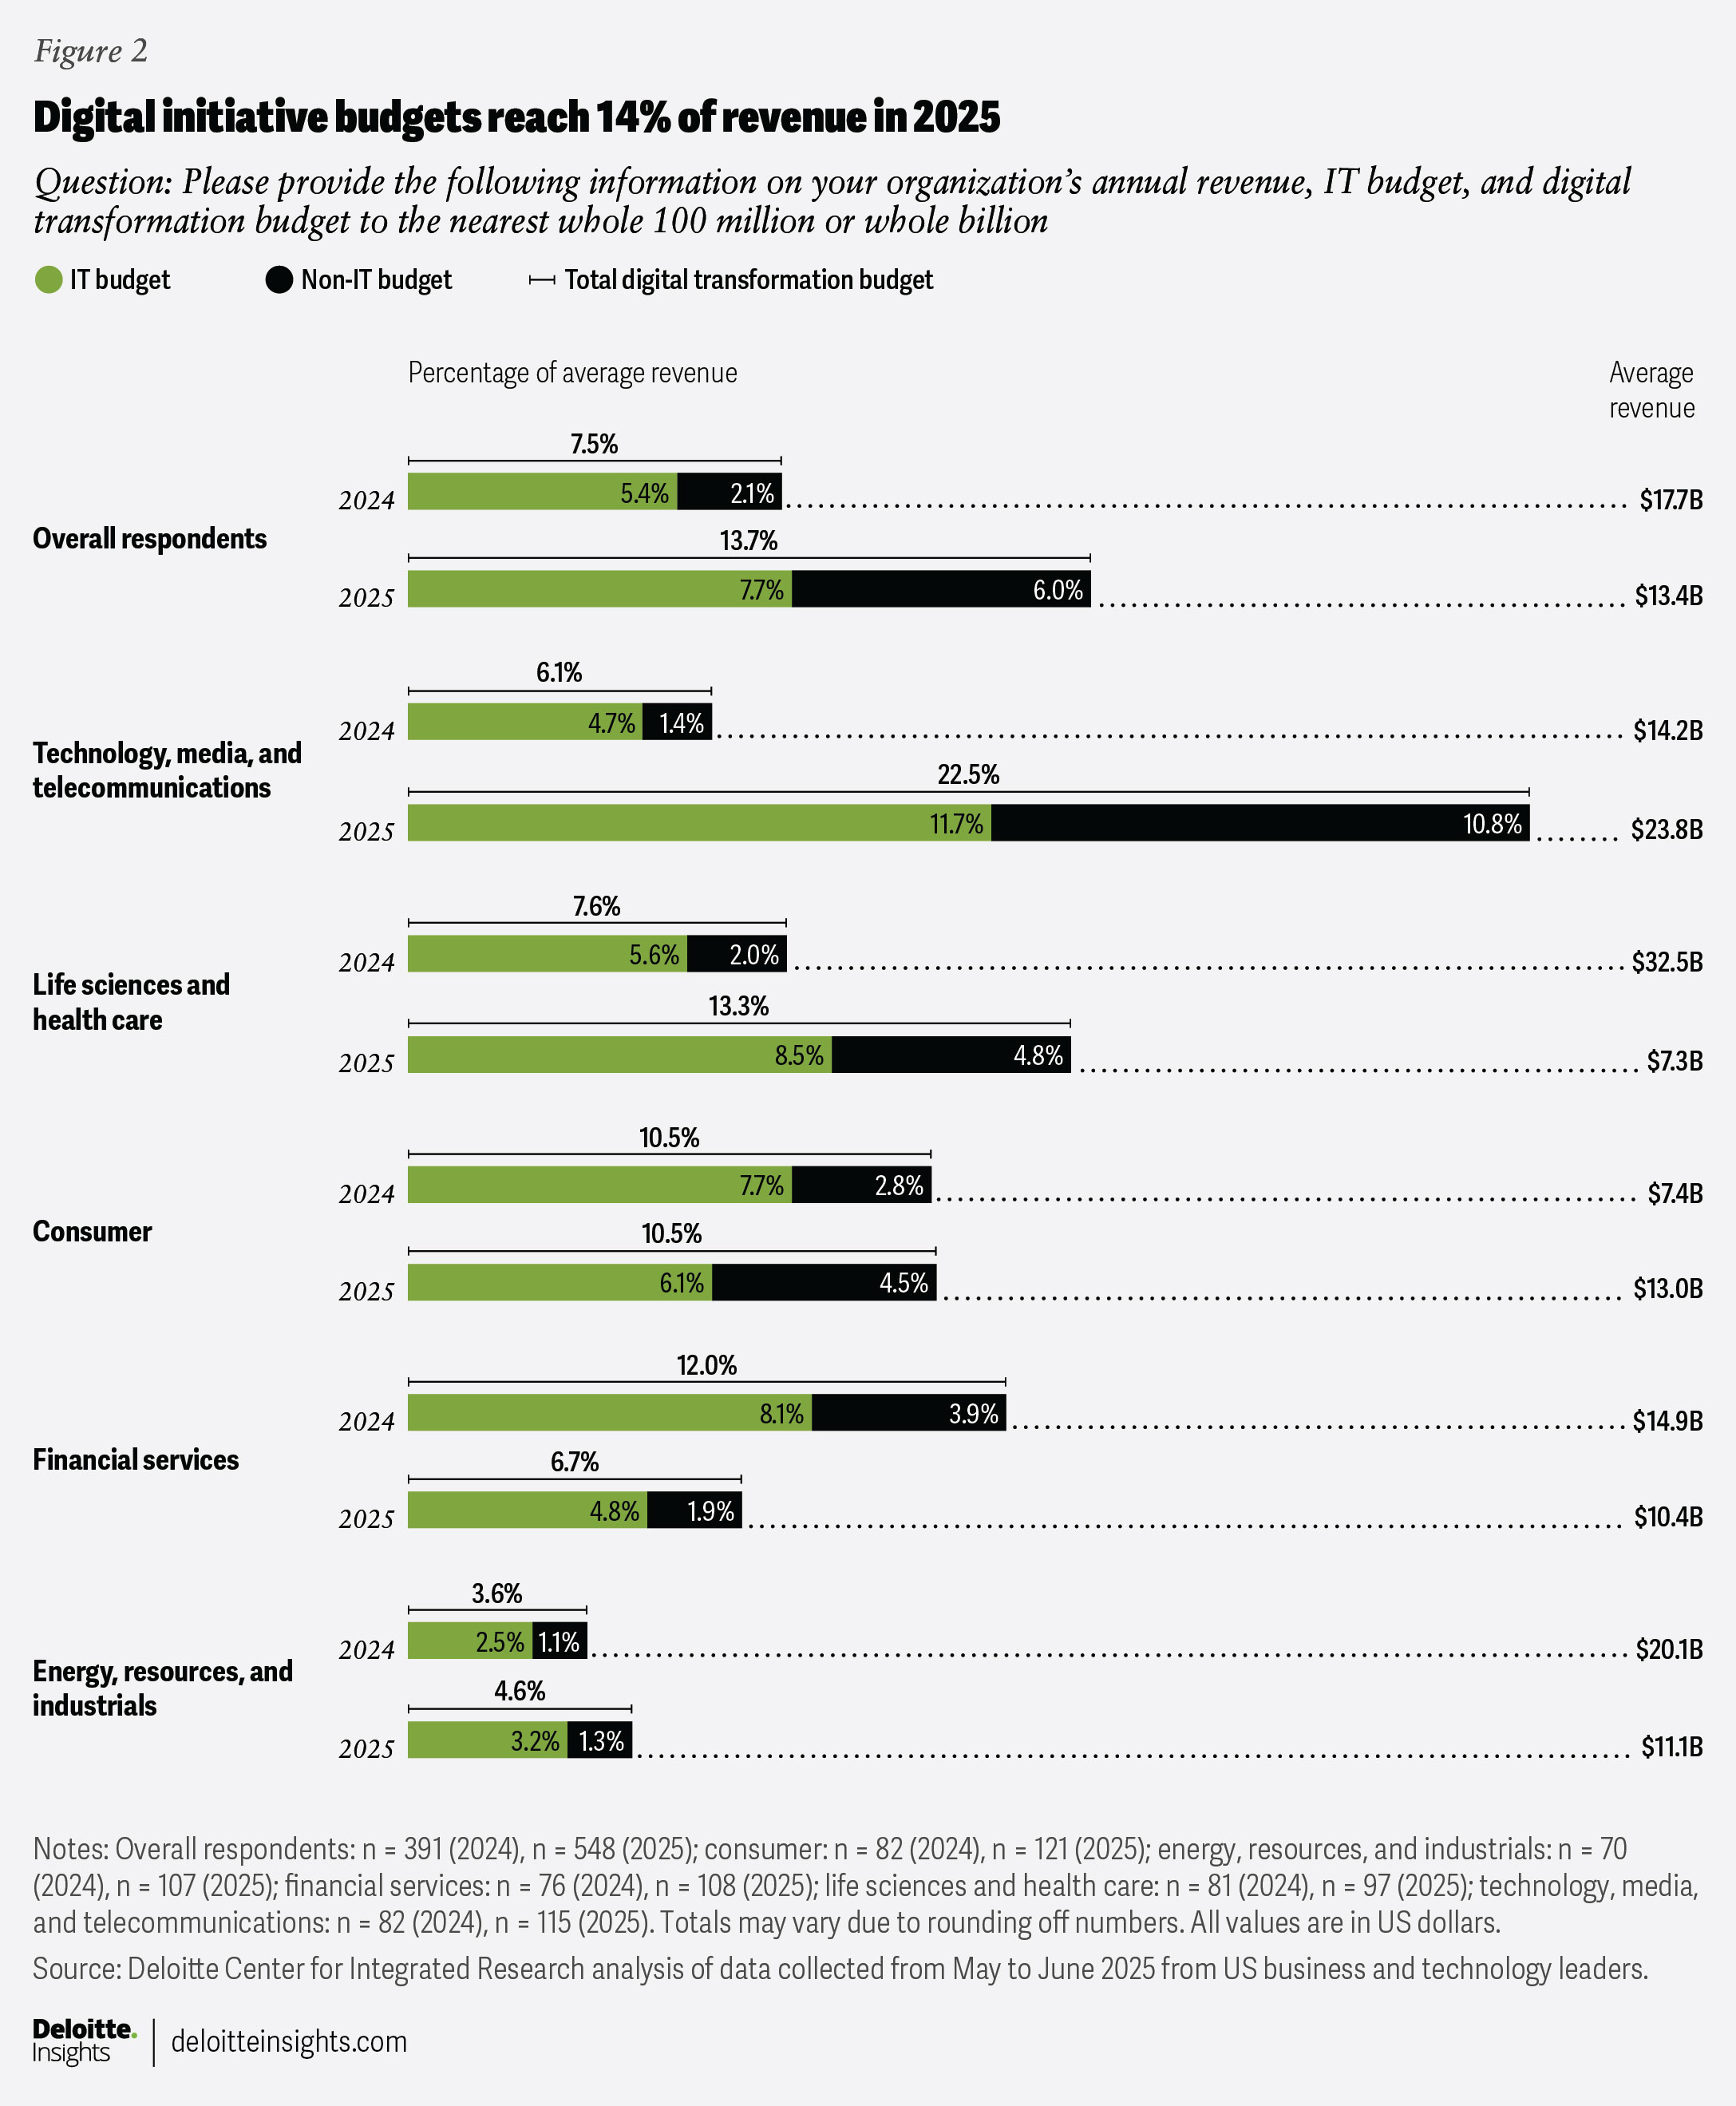
For the past two years, this survey has tracked technology and business budgets allocated to digital initiatives across industries. In 2025, the digital budget among surveyed organizations with US$13.4 billion in average revenue was US$1.8 billion. This marks an increase from 7.5% of revenue in 2024 to 13.7% in 2025 (figure 2).
While it’s encouraging to see that organizations are investing more in digital initiatives, are budget increases keeping pace with strategic priorities?
Although organizations’ specific tech investments have evolved—recently tilting toward AI—their overarching strategies and priorities have remained largely unchanged across the five digital strategies (figure 3).
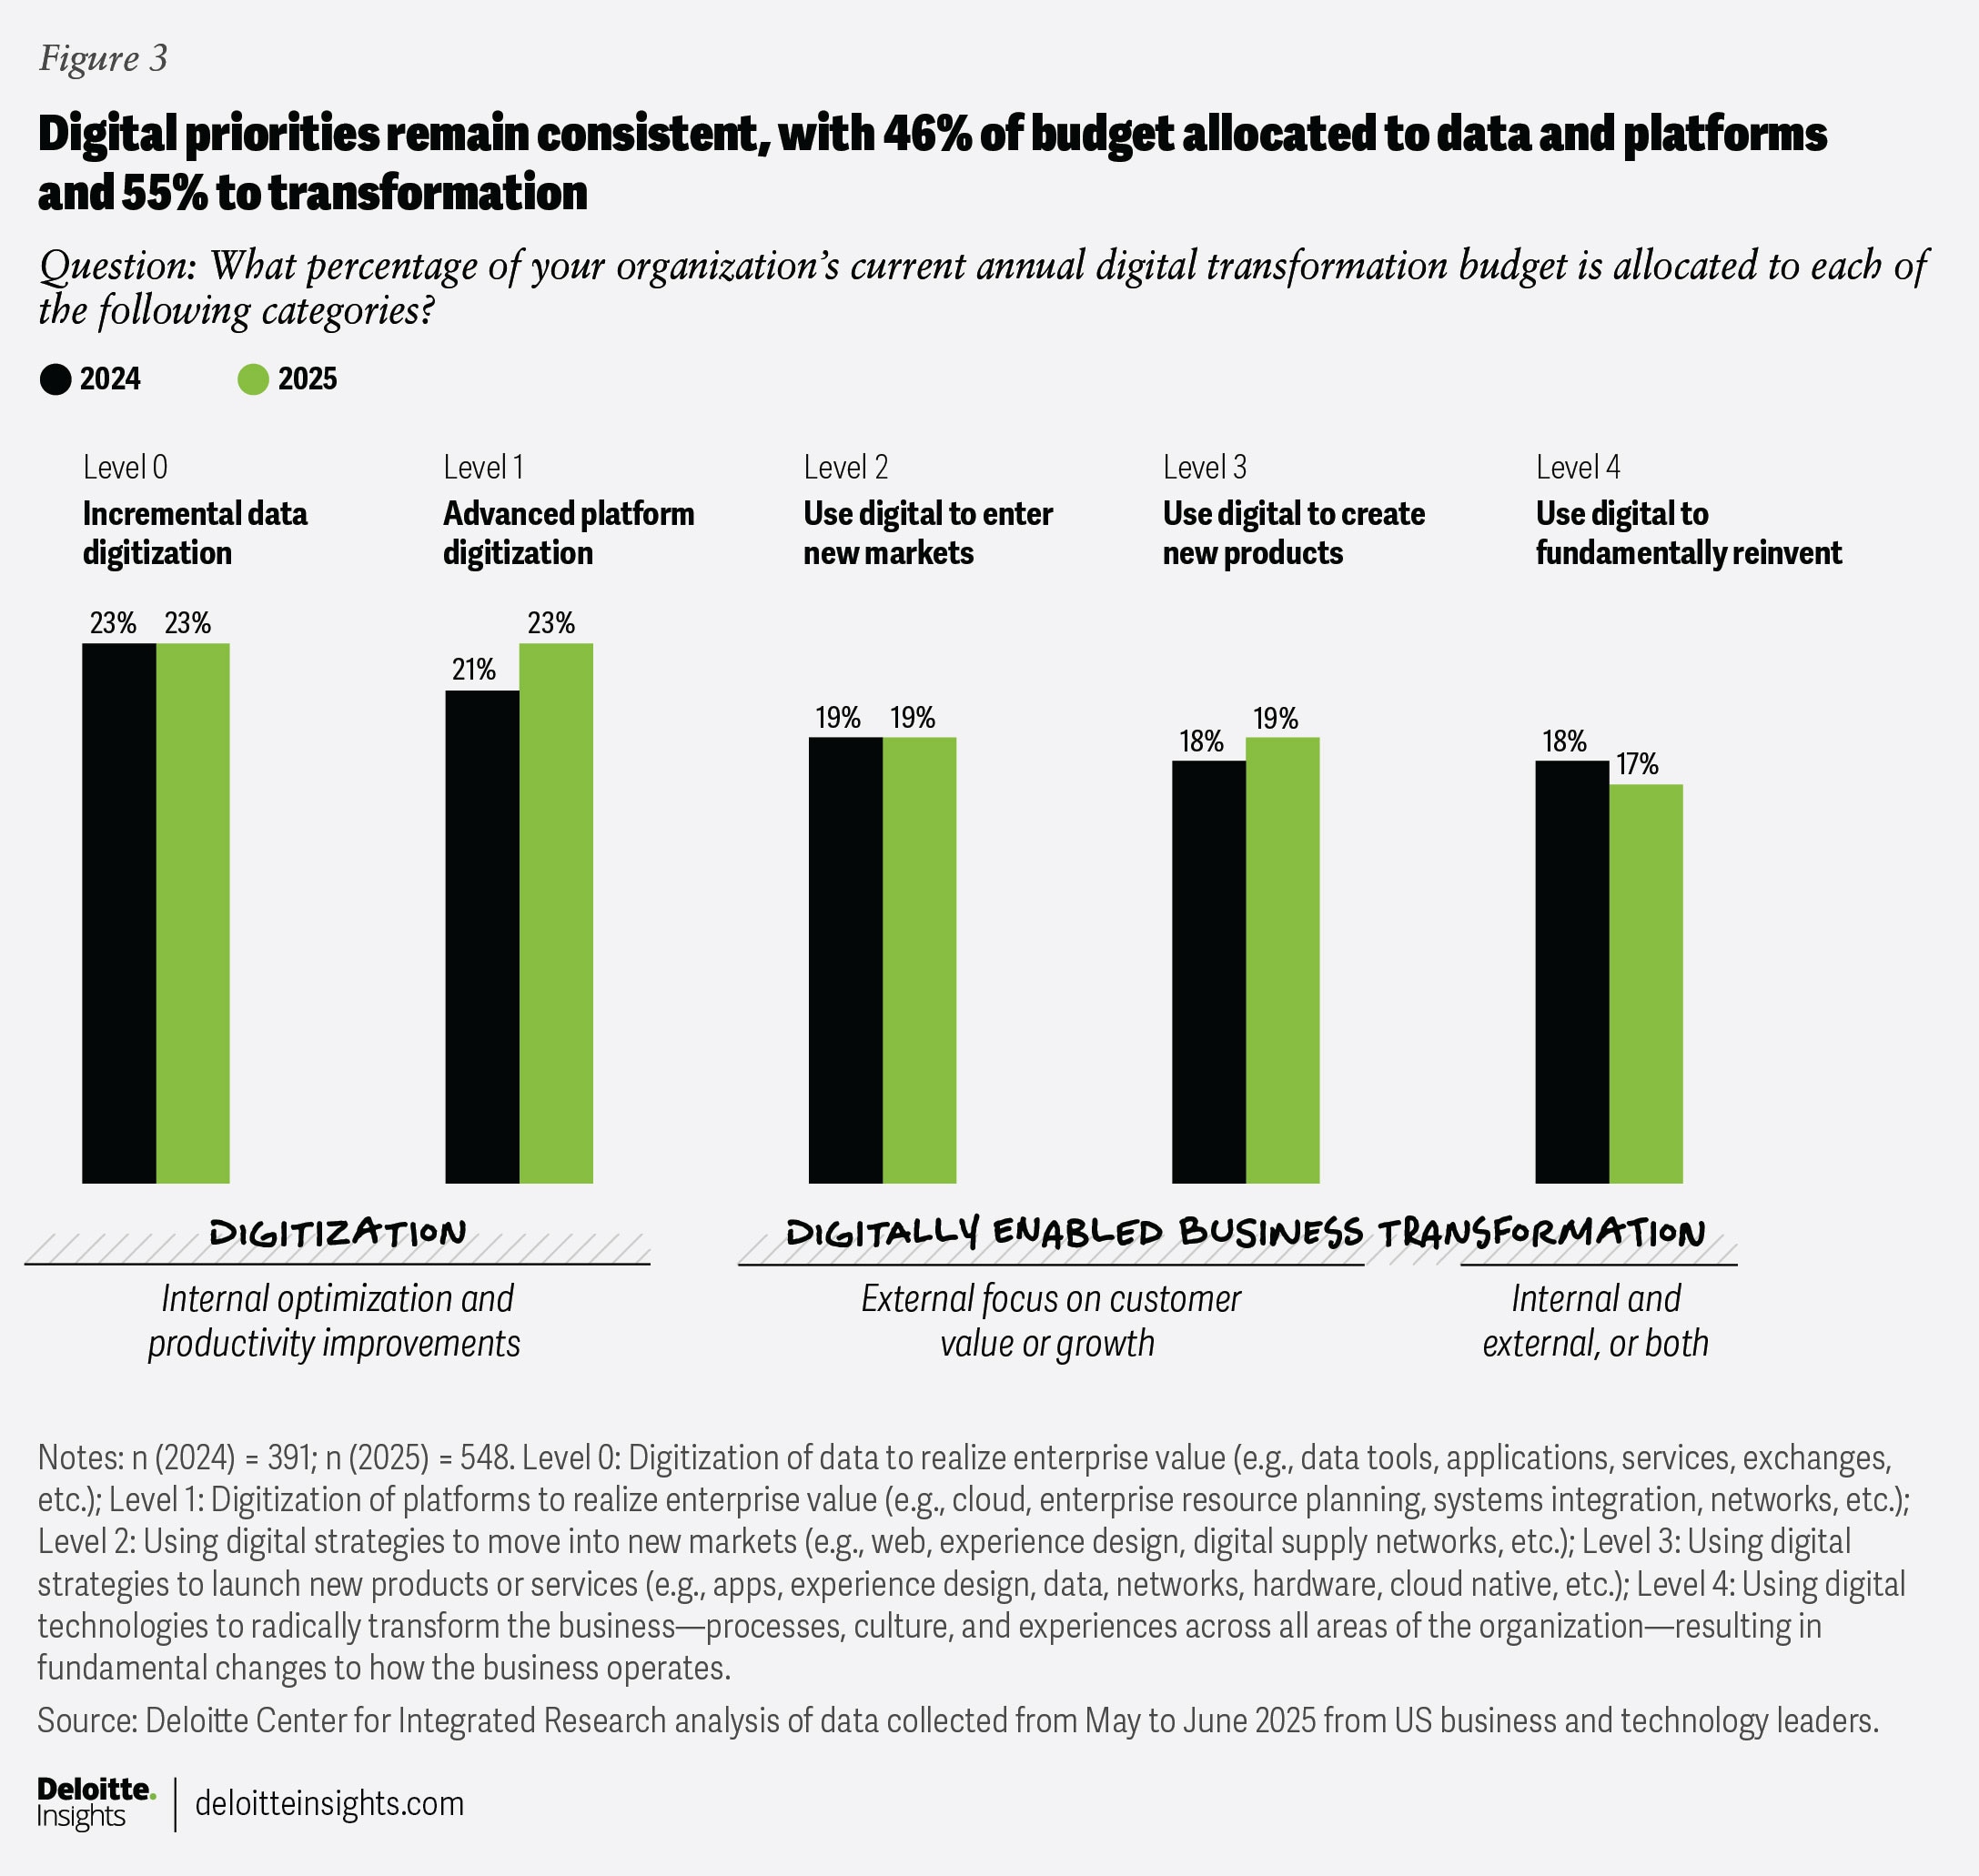
In 2025, a little less than half (46%) of digital initiative budgets are allocated to digitizing data and platforms (up from 44% in 2024), while a little more than half (55%) are allocated to digital transformation priorities, such as entering new markets, launching new products, and transforming the business. This is largely unchanged from the digital priorities respondents identified in 2024.
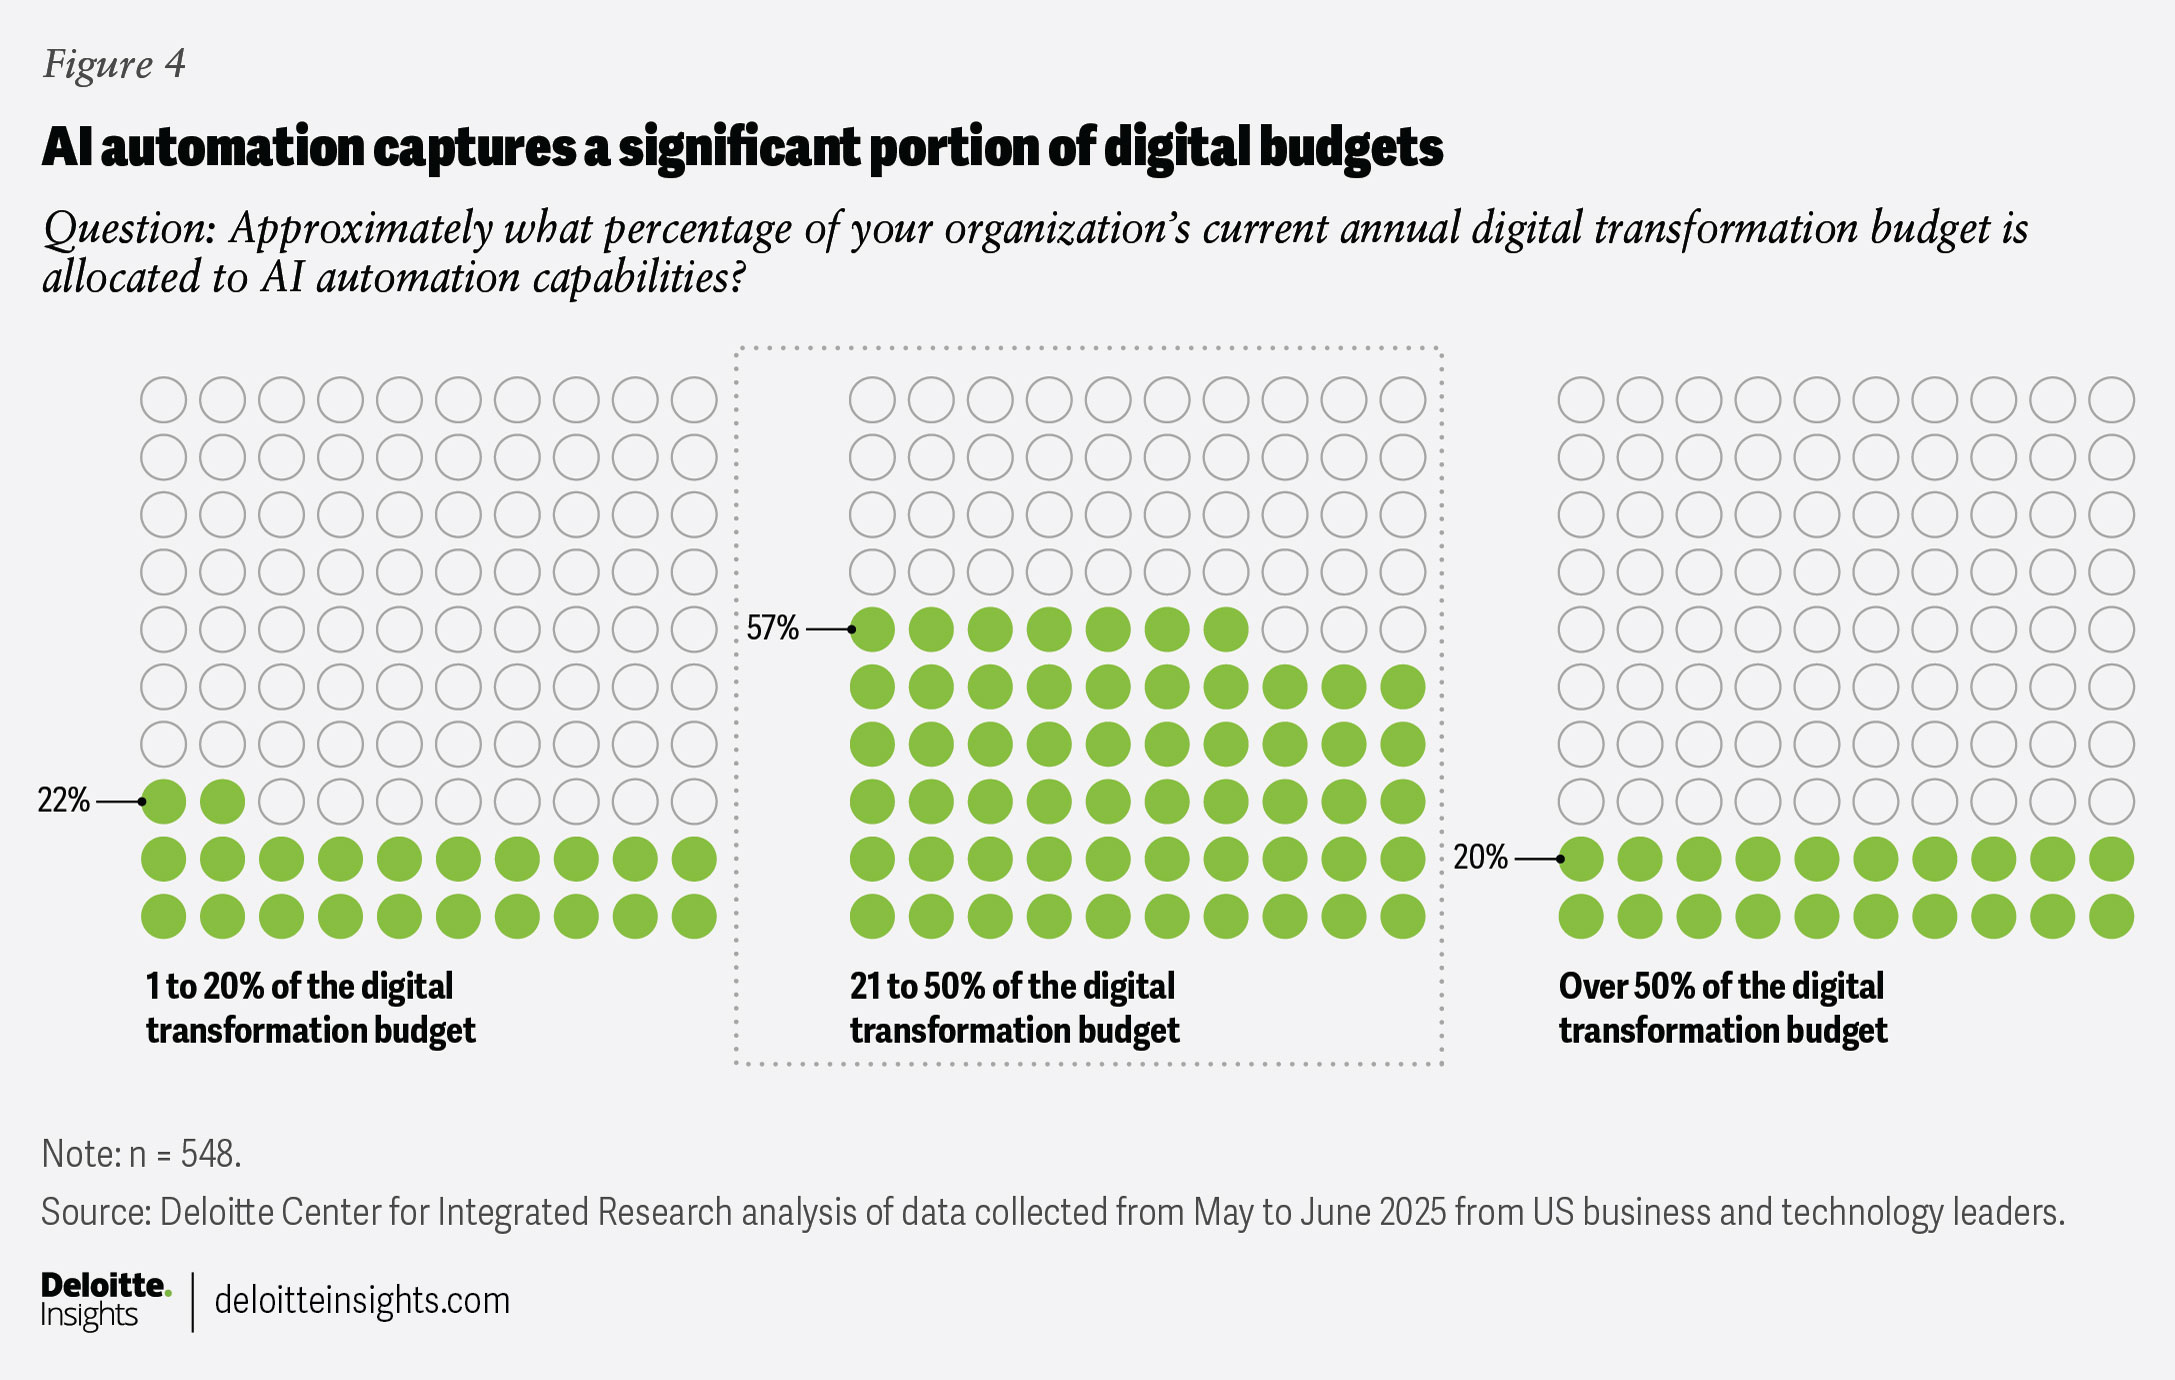
But beneath this apparent balance in strategic priorities, the actual spending tells a more nuanced story. AI automation is capturing a significant share of digital budgets relative to everything else: more than half of respondents now allocate between 21% and 50% (an average of 36%) of their digital initiative budgets to AI. This equates to about US$700 million for a company with US$13 billion in revenue (figure 4).
As a result, expanding budgets are not yet translating into broader tech investment (figure 5).
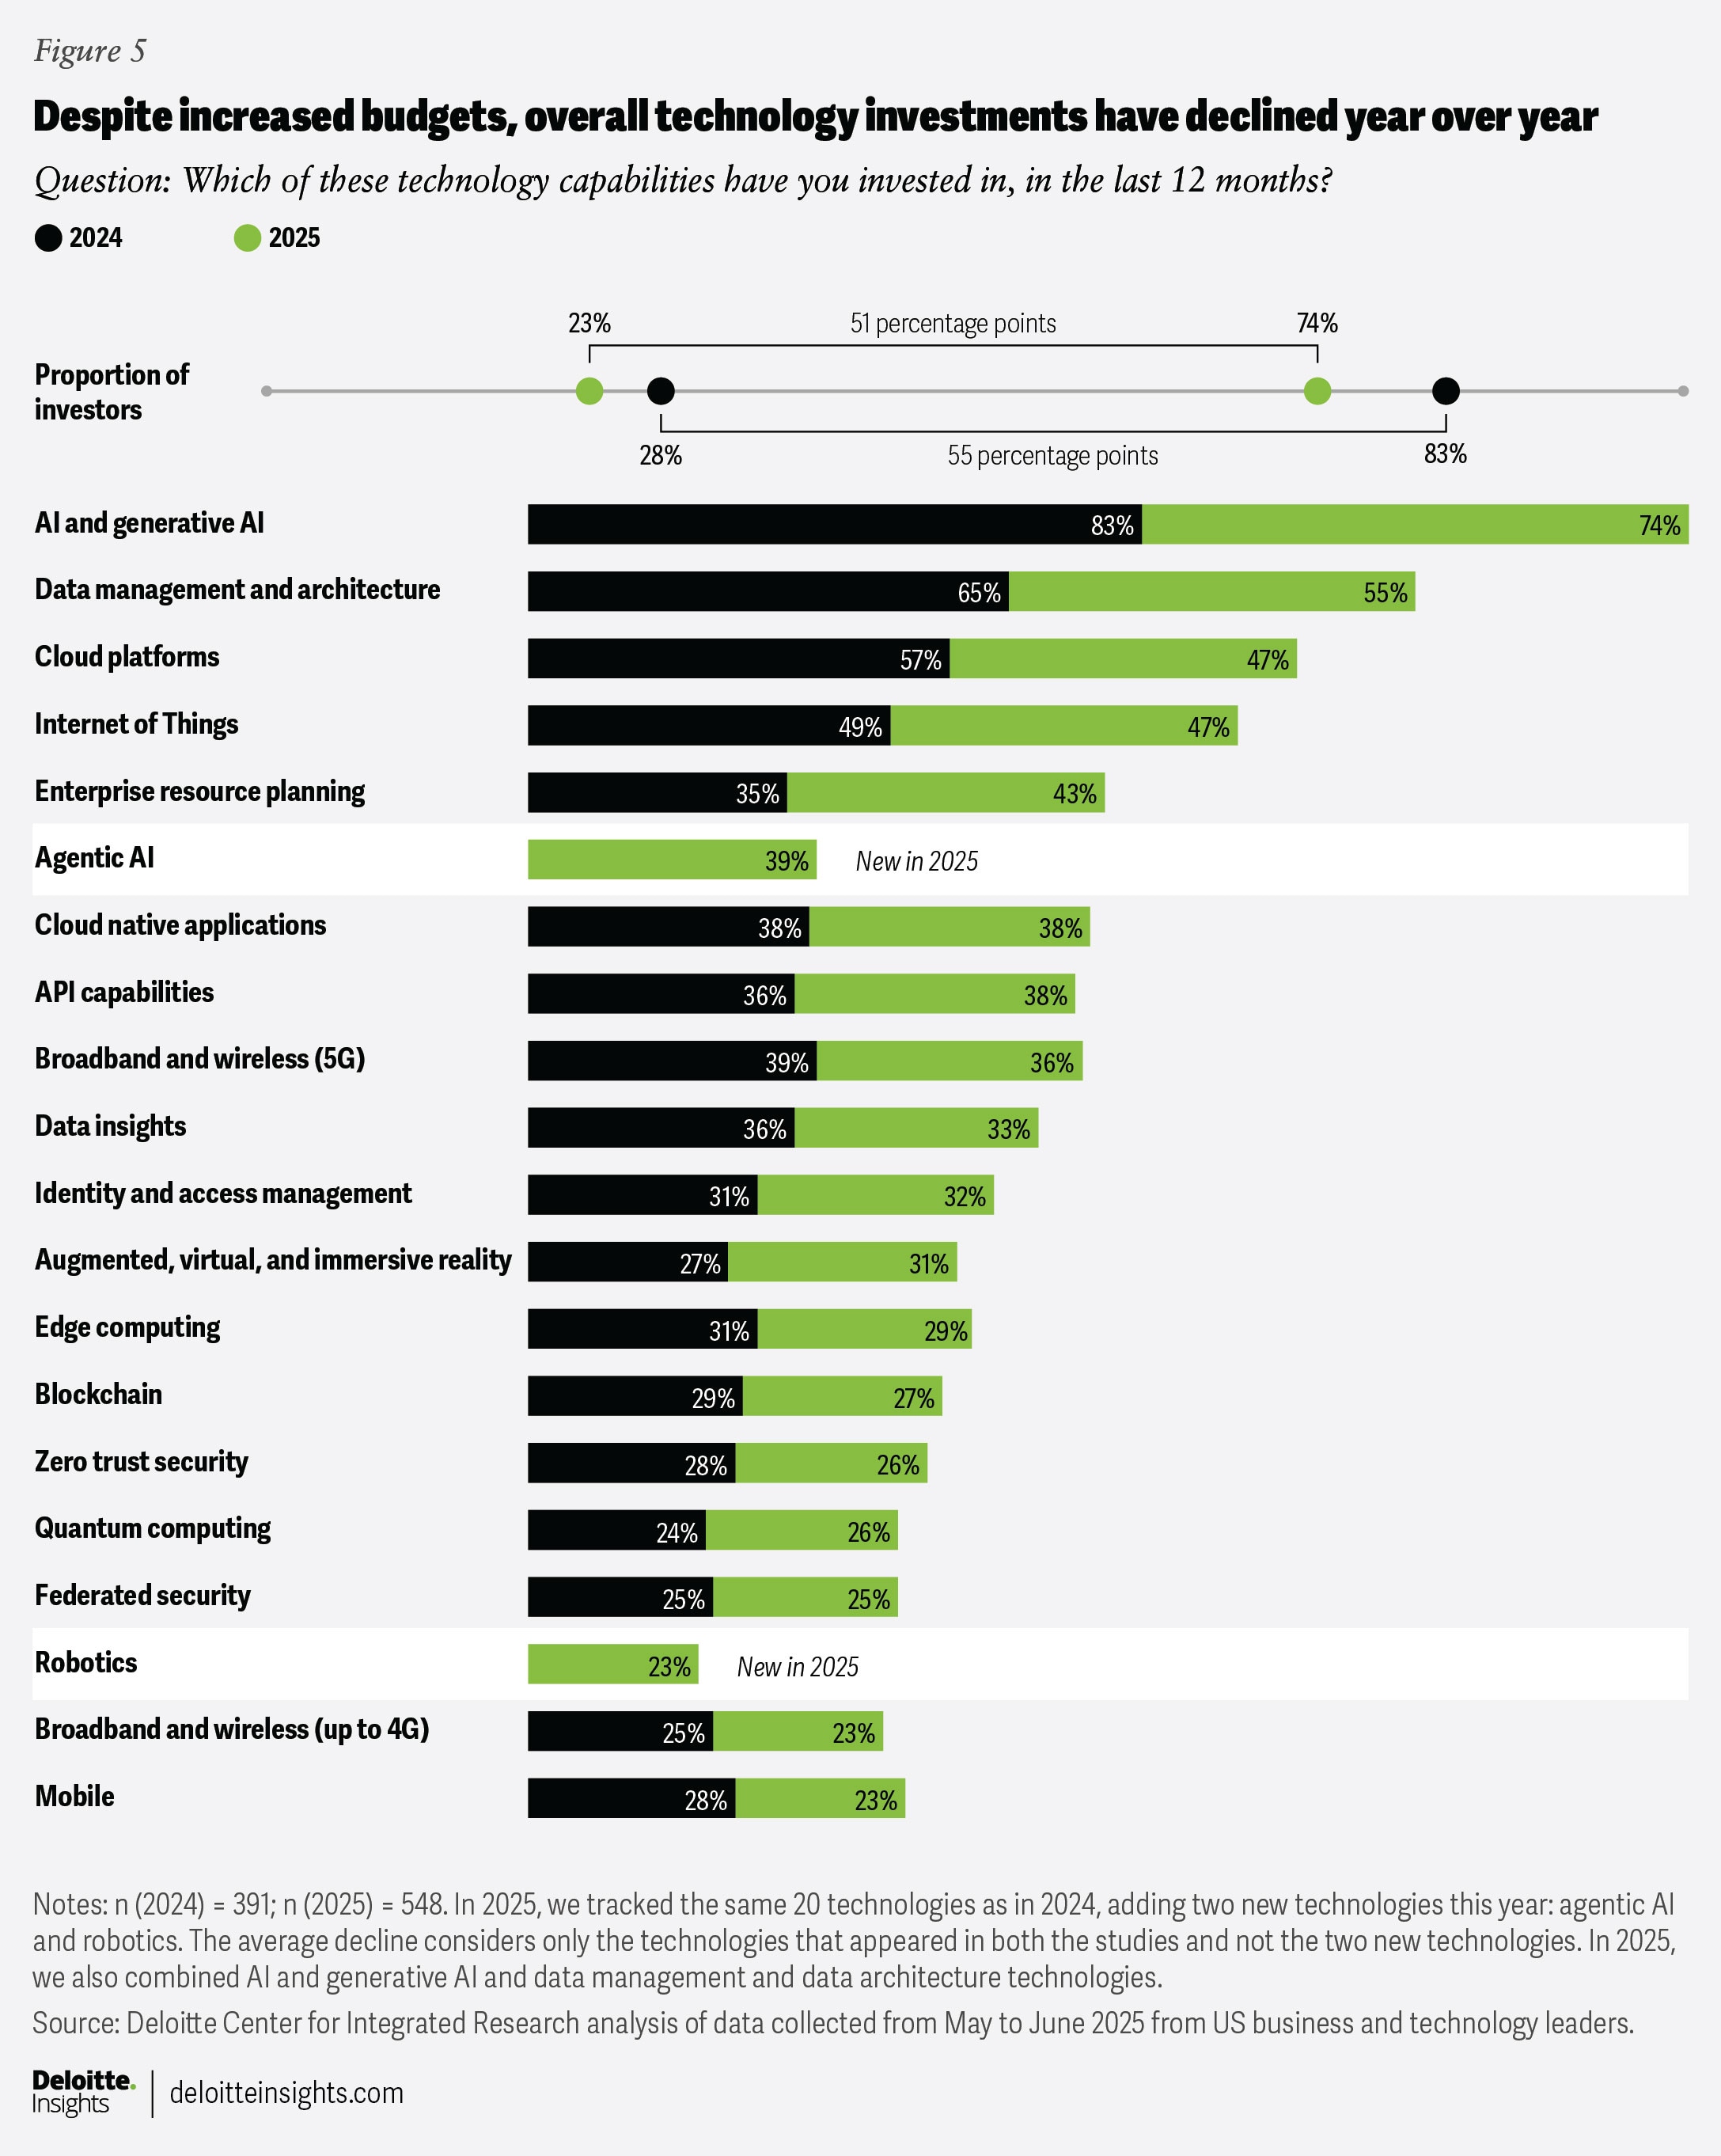
Our survey shows notable declines in the proportion of respondents who invested across most technologies. AI and gen AI remain the technologies in which the greatest proportion of respondents invested over the past 12 months—with 74% investing in AI and gen AI, compared to 55% in data management and architecture, and 47% in cloud platforms. Despite this dip, AI workloads are anticipated to drive up computing demand across multiple tech environments such as cloud, mainframes, and edge.1
Cybersecurity also continues to lag: only 25% to 32% of respondents invested in identity management, federated security, or zero trust in the past year, potentially leaving future applications and infrastructure at risk if budgets don’t expand to accommodate additional investments through 2028.
Enterprise resource planning (ERP) is the only tech investment that bucks the trend, climbing from 35% in 2024 to 43% in 2025. Nearly half of AI investors (47%) also invested in ERP, compared to just 21% of non-AI investors, which seems to underscore the role of ERP investments as the backbone for integrating AI into operations.
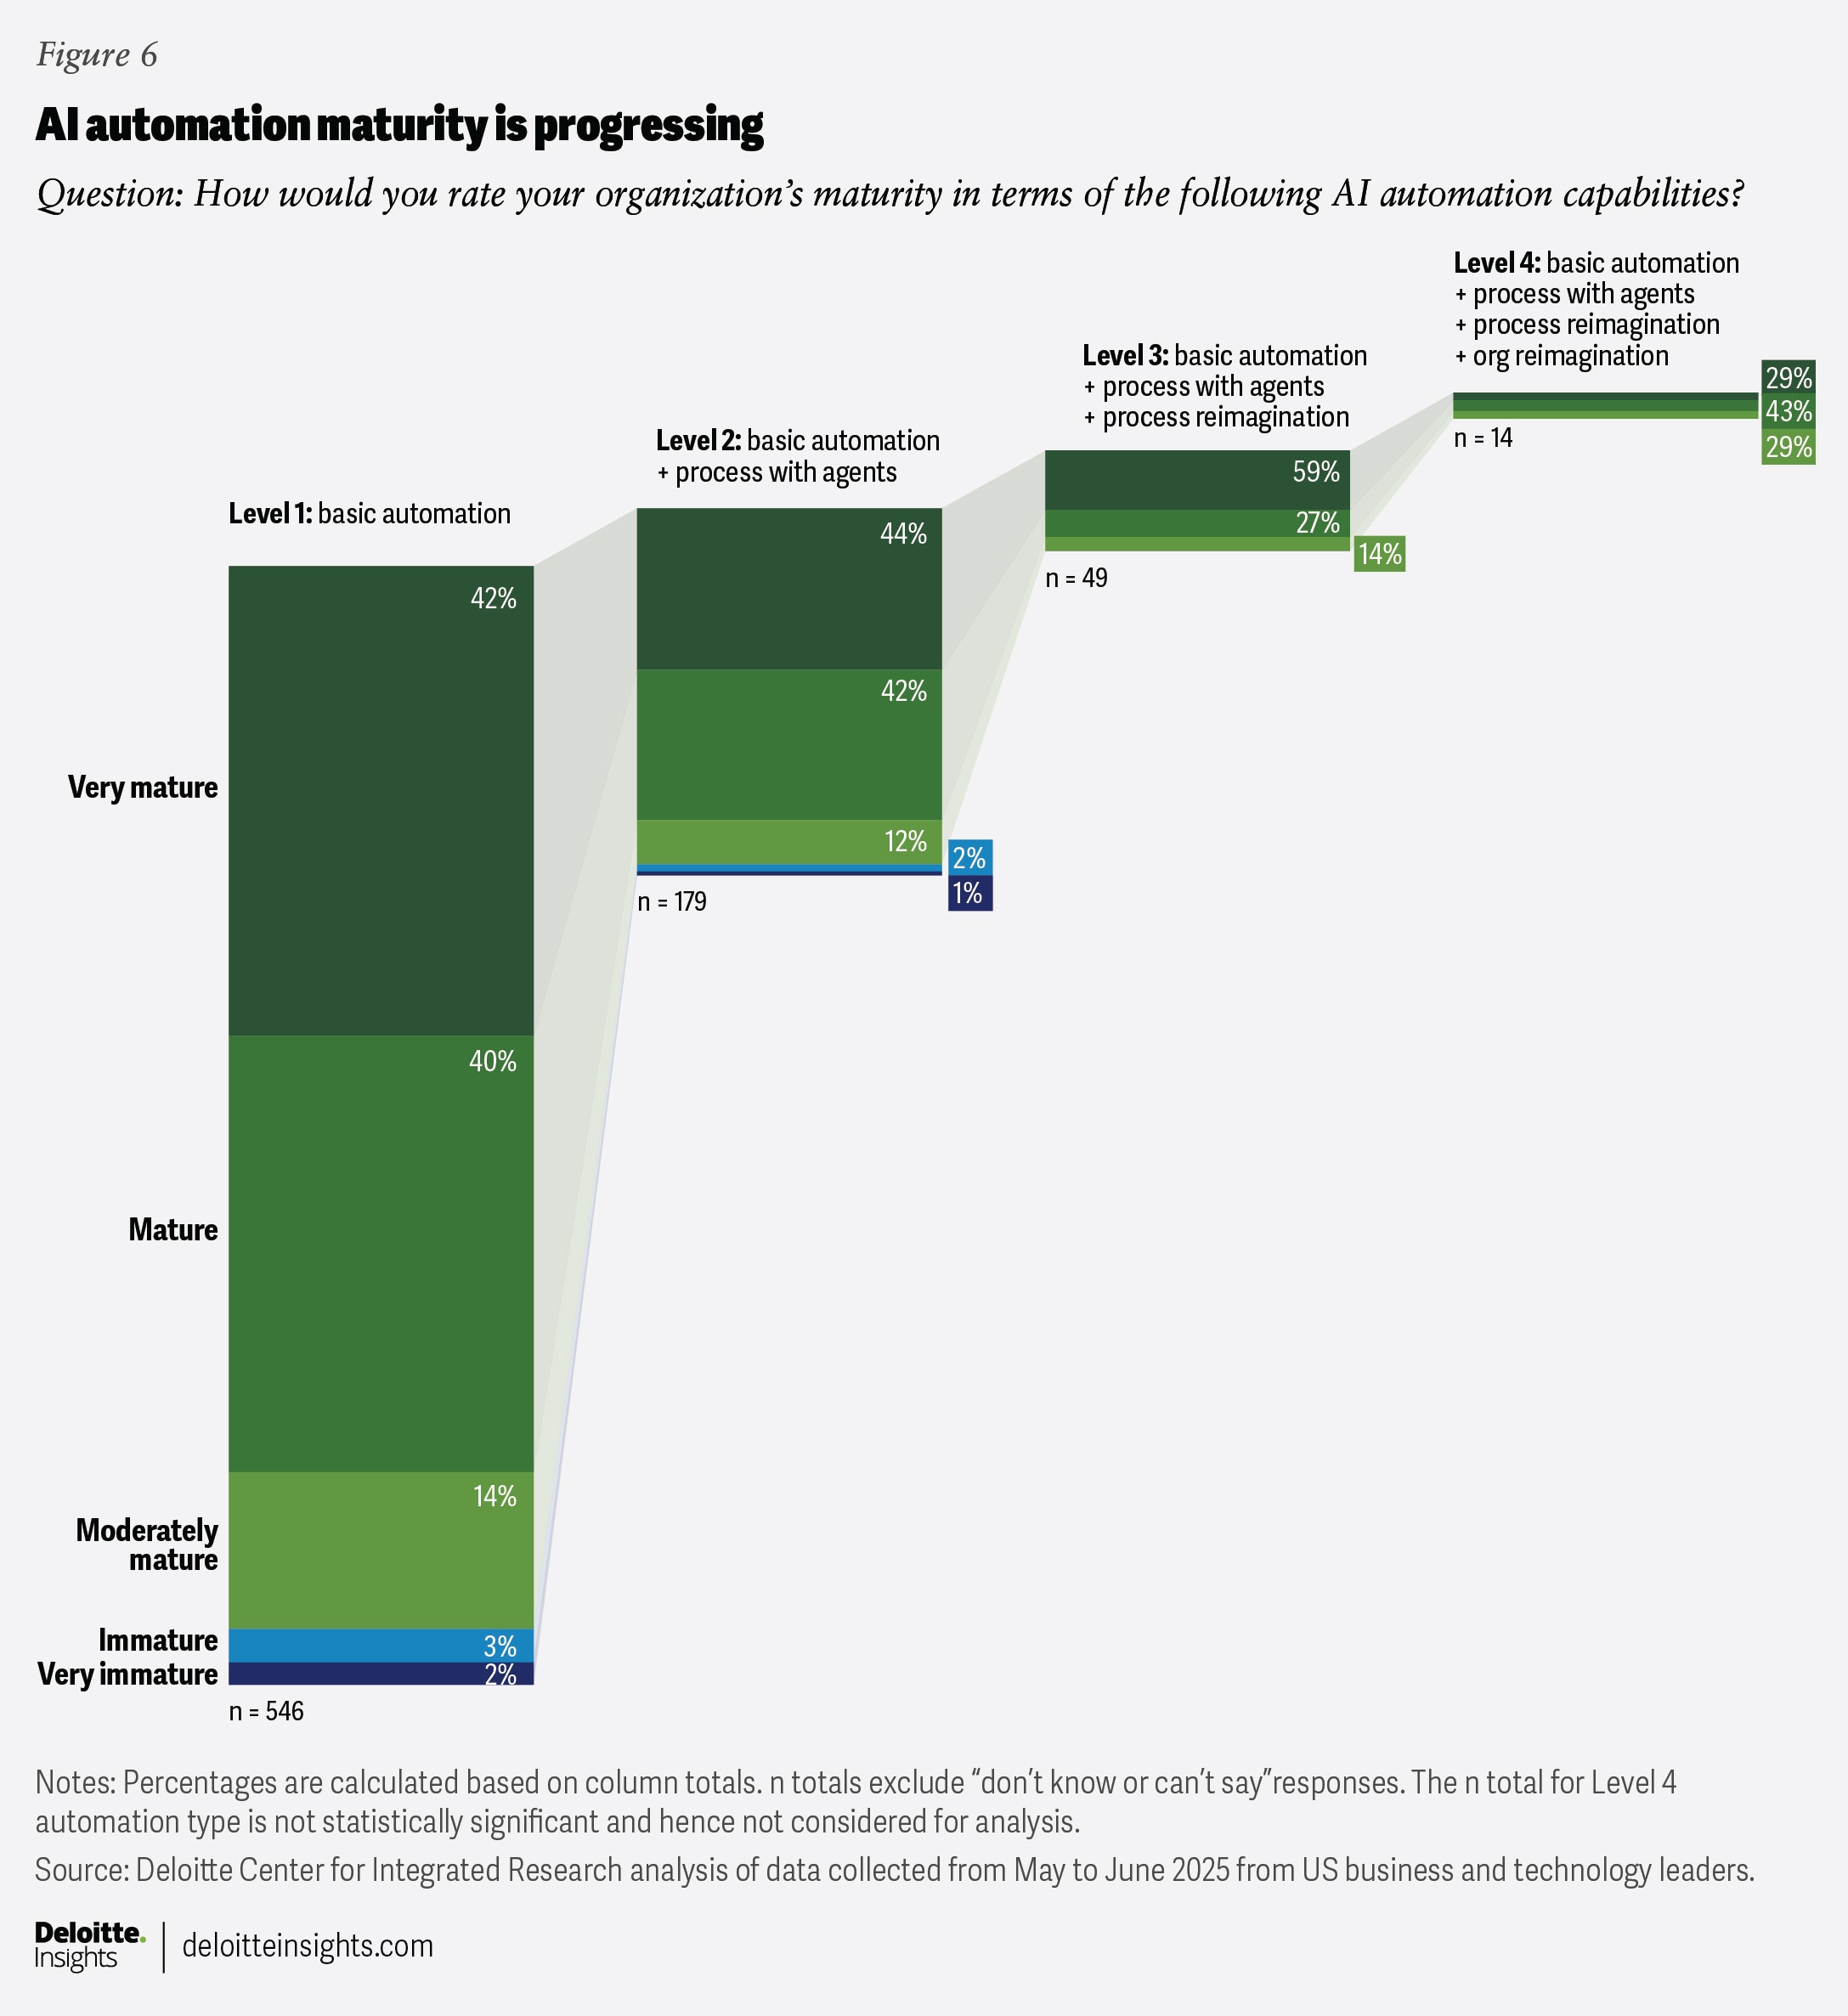
New technology bets are also emerging, with 39% investing in agentic AI (reasoning engines) and 23% in robotics, as organizations advance steadily across four levels on the AI automation maturity curve (figure 6). Moving from basic automation (level one) to multi-agent systems (level two) could be the next milestone for funding and maturity over the next one to three years. While 81% to 86% of respondents say they are “mature” or “very mature” in automation strategies that build up to process reimagination (levels one to three), only 14 respondents say they have begun to mature in organizational reimagination (level 4).
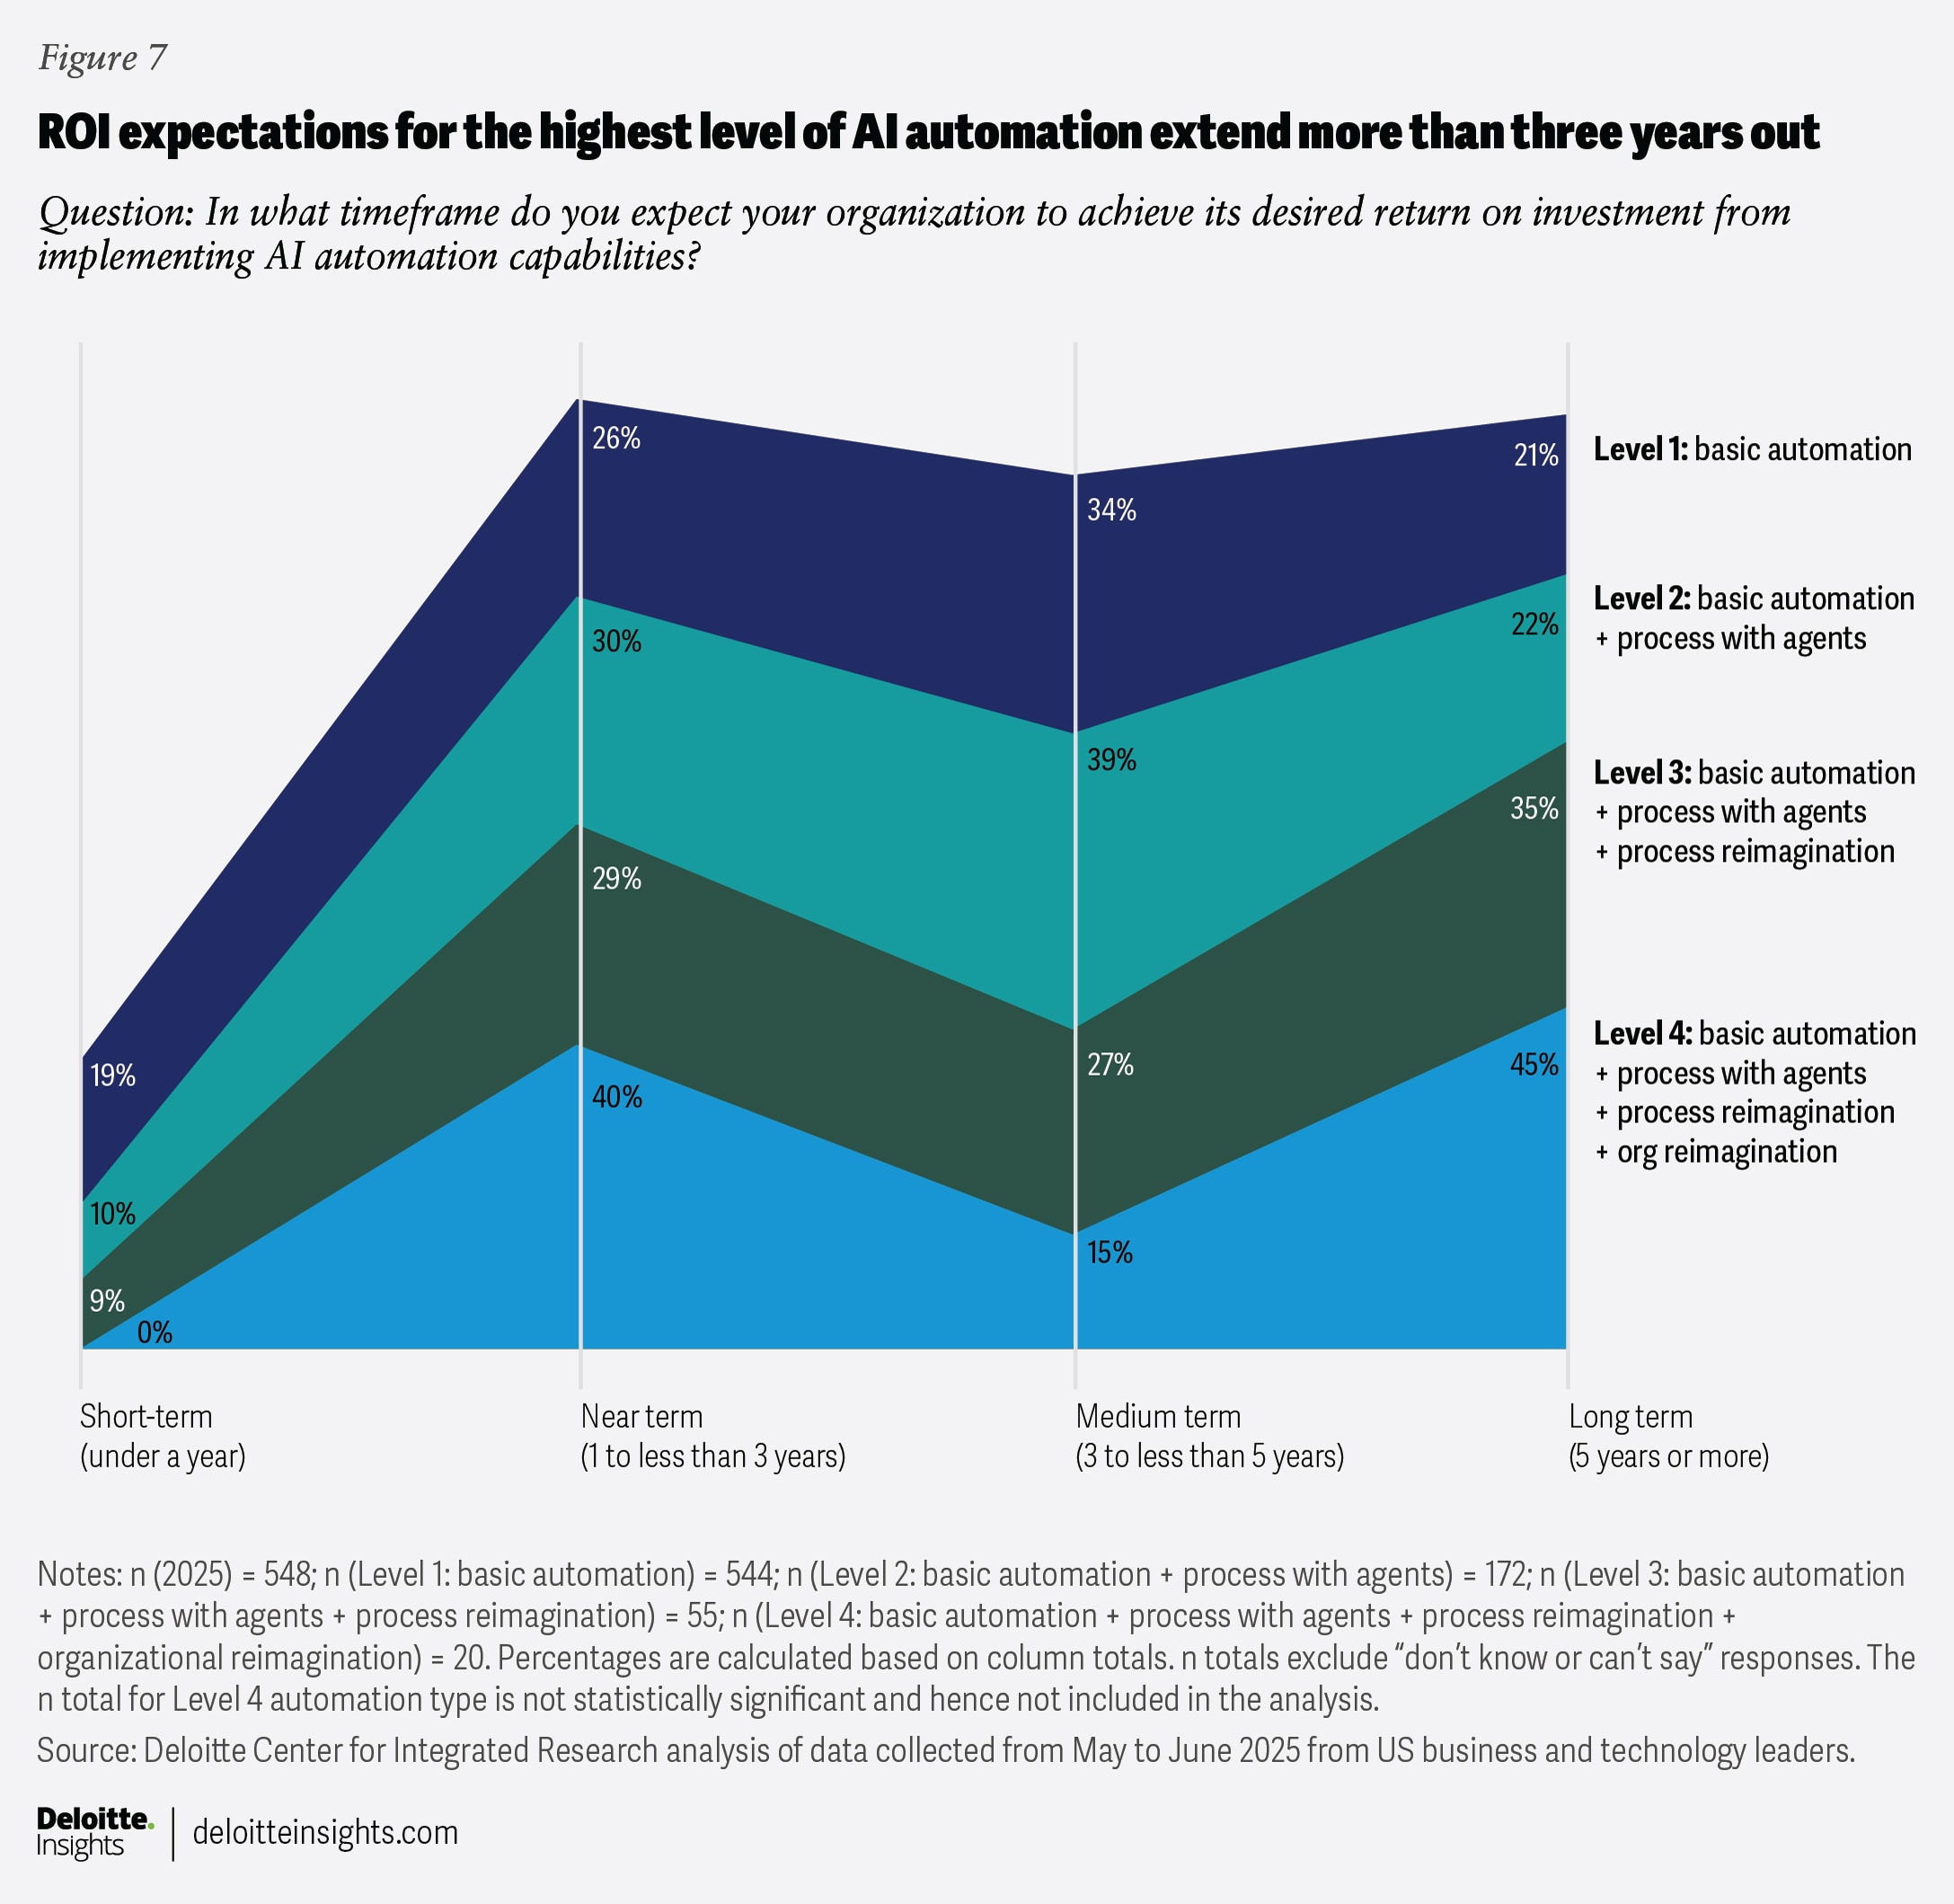
This AI automation maturity curve also corresponds with incremental ROI expectations. Nearly half (45%) of respondents expect a near-term (under three years) ROI from basic automation, while 60% expect ROI from levels 2 to 4 to take longer (figure 7). Organizations may want to consider creating an AI automation program management office that spans business, finance, and tech, and has clear value goals.
While digital budgets have increased year over year, these investment patterns suggest that organizations may encounter challenges in adequately supporting both AI ambitions and foundational technology needs. In some cases, critical digital initiatives may risk being underfunded. Given these dynamics, how can organizations address the potential shortfall?
In addition to considering incremental, sustained increases in digital budgets, C-suite leaders can pursue additional strategies to help drive cost efficiencies through technology optimization and better cost management as AI economics shift. For example, they may consider establishing spending minimums for platforms, data architecture, identity and zero trust, and ERP modernization—so AI doesn’t starve the rest of the technology portfolio—along with some strategic capital expenditures and operational expenditure guardrails for budget allocations and renewals.
However, investments are only half of the equation. The other half is value, and organizations are currently accounting for value in at least six distinct ways.
Value creation is real, but fragmented
Digital initiatives now account for a significant share (21% to 50%) of enterprise value, but how that value materializes depends on where leaders look. Deloitte analyzed five distinct value approaches, and the analysis shows strong gains across most of these measures of digital value:
- Tech investment ROI
- Market capitalization, return on equity, and earnings before interest, taxes, depreciation, and amortization (EBITDA)
- Enterprise value and latent potential
- Return on key performance indicators
- New monetization value streams
Tech investment ROI (including AI automation ROI)
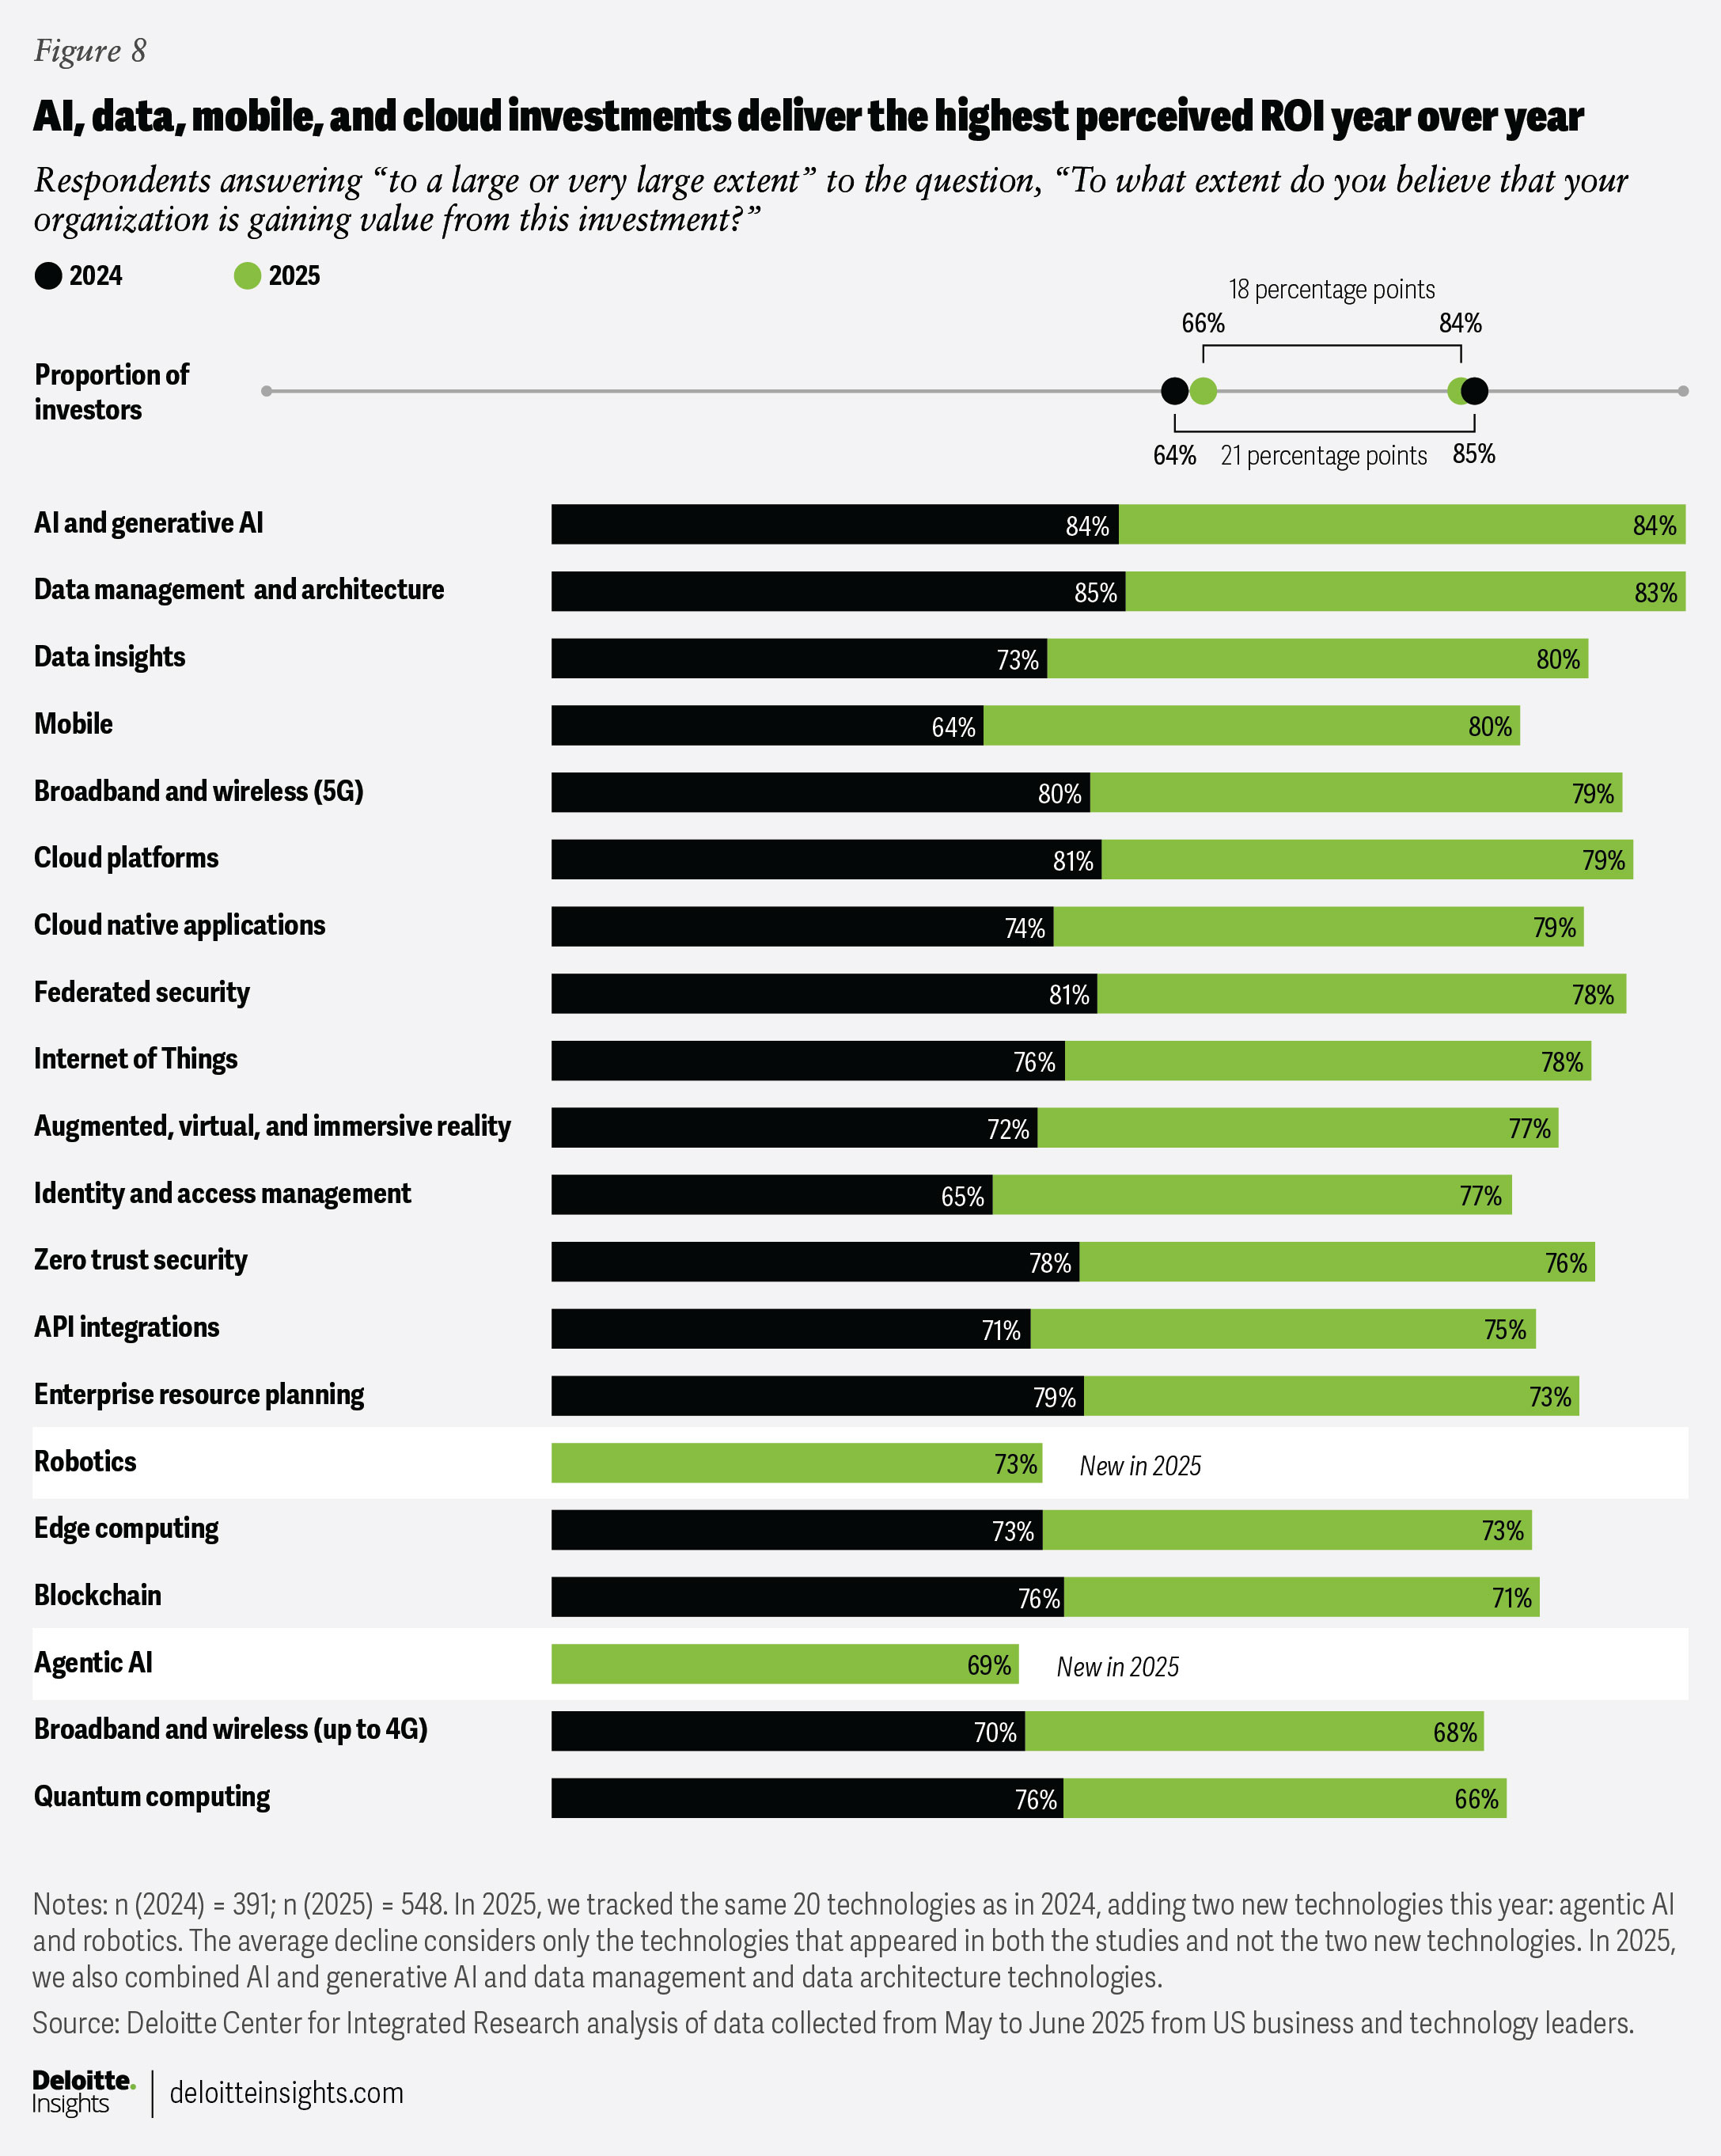
Across technologies, respondents say they’re seeing ROI from most investments. Eighty-four percent of those investing in AI and gen AI say they are gaining ROI, followed by data management and architecture (83%), data insights and mobile (80%), and mobile, cloud platforms, and cloud native applications (79% each). Nearly 70% of those who invested in agentic AI also reported gains (figure 8).
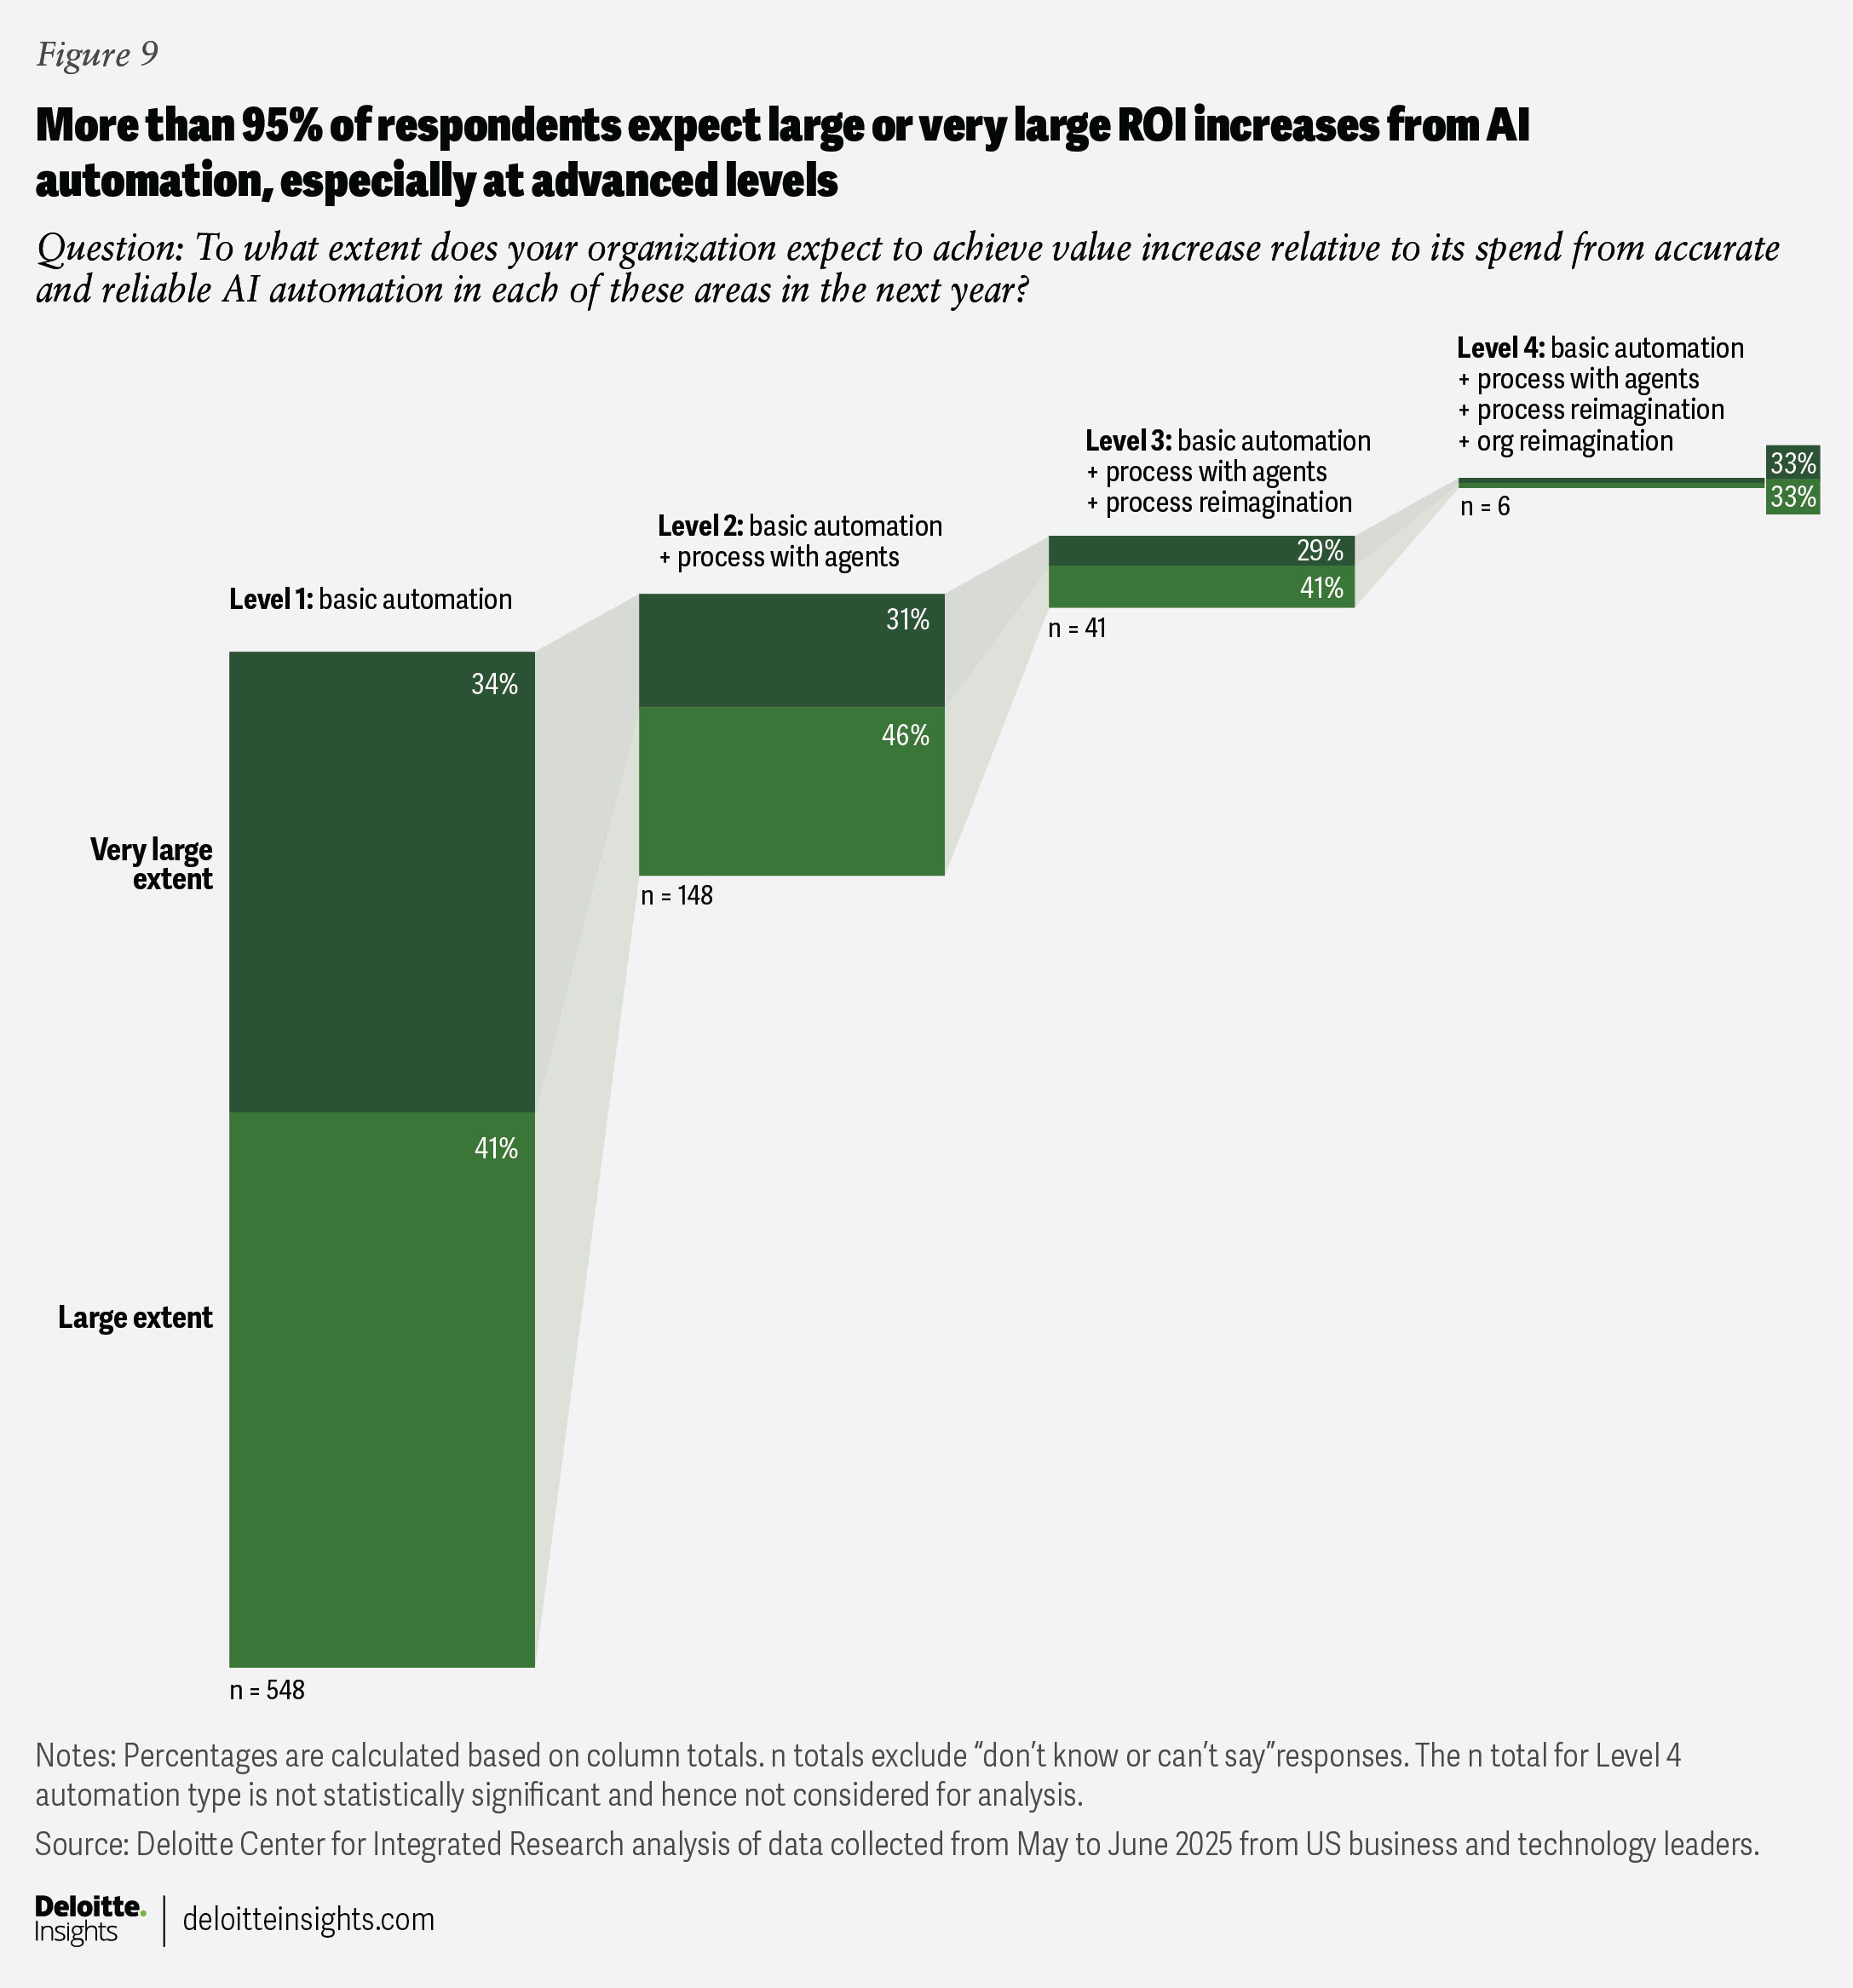
Confidence in AI automation ROI is also strong, with more than 95% of respondents expecting moderate to significant value increases in the coming year (figure 9).
Most respondents report strong ROI from digital initiatives, especially AI and gen AI. However, a recent MIT study2 found that only 5% of gen AI pilots deliver sustained value at scale. This gap suggests that organizations may be overestimating success and should shift from pilots to learning-capable systems—AI systems and tools that learn from interactions and context, continuously improving over time—integrated into core workflows, with ROI tied to measurable impact.
Market capitalization, return on equity, and EBITDA
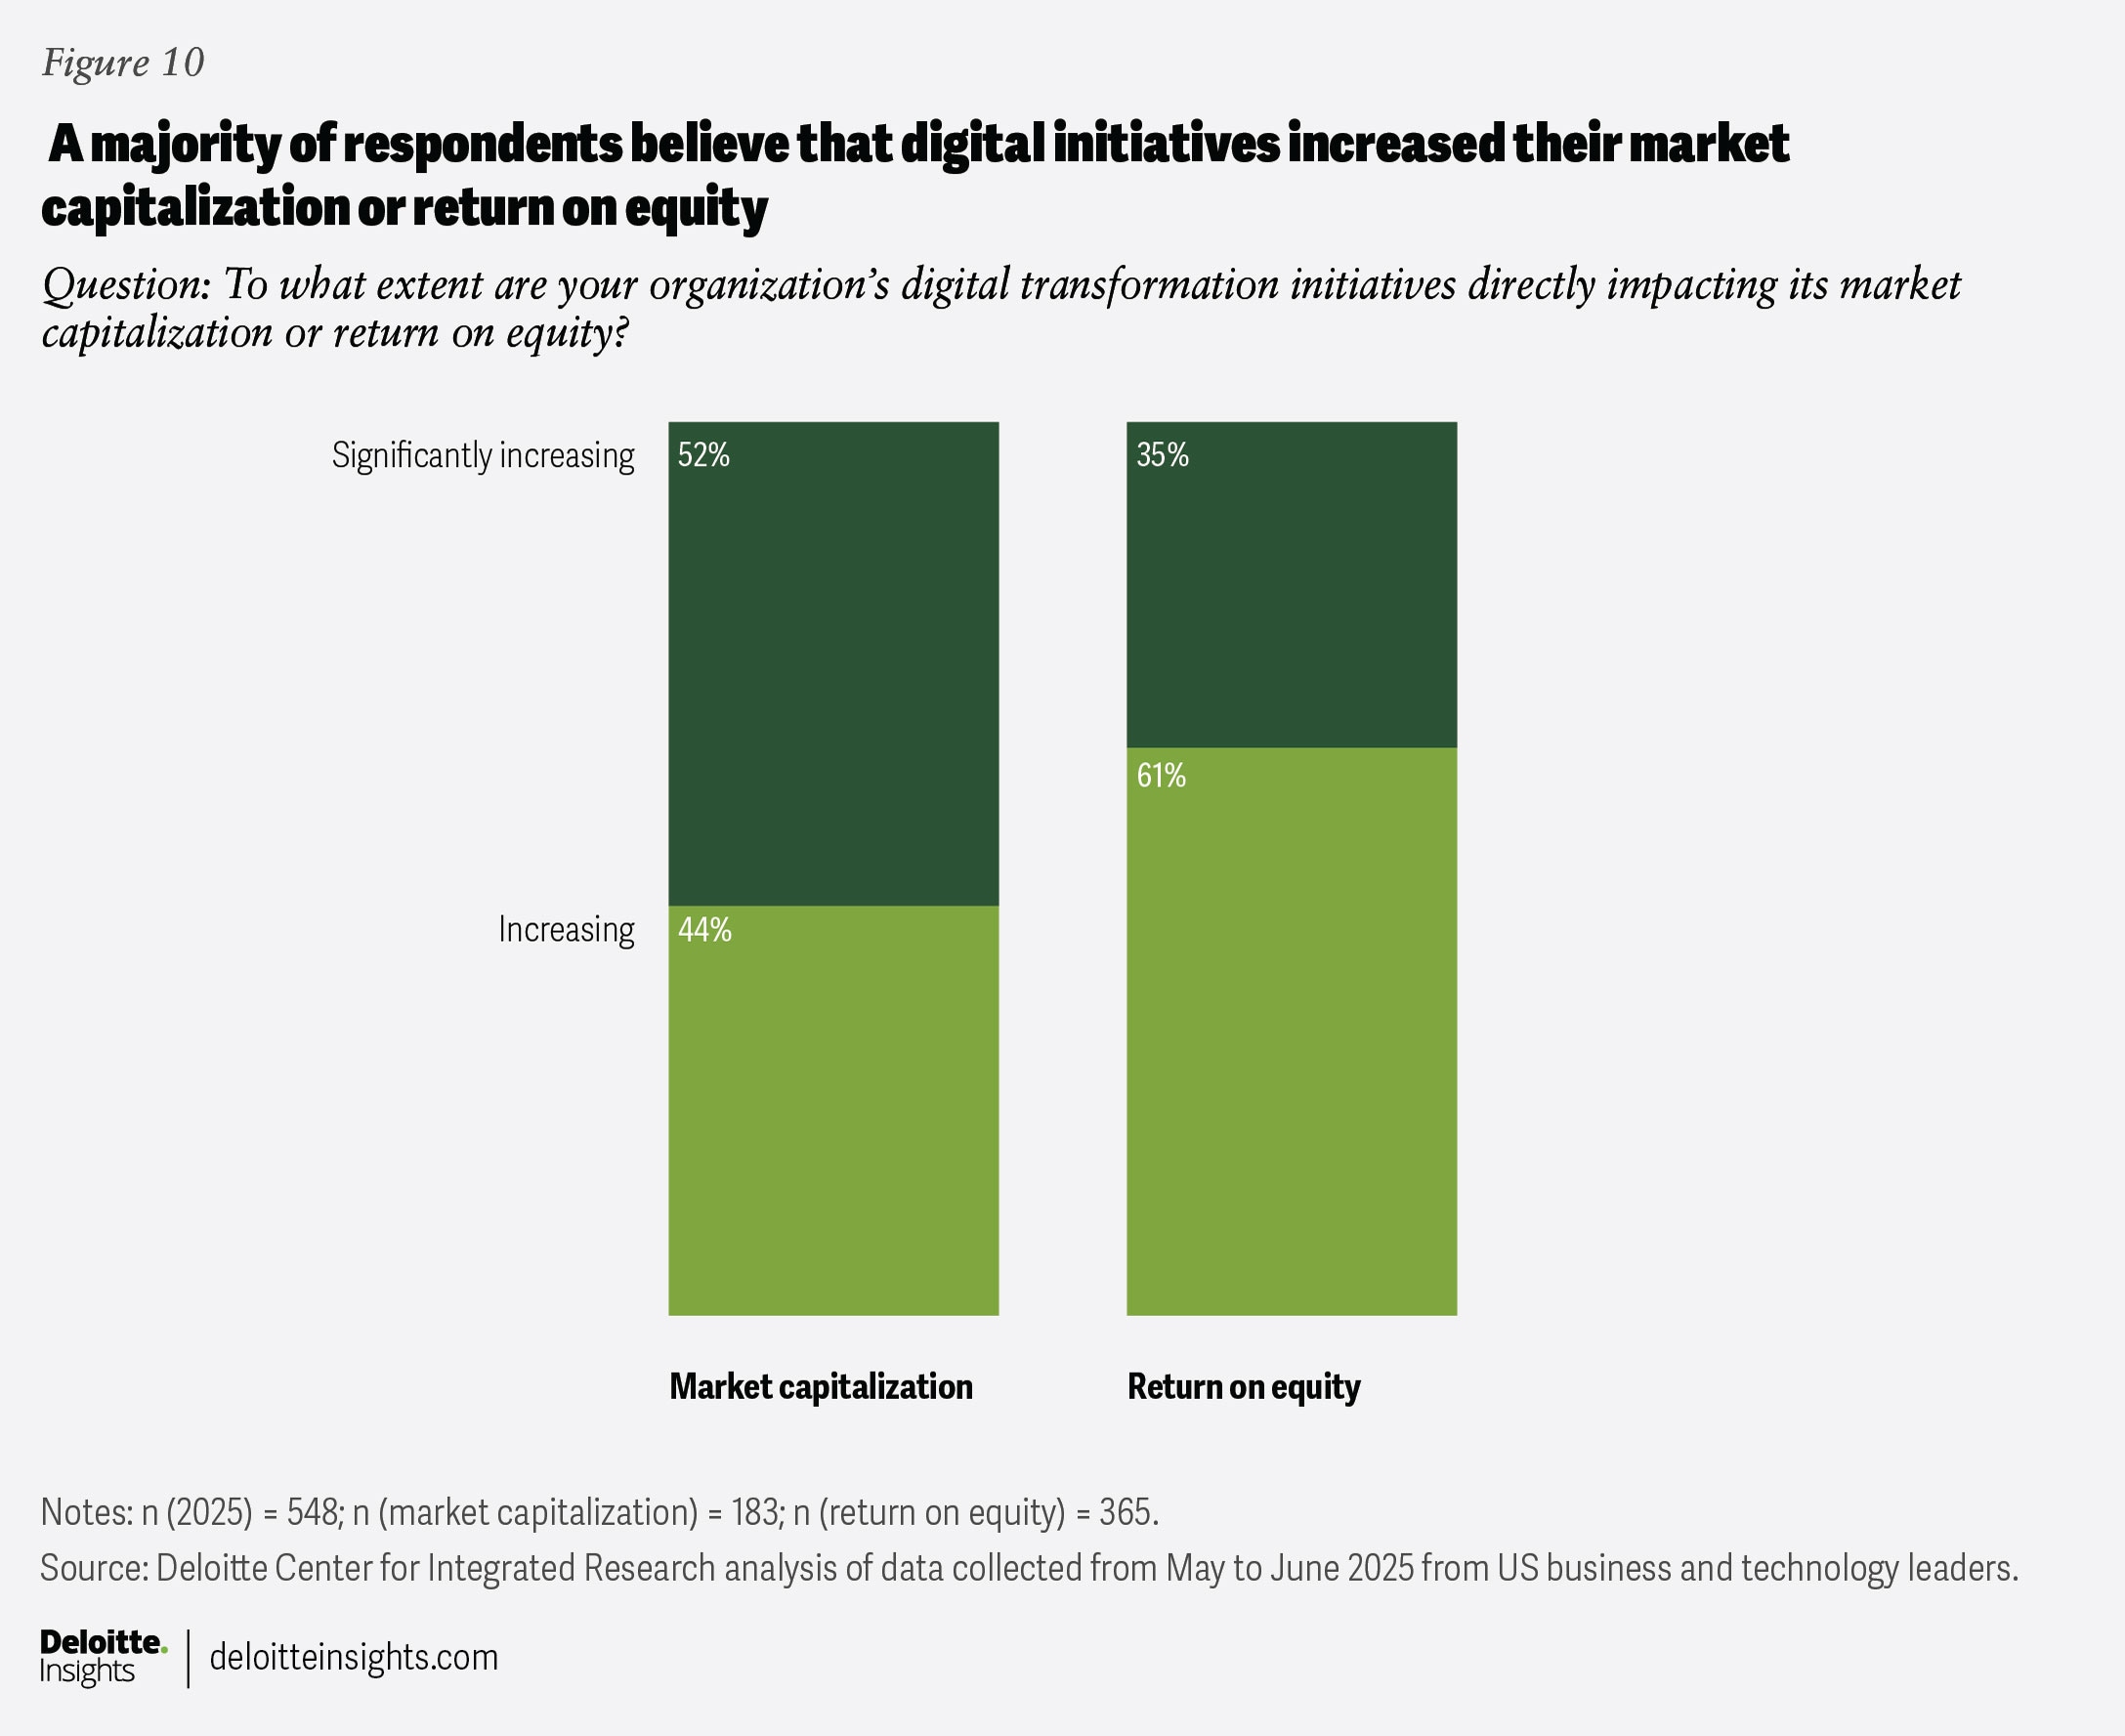
At the enterprise level, however, the value signal is clear. More than 95% of respondents say digital initiatives have lifted market cap for public firms or return on equity for private firms—the latter being an organization’s ability to generate profit from shareholders’ investments (figure 10). This echoes Deloitte’s previous analysis3 that firms embedding AI into innovation strategies show the greatest upside, with potential to triple market cap compared to those focused only on modernization.
Despite the value gains, the data also reveals a paradox. Further analysis of the relationship between market cap and technology investments showed that respondents who reported they had invested in AI or gen AI in the past 12 months were less likely to see significant market cap gains (43%) than those investing in data (65%) or security (66%). Thus, it seems AI is powerful but not a panacea. Value can come from a balanced portfolio.
Additionally, to manage an organization’s profitability, C-suite leaders should pay attention to the value drivers and detractors that can impact earnings.
Enterprise value and latent potential
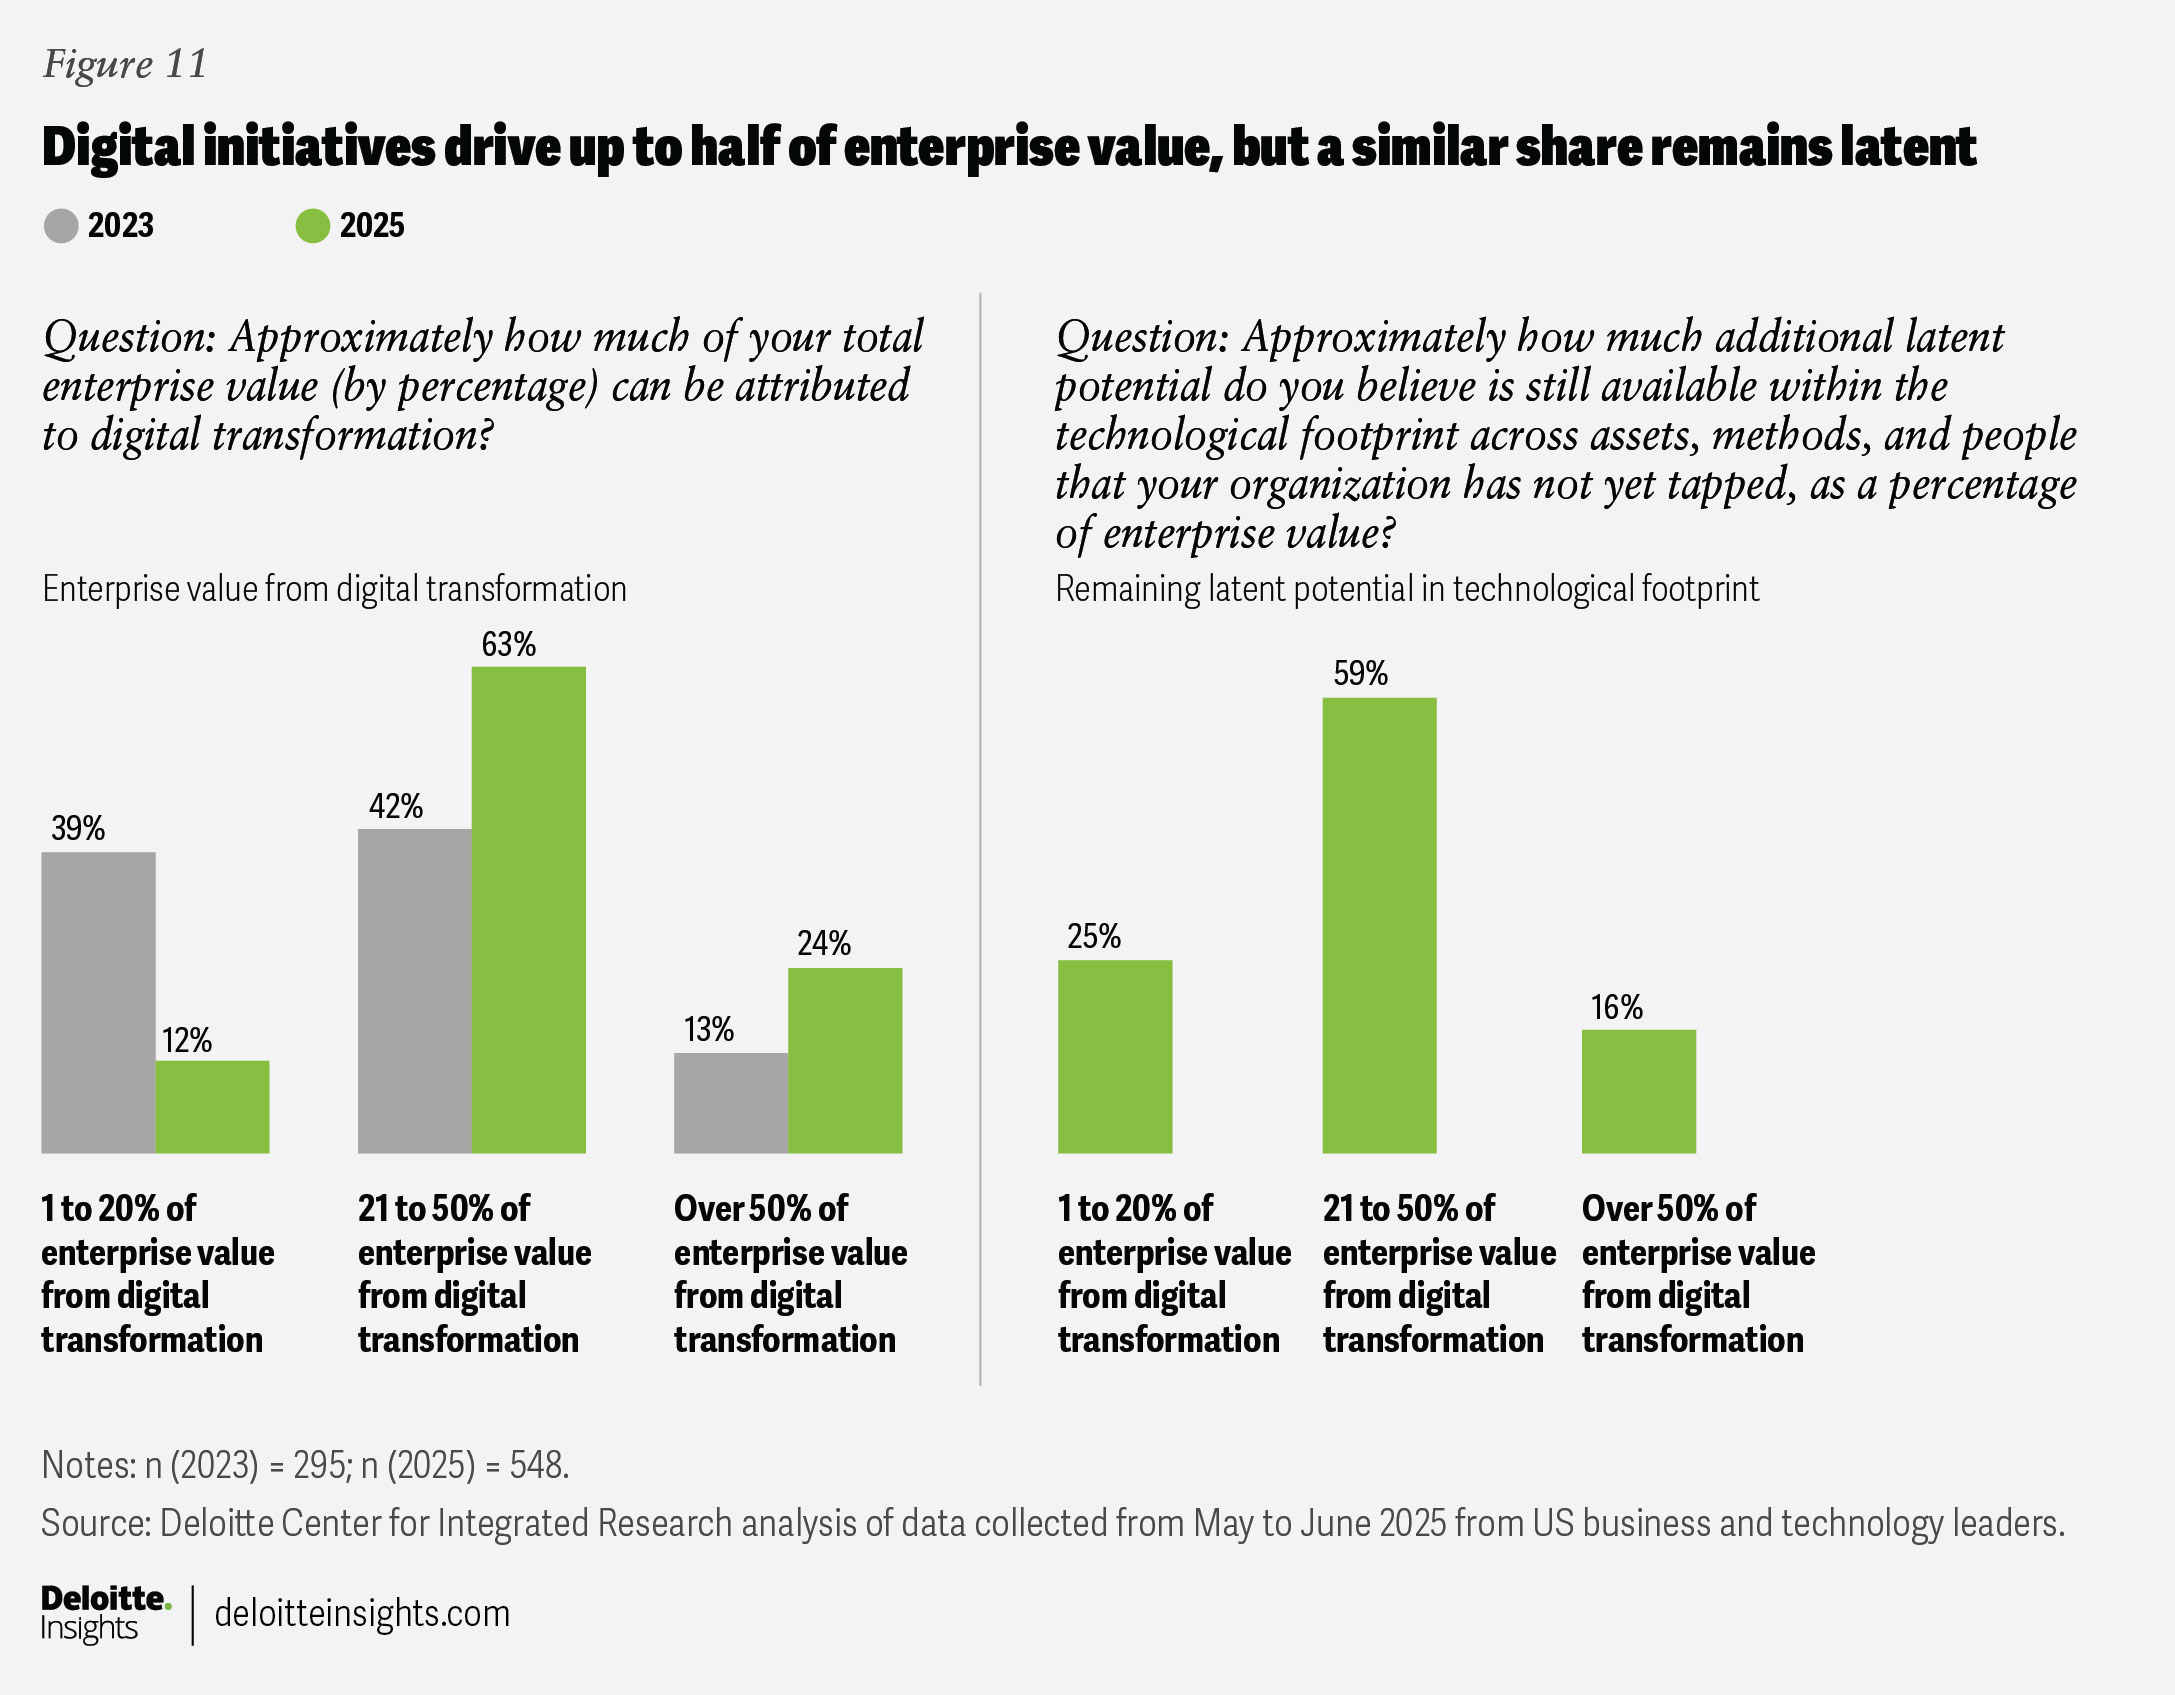
Our analysis reveals that large pockets of value remain unrealized. Almost two-thirds of leaders say digital already accounts for 21% to 50% of enterprise value, and nearly one-quarter say it accounts for more than half. But nearly 60% believe that another 21% to 50% of enterprise value is still latent (figure 11).
This latent value could represent an important opportunity for future growth. As organizations look to better understand current dynamics and unlock this value, tracking KPIs will likely play an important role.
Return on key performance indicators
Deloitte’s KPI analysis across 46 financial, customer, process, workforce, and purpose metrics points to the idea that KPI usage has plateaued, with only a nominal increase in the number of respondents using each frequently or very frequently (figure 12).
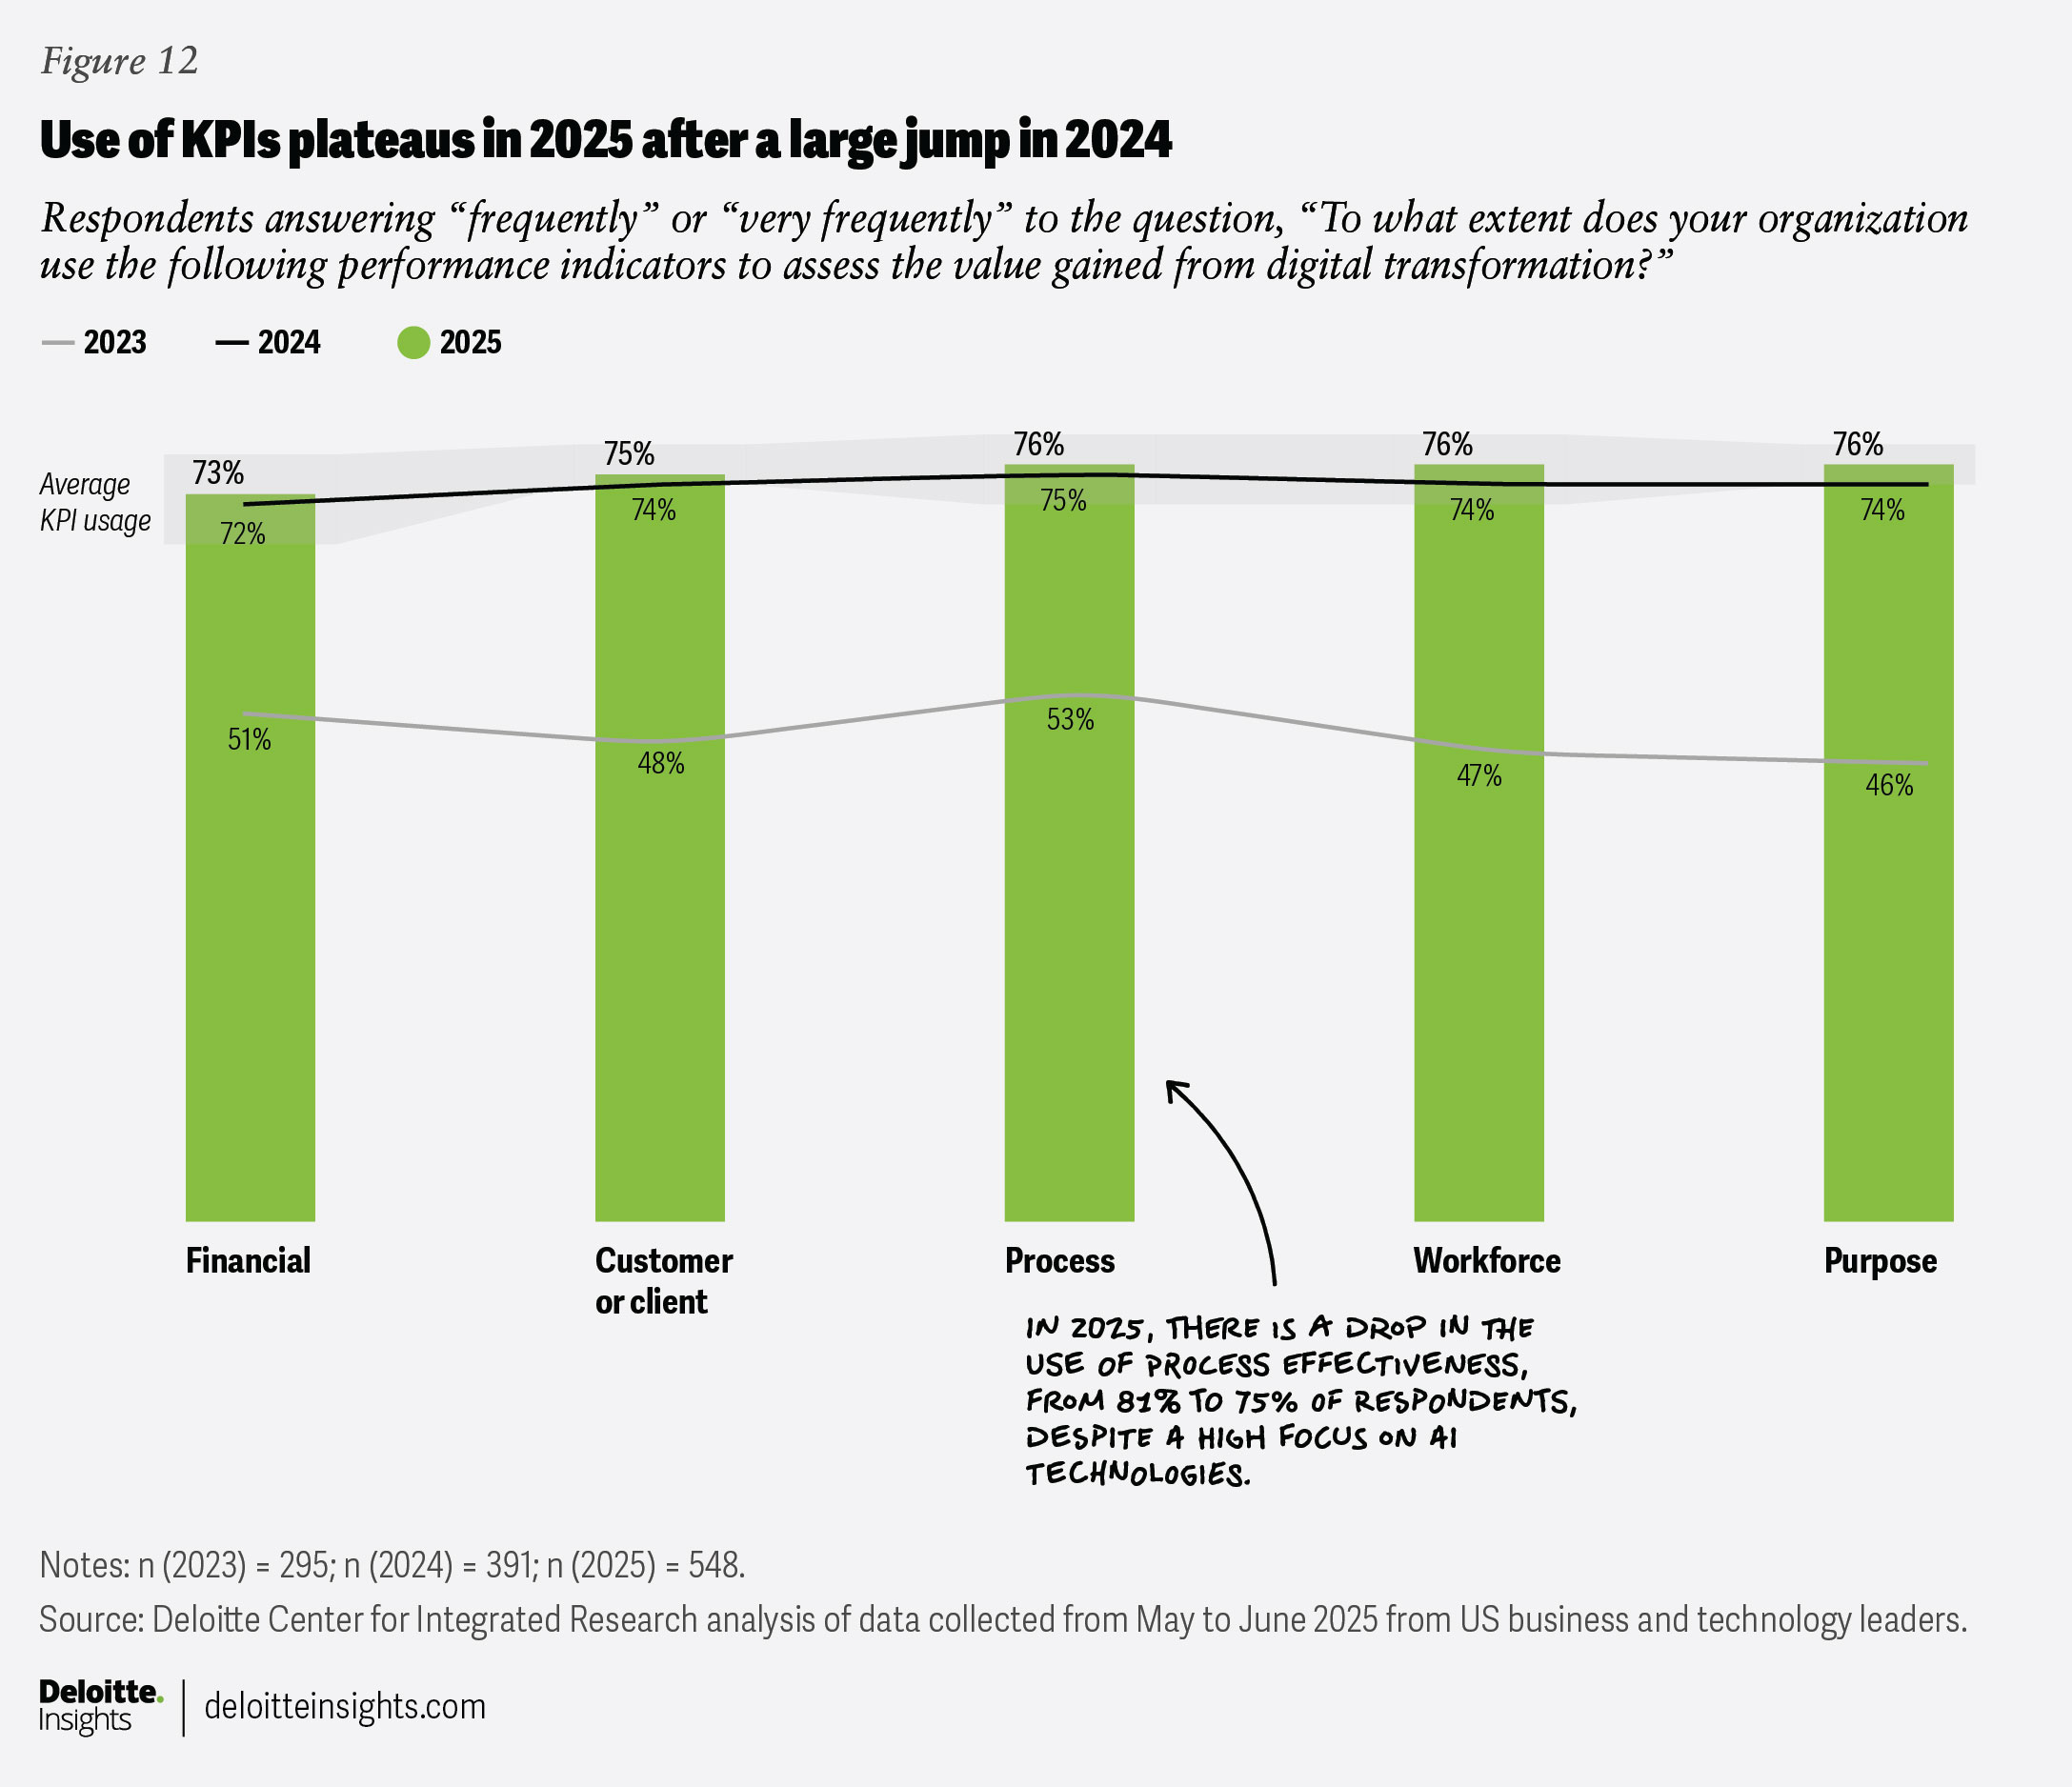
The most notable KPI measurement shifts in 2025 include a drop in the use of process effectiveness—from 81% to 75% of respondents—despite a high focus on AI technologies. This could indicate a missed opportunity for organizations to measure and manage against this KPI within their AI programs.4 As we saw last year,5 firms that measure broadly are more likely to realize higher enterprise value. The opportunity lies in translating measurement into outcomes.
New monetization value streams
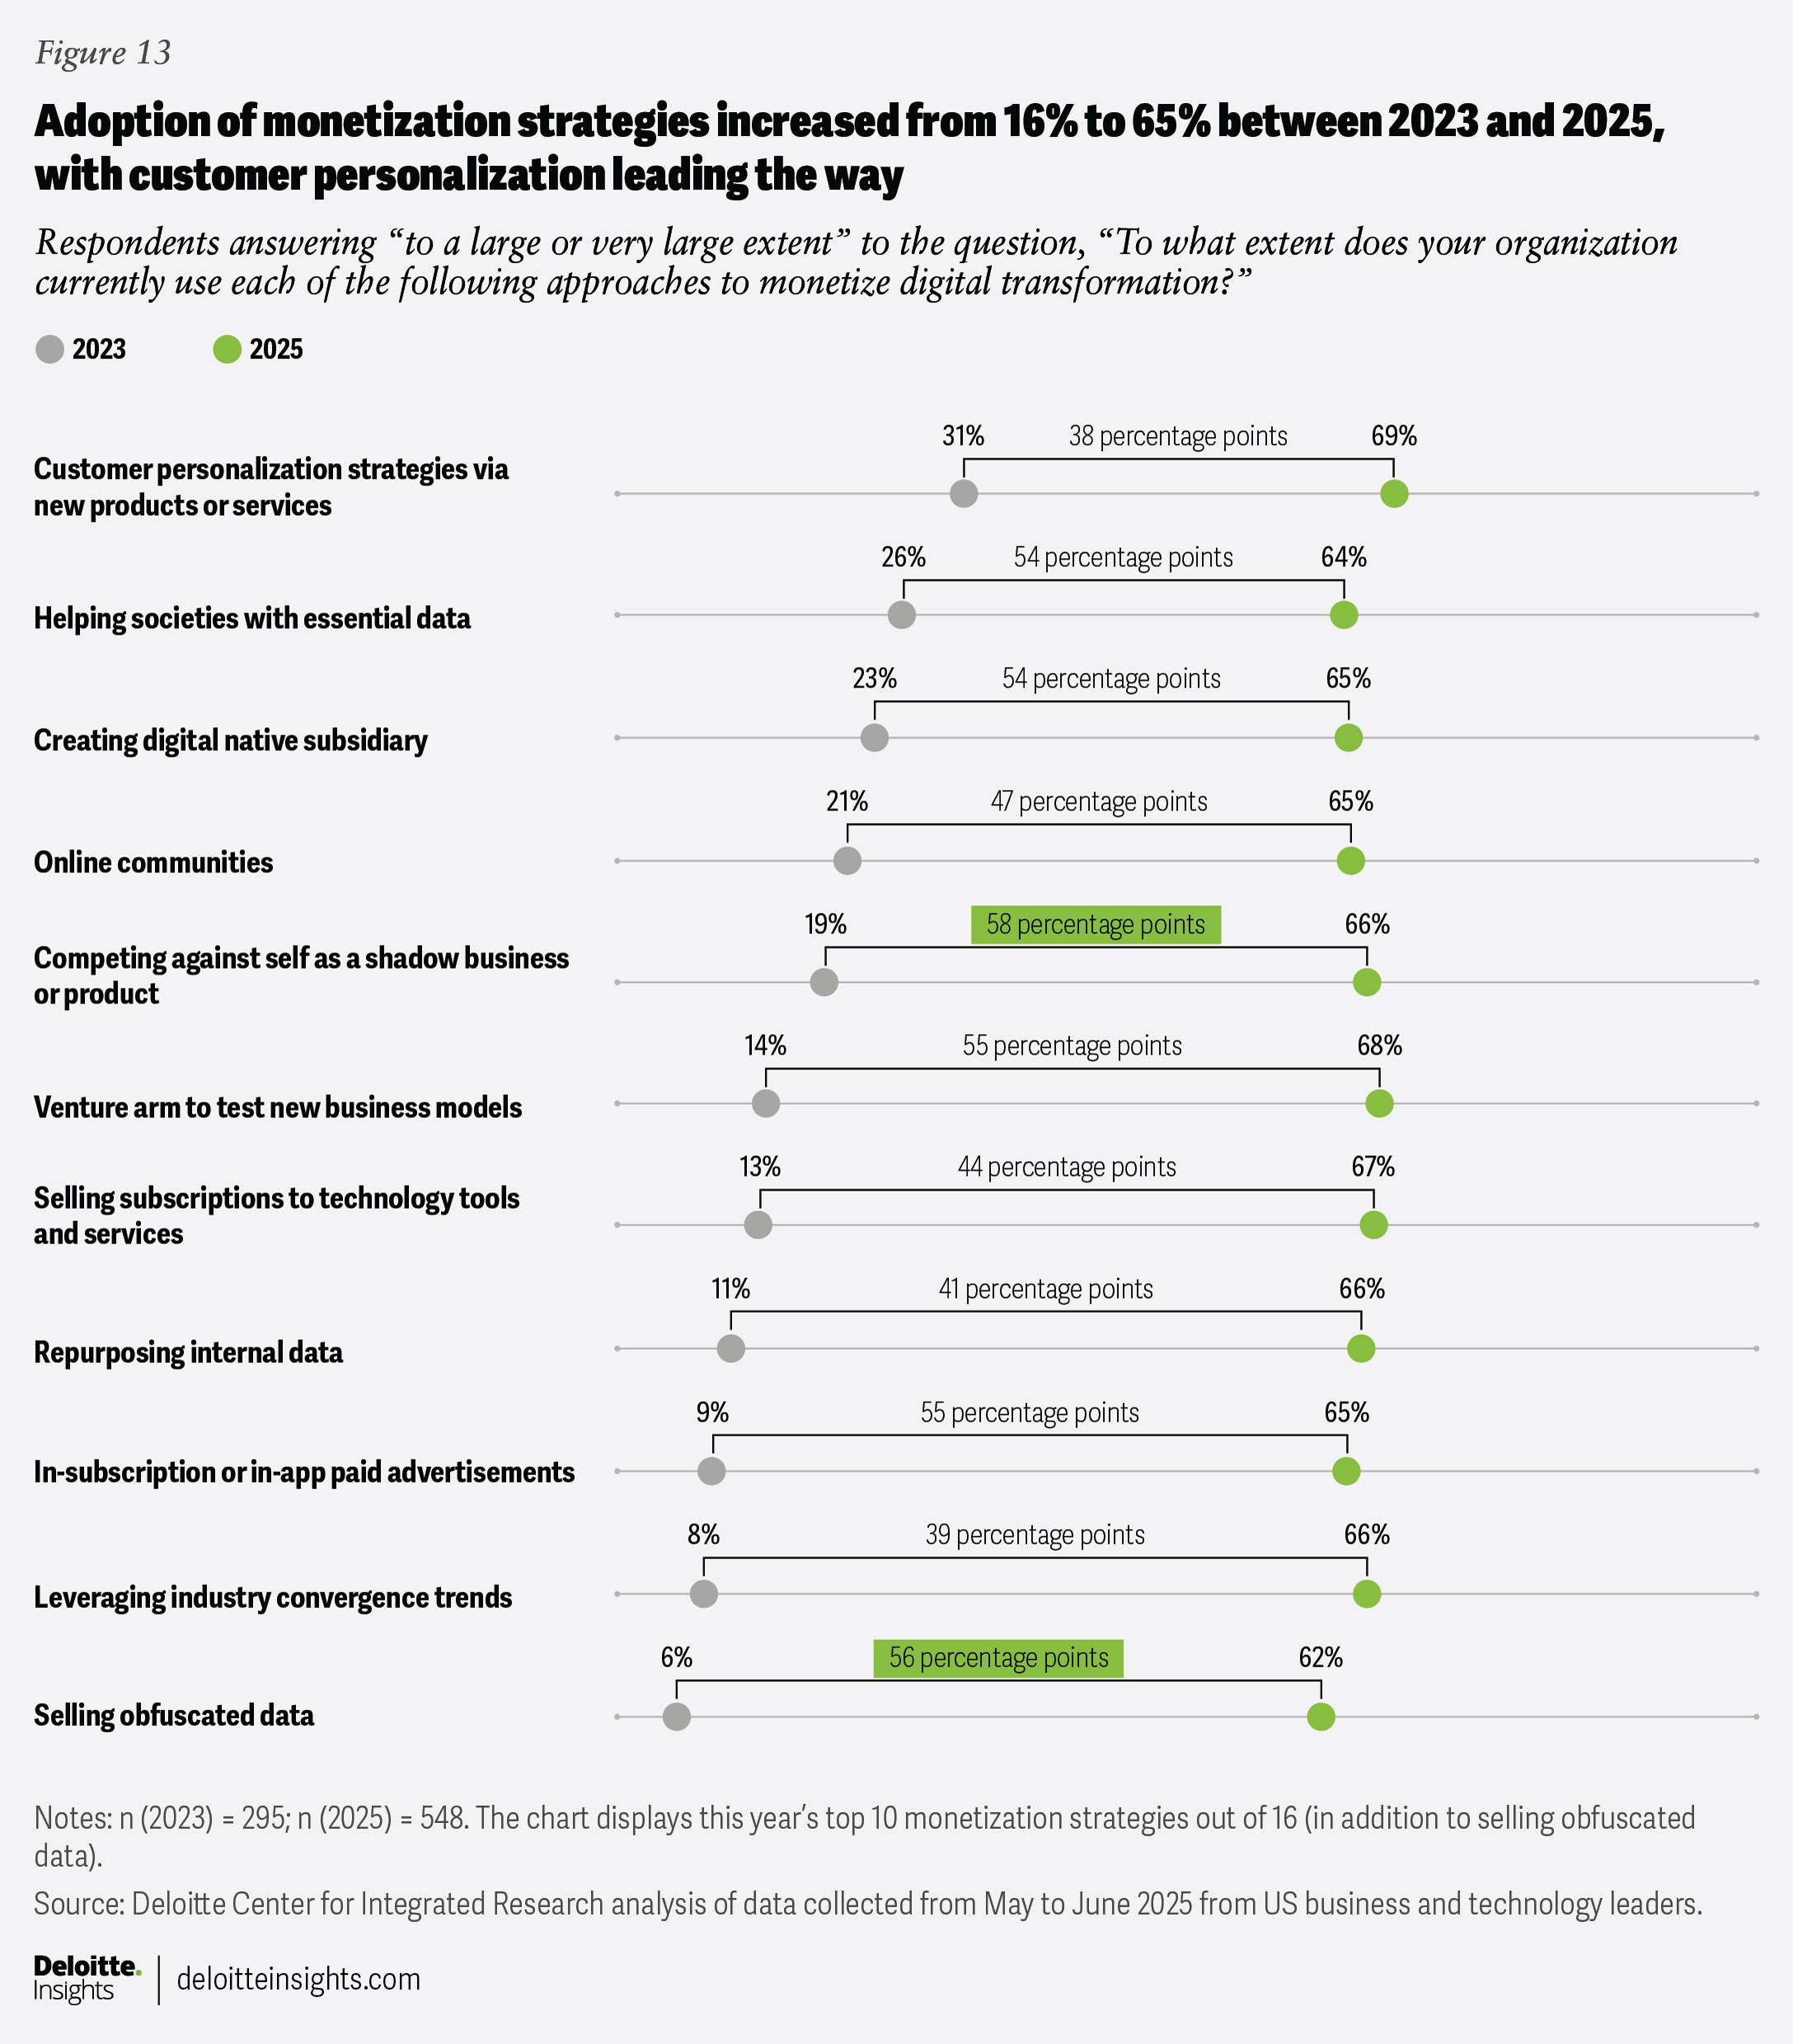
Data monetization strategy adoption expanded from 16% to 65% of respondents between 2023 and 2025, with customer personalization still leading the way.6 Notably, there’s growing adoption of approaches like competing against self as a shadow business and selling obfuscated data, reflecting a broader push to unlock new revenue streams from AI and data investments (figure 13).
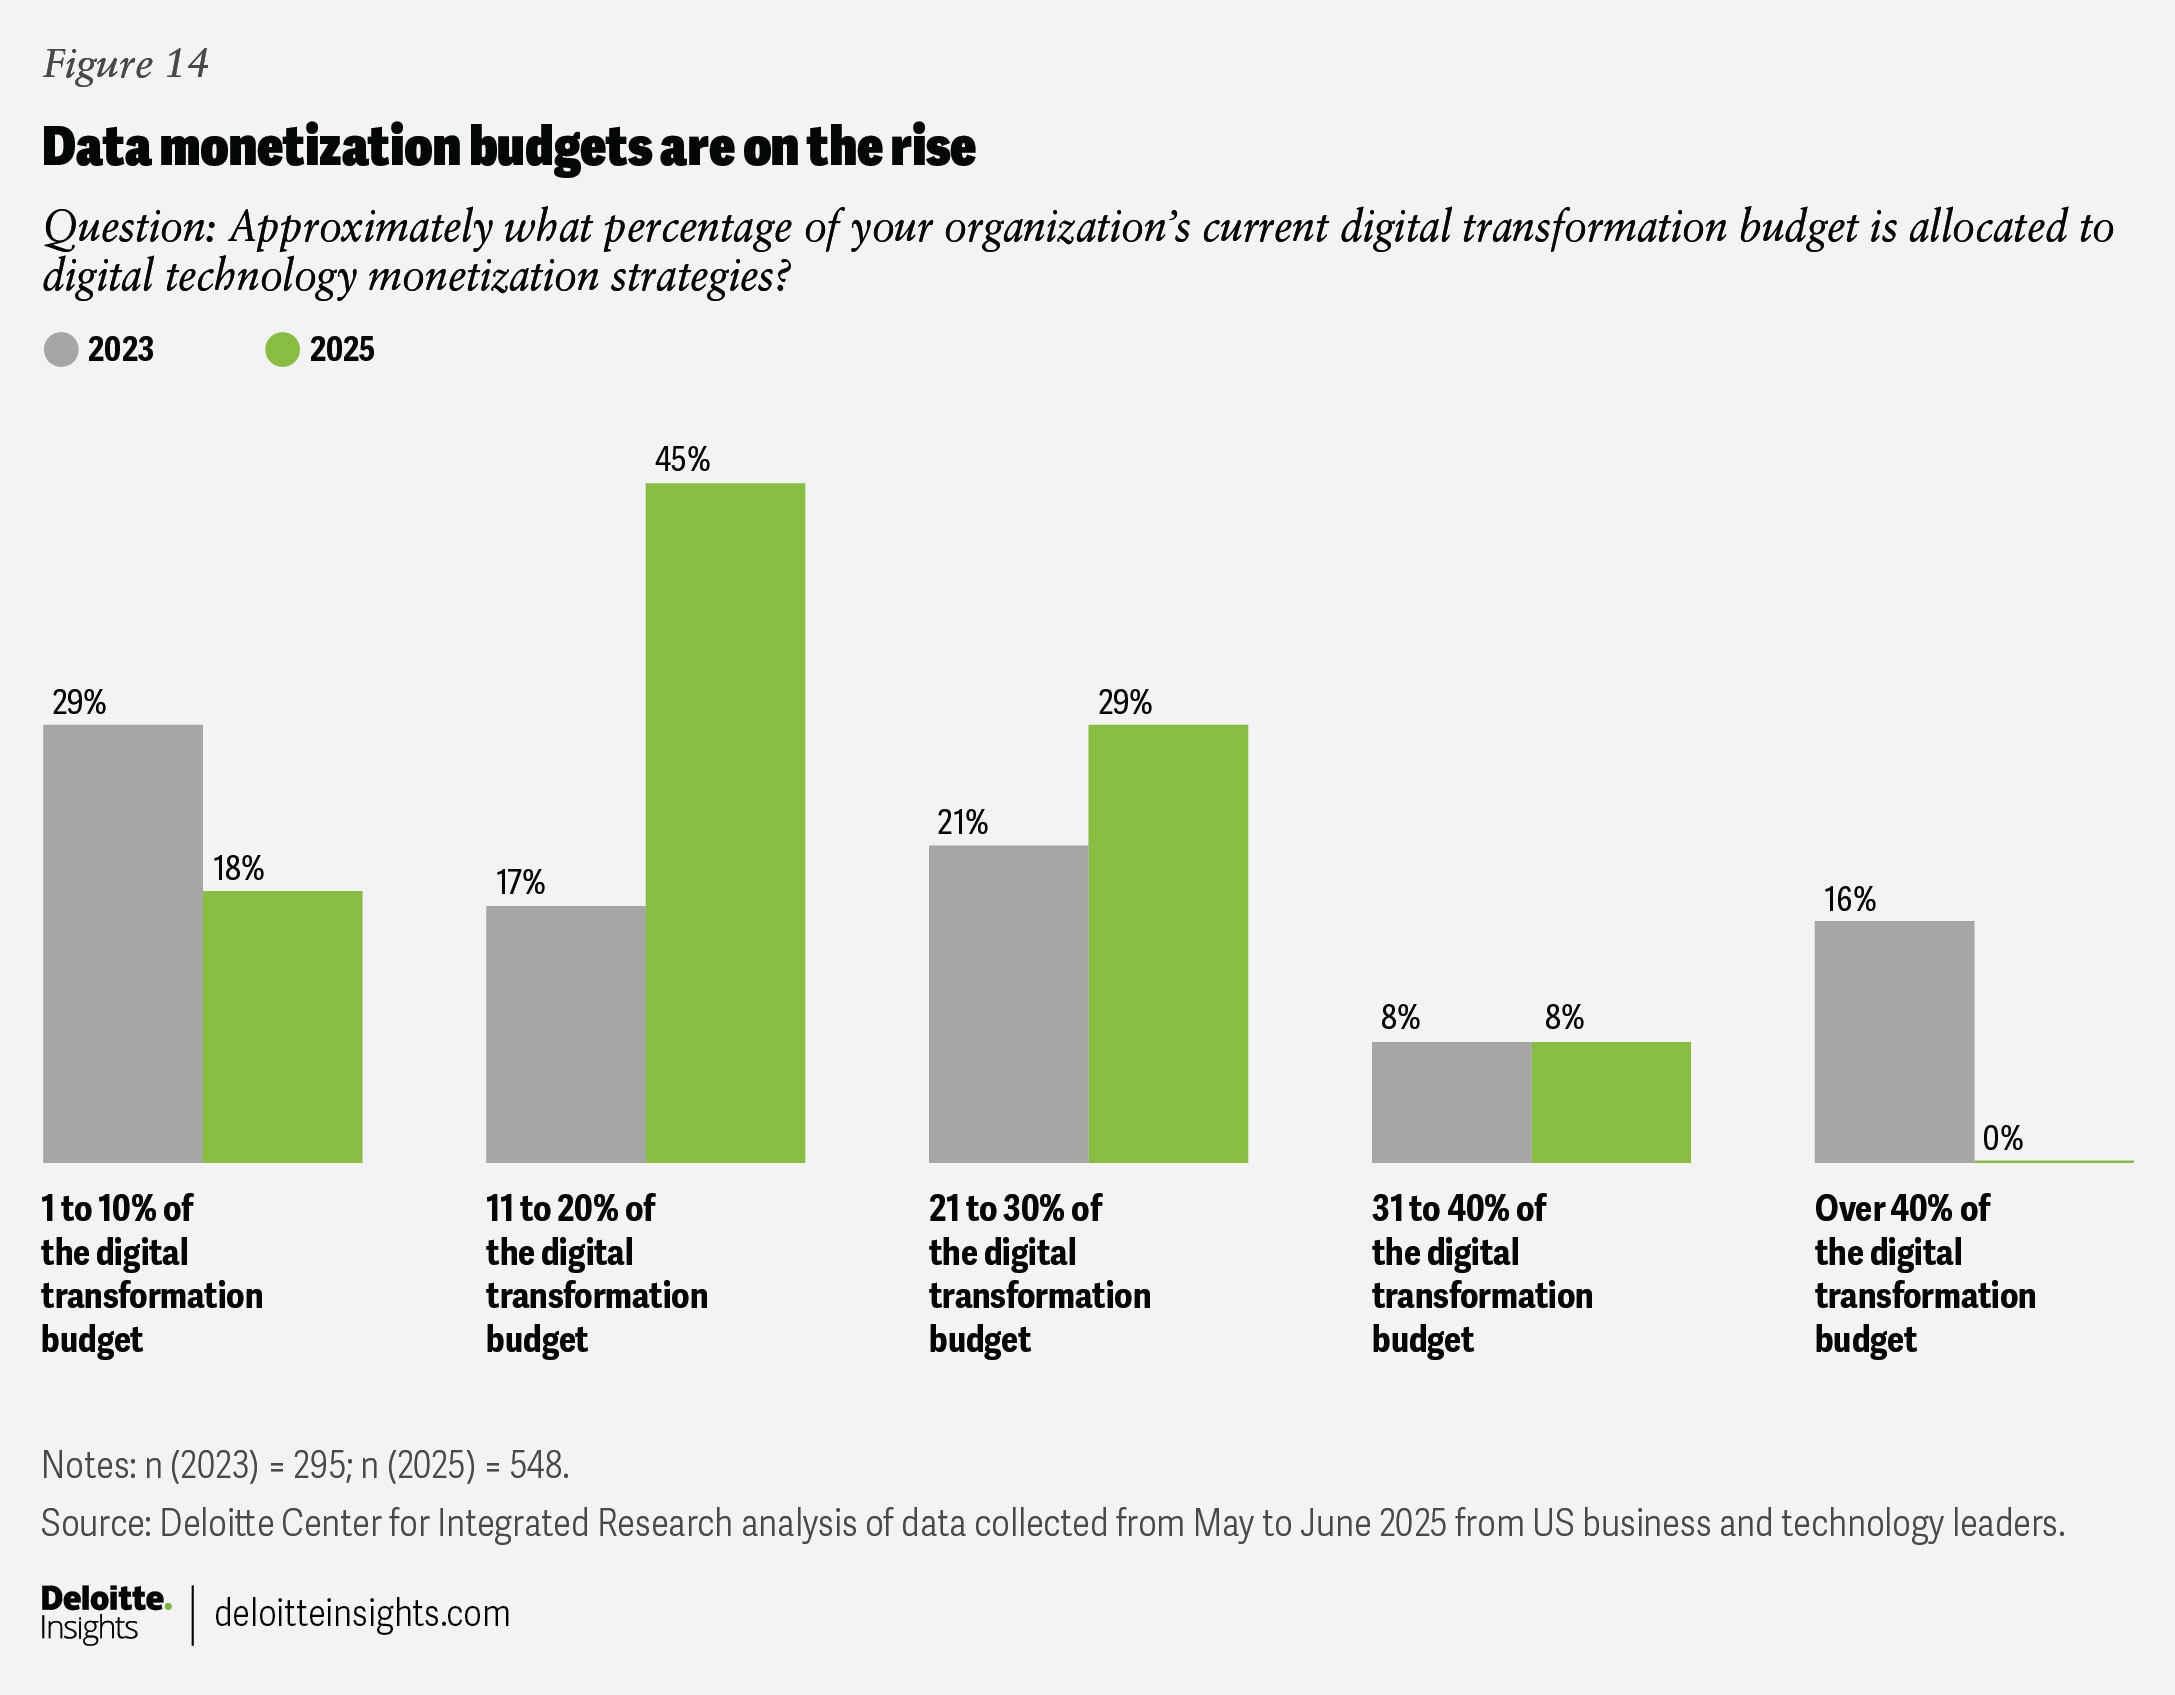
More surveyed organizations are allocating budgets to monetization strategies
Since 2023, the share of digital budgets devoted to monetization has grown from 18% to 20% on average (figure 14)—roughly US$400 million for a company with US$13 billion in revenue. The growth is concentrated among the 45% of respondents who now allocate 11% to 20% of their digital spending to monetization, up from 17% of respondents who did the same two years ago. Digging deeper, some sectors stand out in advancing their monetization strategies. We saw notable rises from energy, resources, and industrials firms, for example, which are especially likely to treat data as an asset.
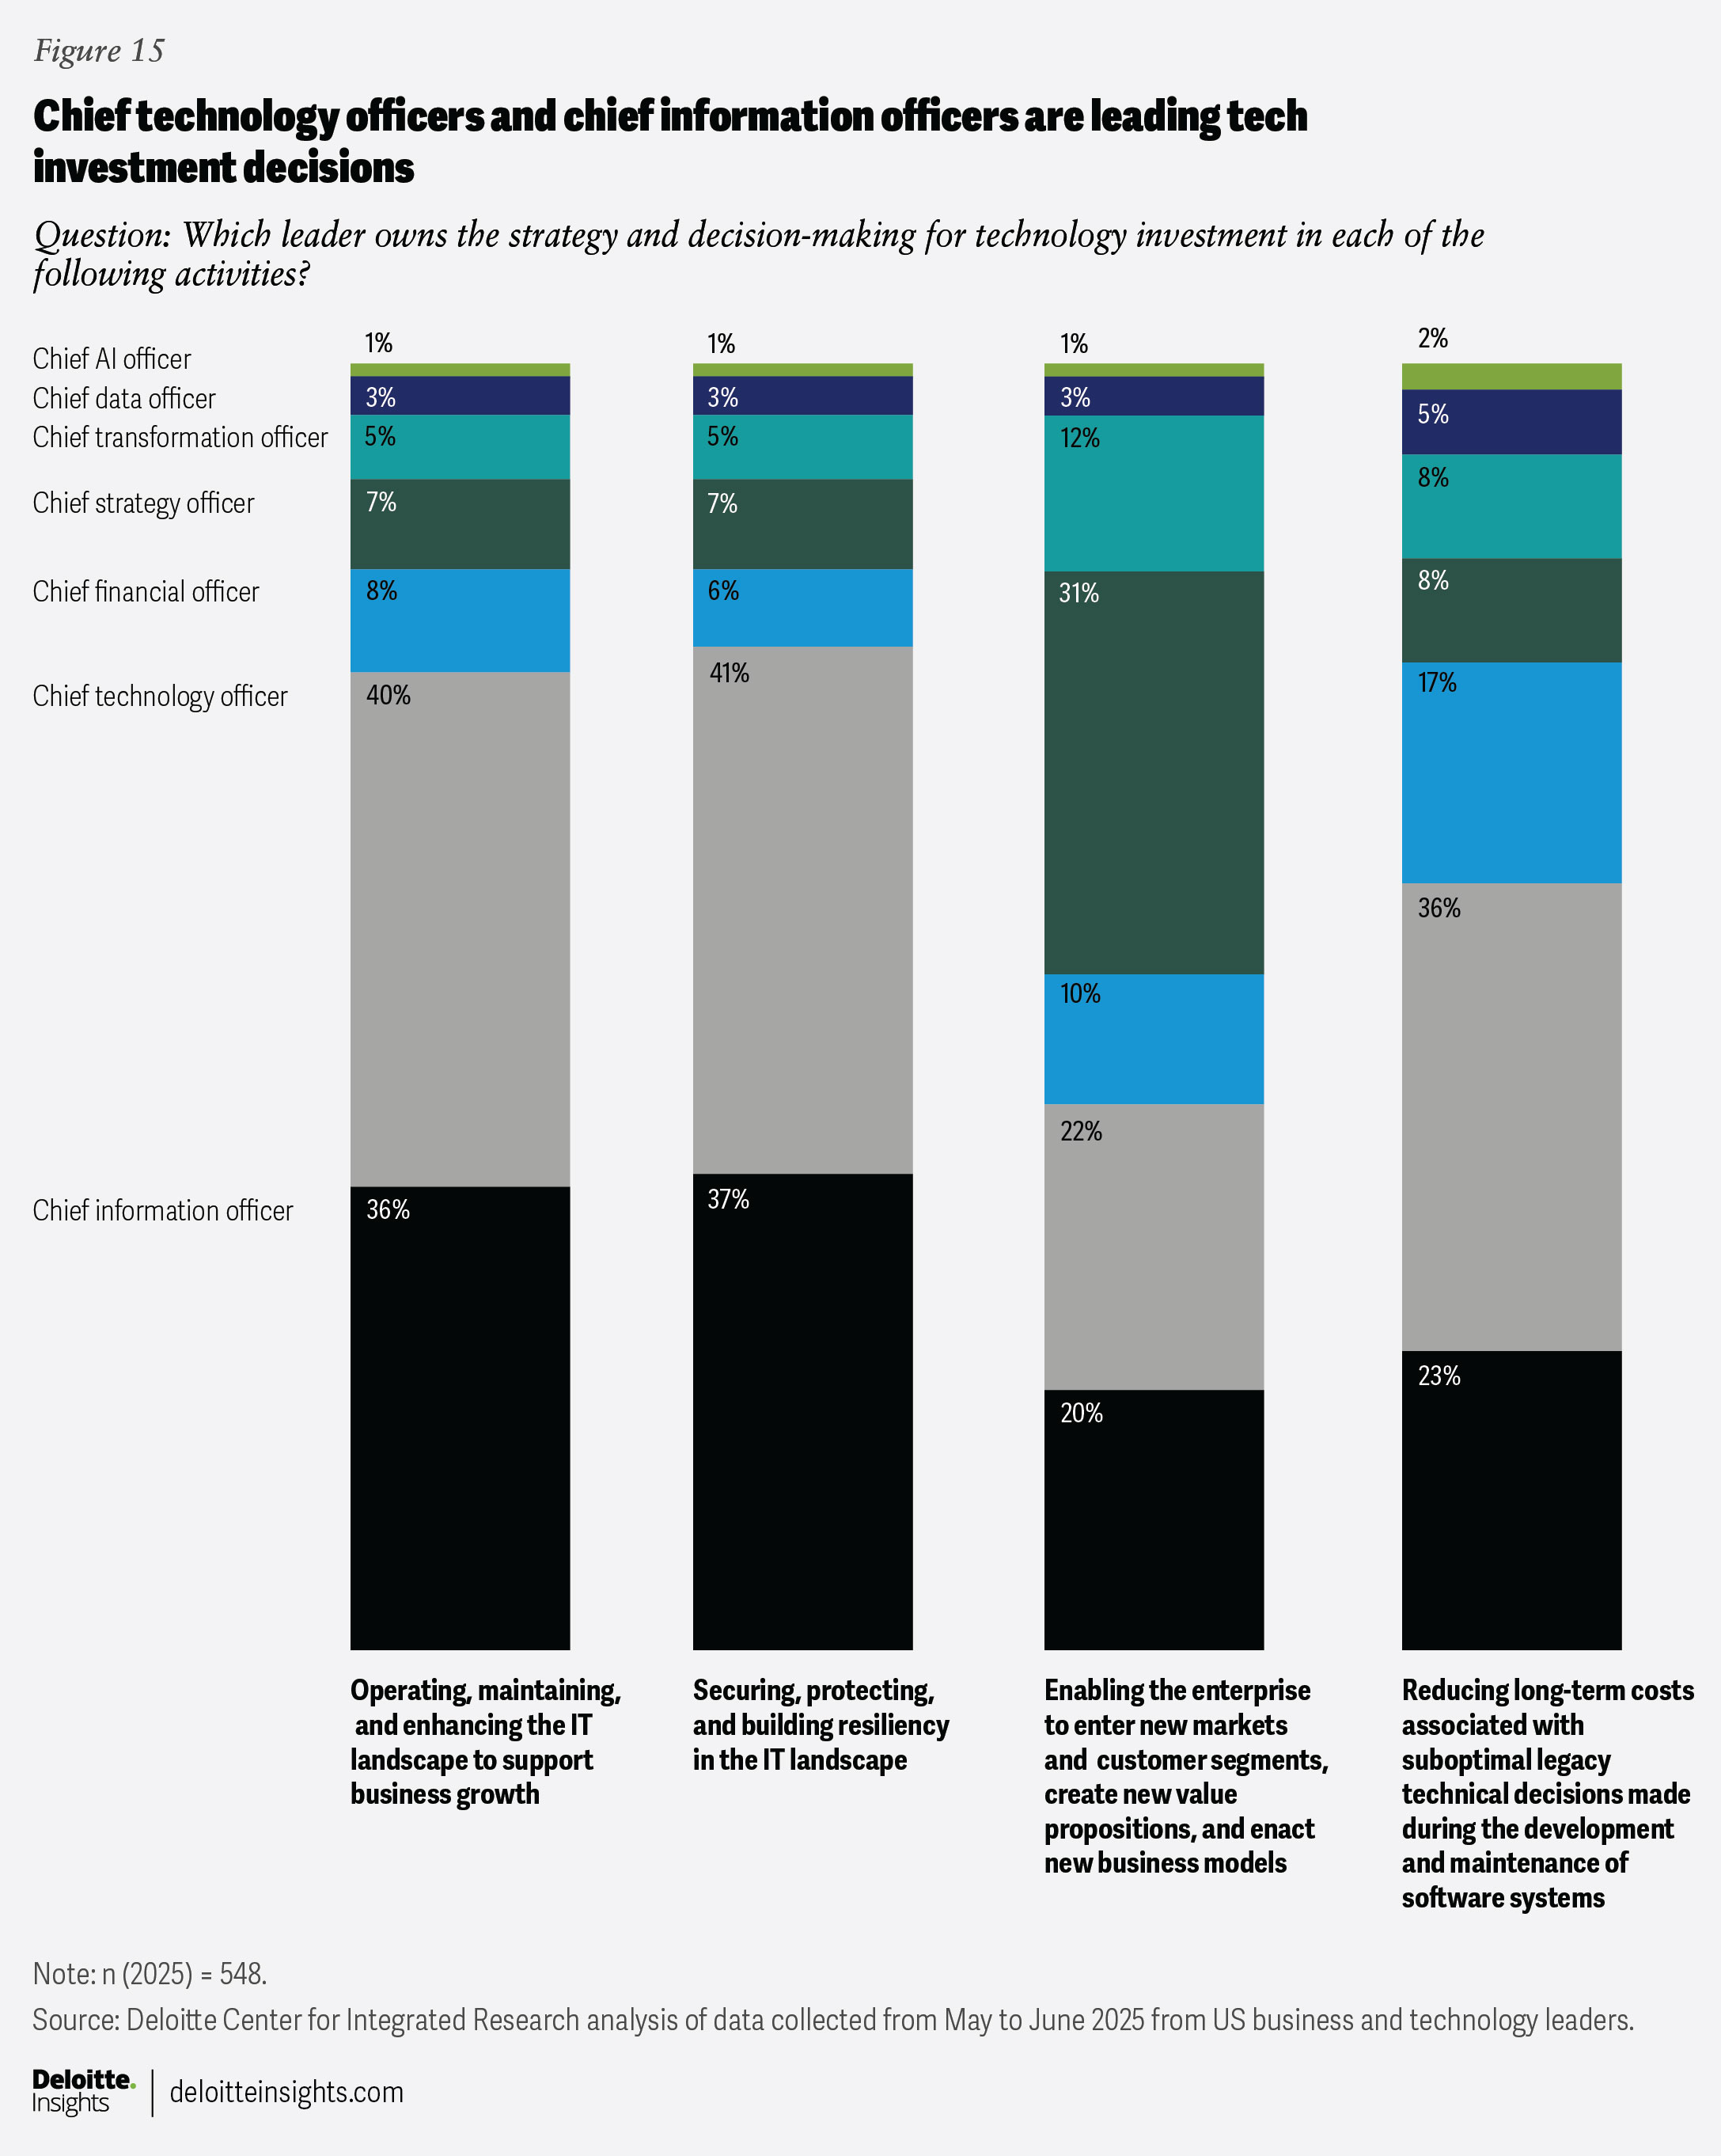
C-suite alignment is important to finding balance
Our 2025 survey reveals that the chief technology officer is the primary leader responsible for tech investment decision-making across IT operations, security and resilience, and legacy tech, closely followed by the chief information officer (figure 15).
The challenge in evaluating value measurements is that the leaders leading an organization’s digital initiatives—chief financial officers, chief information officers, and chief technology officers—often define success differently. Some emphasize ROI, others focus on EBITDA or KPIs. This misalignment could strand value across the various measures we’ve discussed.
While there are a multitude of ways to achieve digital value, leadership alignment is likely the single biggest unlock. Impact can come not just from tracking more metrics, but from aligning leadership around a shared set of value measures. Our analysis identified four investment and measurement archetypes among respondents:
- Strategists (chief strategy officers leading): They focus on enterprise value attribution to digital initiatives, attributing 31% to 40% of their enterprise value to digital initiatives. They report large or very large ROI across 50% of the 20 technologies—making them the least likely to do so.
- Tech capability builders (chief technology officers leading): They report strong ROI from technologies—across 74% of the 20 technologies assessed. Yet almost half of these leaders report only achieving less than a third of their potential enterprise ROI from digital initiatives.
- Digital mavens (chief information officers or chief technology officers leading): They excel at KPI tracking and tech capability ROI, but are weaker in reporting EBITDA value. They measure more than 90% of KPIs on average and expect high value gains from 78% of those. They report ROI for 93% of the 20 technologies assessed, but report the lowest EBITDA value at just 20% of revenue.
- Profitability masters (chief data officers or chief transformation officers leading): These investors balance KPI measurement, KPI ROI, and EBITDA and achieve the strongest enterprise ROI from digital initiatives. They measure 76% of KPIs on average and expect high value gains from 52% of those. With high ROI from 80% technology investments, this group achieves EBITDA at 41% of revenue and attributes 61% to 70% of enterprise ROI to digital initiatives.
Predictive analysis of value outcomes from AI automation in the next three years sharpens the insight. Organizations tend to gravitate toward different value measures based on their digital transformation leader’s functional role (for example, whether the leader is a chief strategy officer or chief technology officer). Chief strategy officers boost KPI ROI, chief technology officers raise technical ROI, and chief financial officers are more likely to achieve higher EBITDA (above the survey average of 24% of revenue). Organizations should consider and understand such value trade-offs.
When only one lens dominates, value seems to be partial. When aligned, however, the portfolio of measures stacks into exponential impact (figure 15). Treat that as a design choice. Establish a shared value scorecard across the value lenses and consider tying a portion of leadership compensation to this blended score.
AI can’t carry the weight alone, nor can any single C-suite perspective. Unlocking full value may require integrating measurement approaches, balancing near- and long-term priorities, and aligning leadership incentives around enterprisewide outcomes.
Challenges to digital transformation persist
Challenges to digital transformation remain persistent year over year, but some are rising to the top. Misaligned incentives ranked as the top barrier, followed by a five-way tie among legacy systems, lack of internal technical expertise, security concerns, lack of a transformation strategy, and insufficient funding—all cited by almost 60% of respondents. Notably, lack of internal technical expertise saw the largest increase year-over-year from 52% to 58%, highlighting the growing skills gap amid rapid AI adoption. This seems to underscore the importance of building hands-on capabilities for machine learning operations, gen AI safety, and agent orchestration within delivery teams.
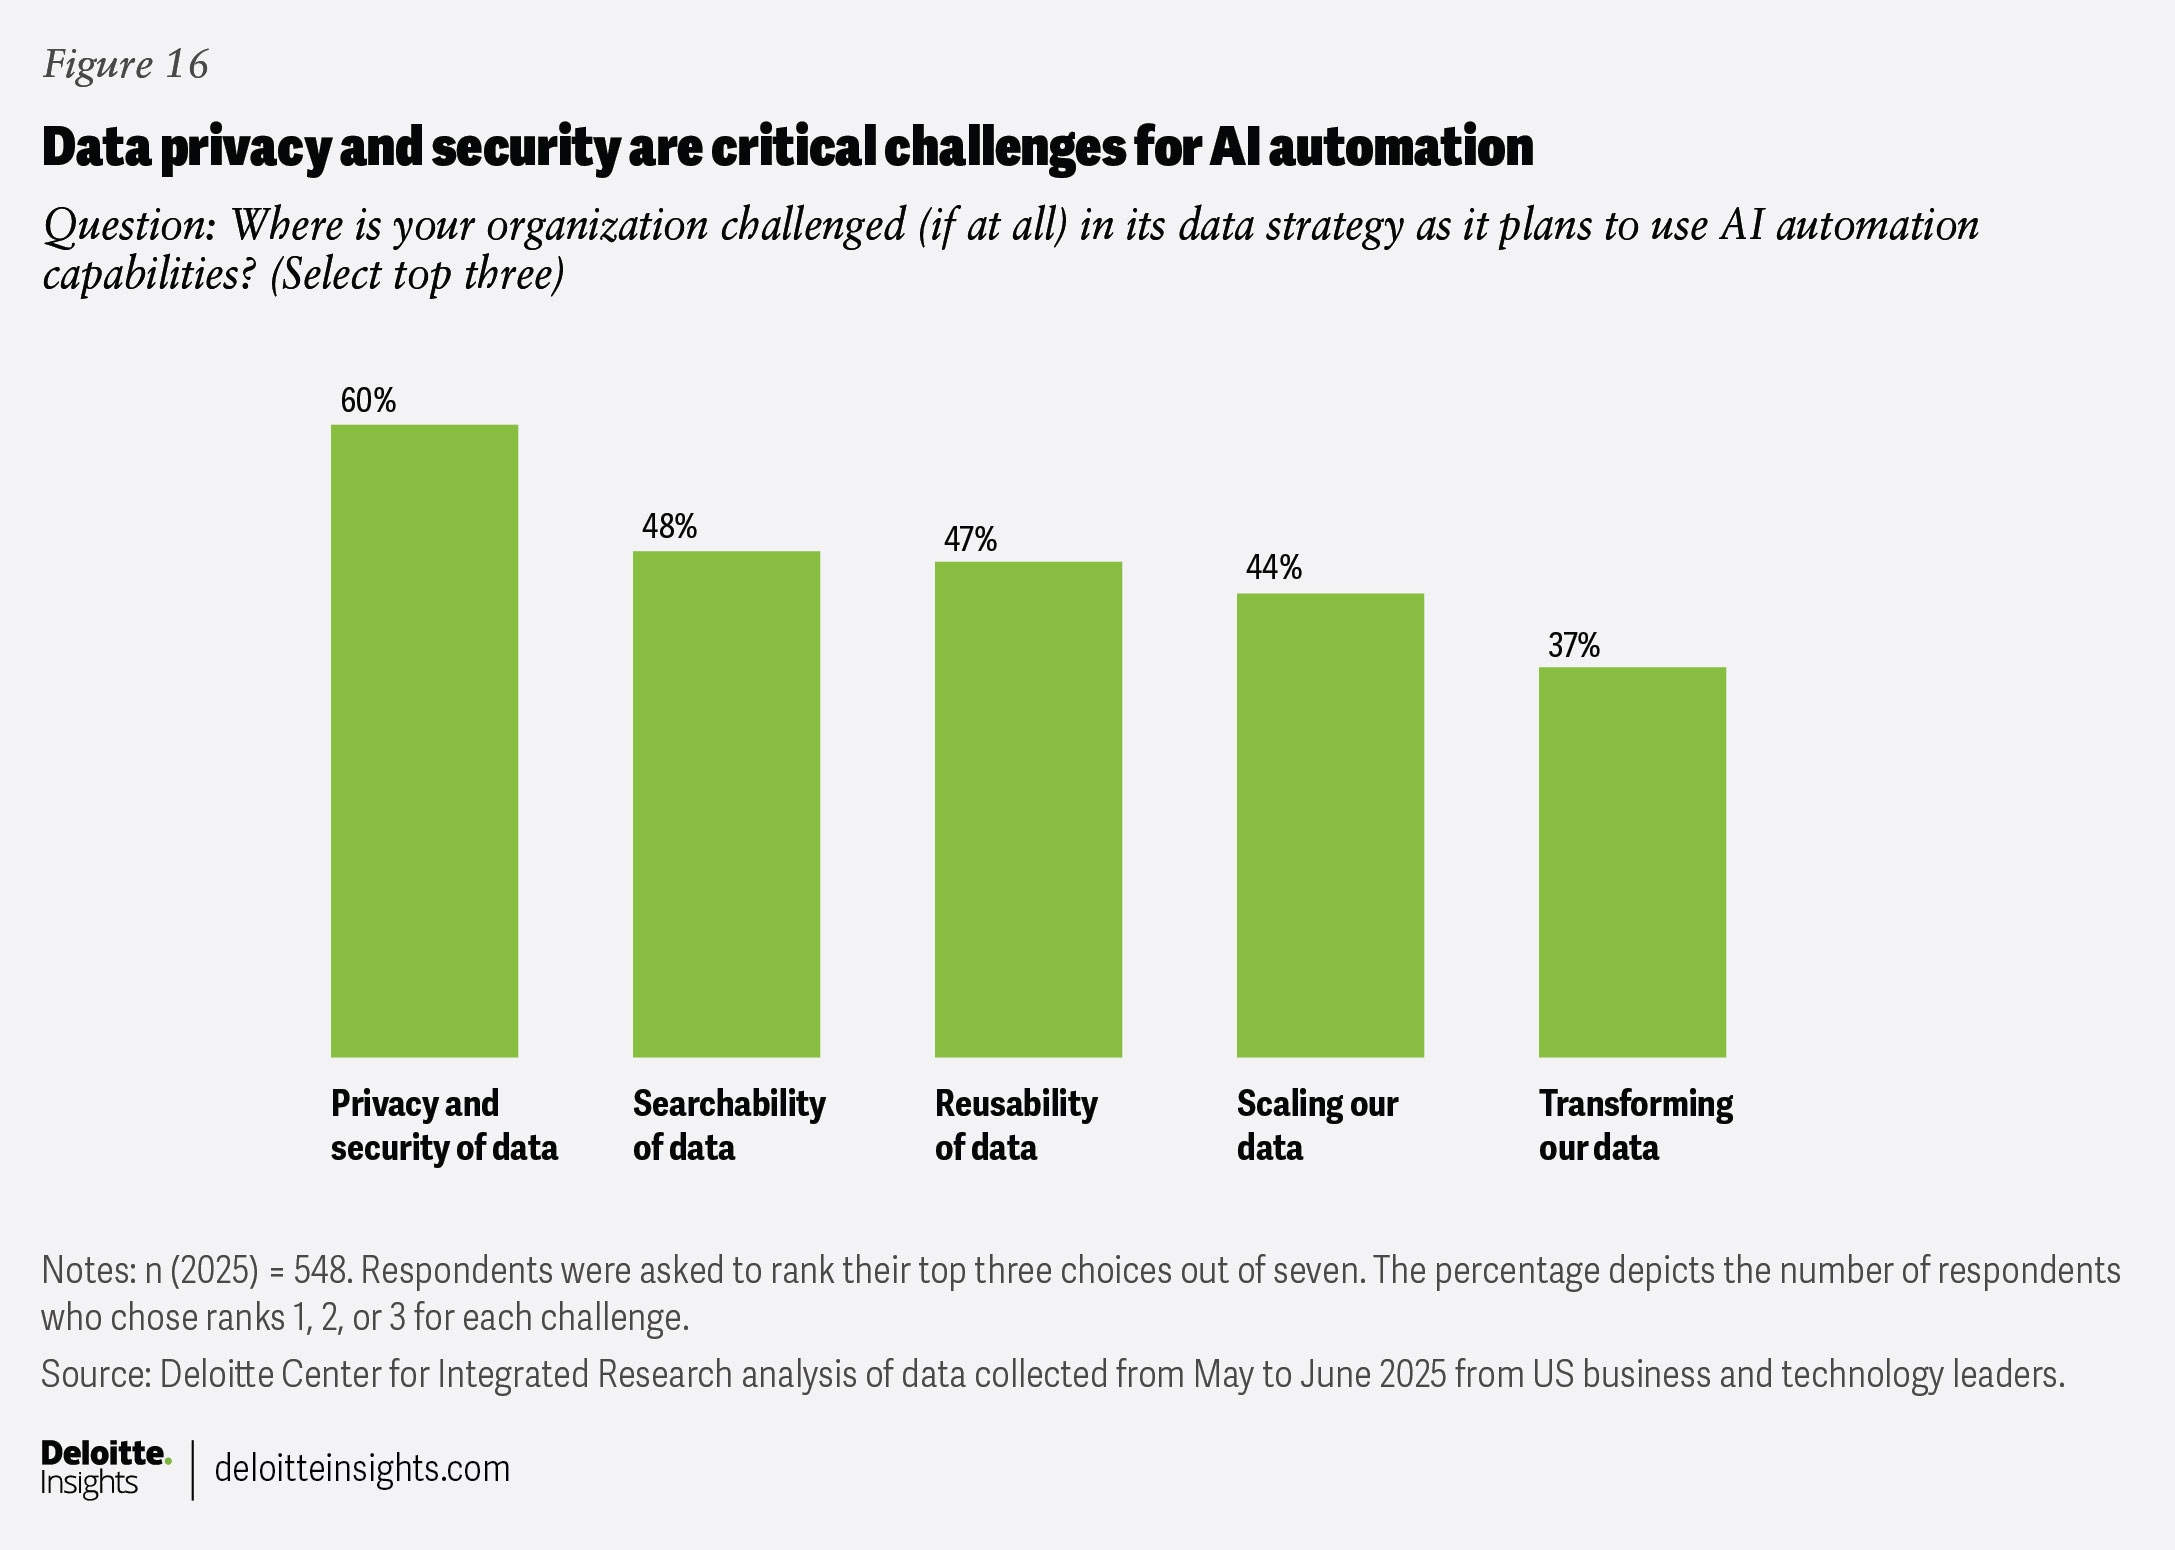
Sixty percent of organizations cited data privacy and security as a major hurdle to AI automation (figure 16). This is a particular challenge for the financial services industry, with 65% of respondents in the industry citing it as a critical challenge.
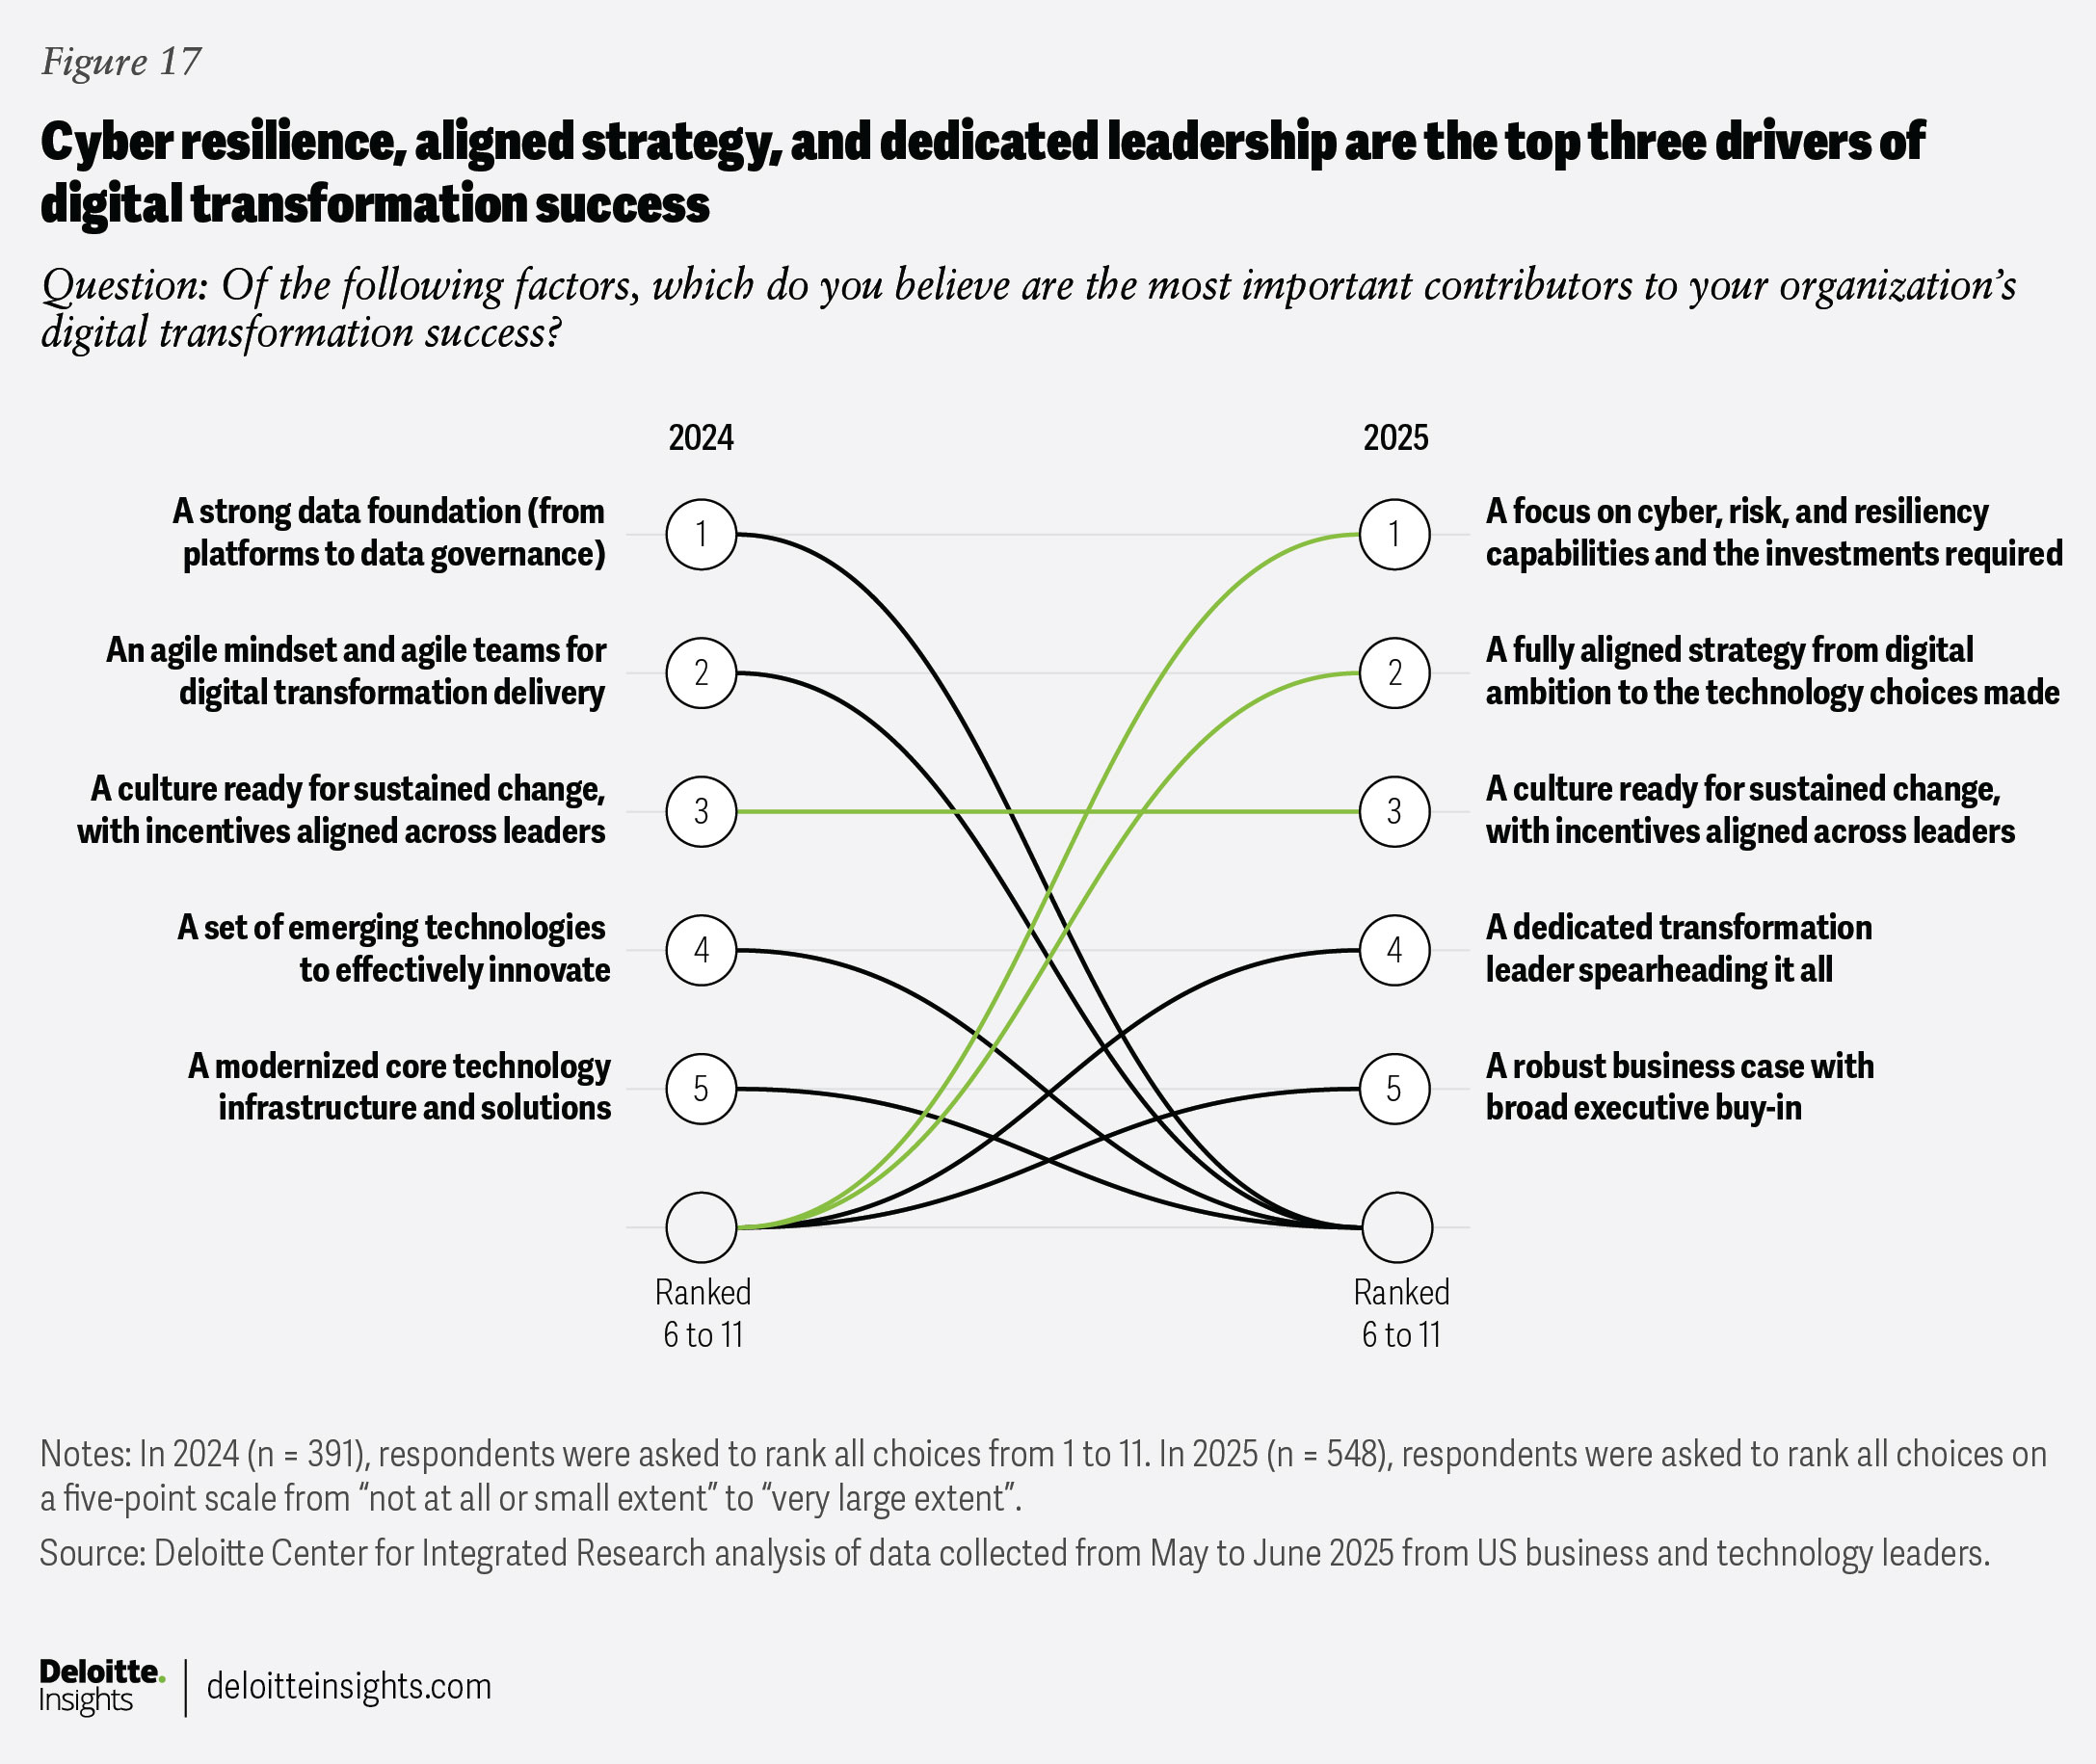
According to respondents, successfully overcoming these challenges largely hinges on three factors: cyber strategy, tech strategy alignment, and dedicated leadership (figure 17). However, given such strong headwinds, a fundamental recalibration of investment, cost, and value dynamics may also be needed.
A tech strategy innovation culture can set leaders apart—and drive real results
Cultivating a strong tech strategy innovation culture7 is not just a nice-to-have; it is a defining factor that can drive meaningful value. Our analysis identified seven strategic, innovation-building actions that organizations could consider implementing:
- Experimenting with new technologies
- Scaling new technologies
- Adopting an agile mindset
- Cocreating edge solutions with technology vendors
- Training internal staff on the latest edge solutions
- Appointing a tech leader to set an innovation-led tech strategy
- Encouraging diverse thinking
Based on the extent to which 2025 respondents implemented these actions, we analyzed key behaviors and outcomes across three groups: strategy innovation leaders, followers, and laggards (see methodology).
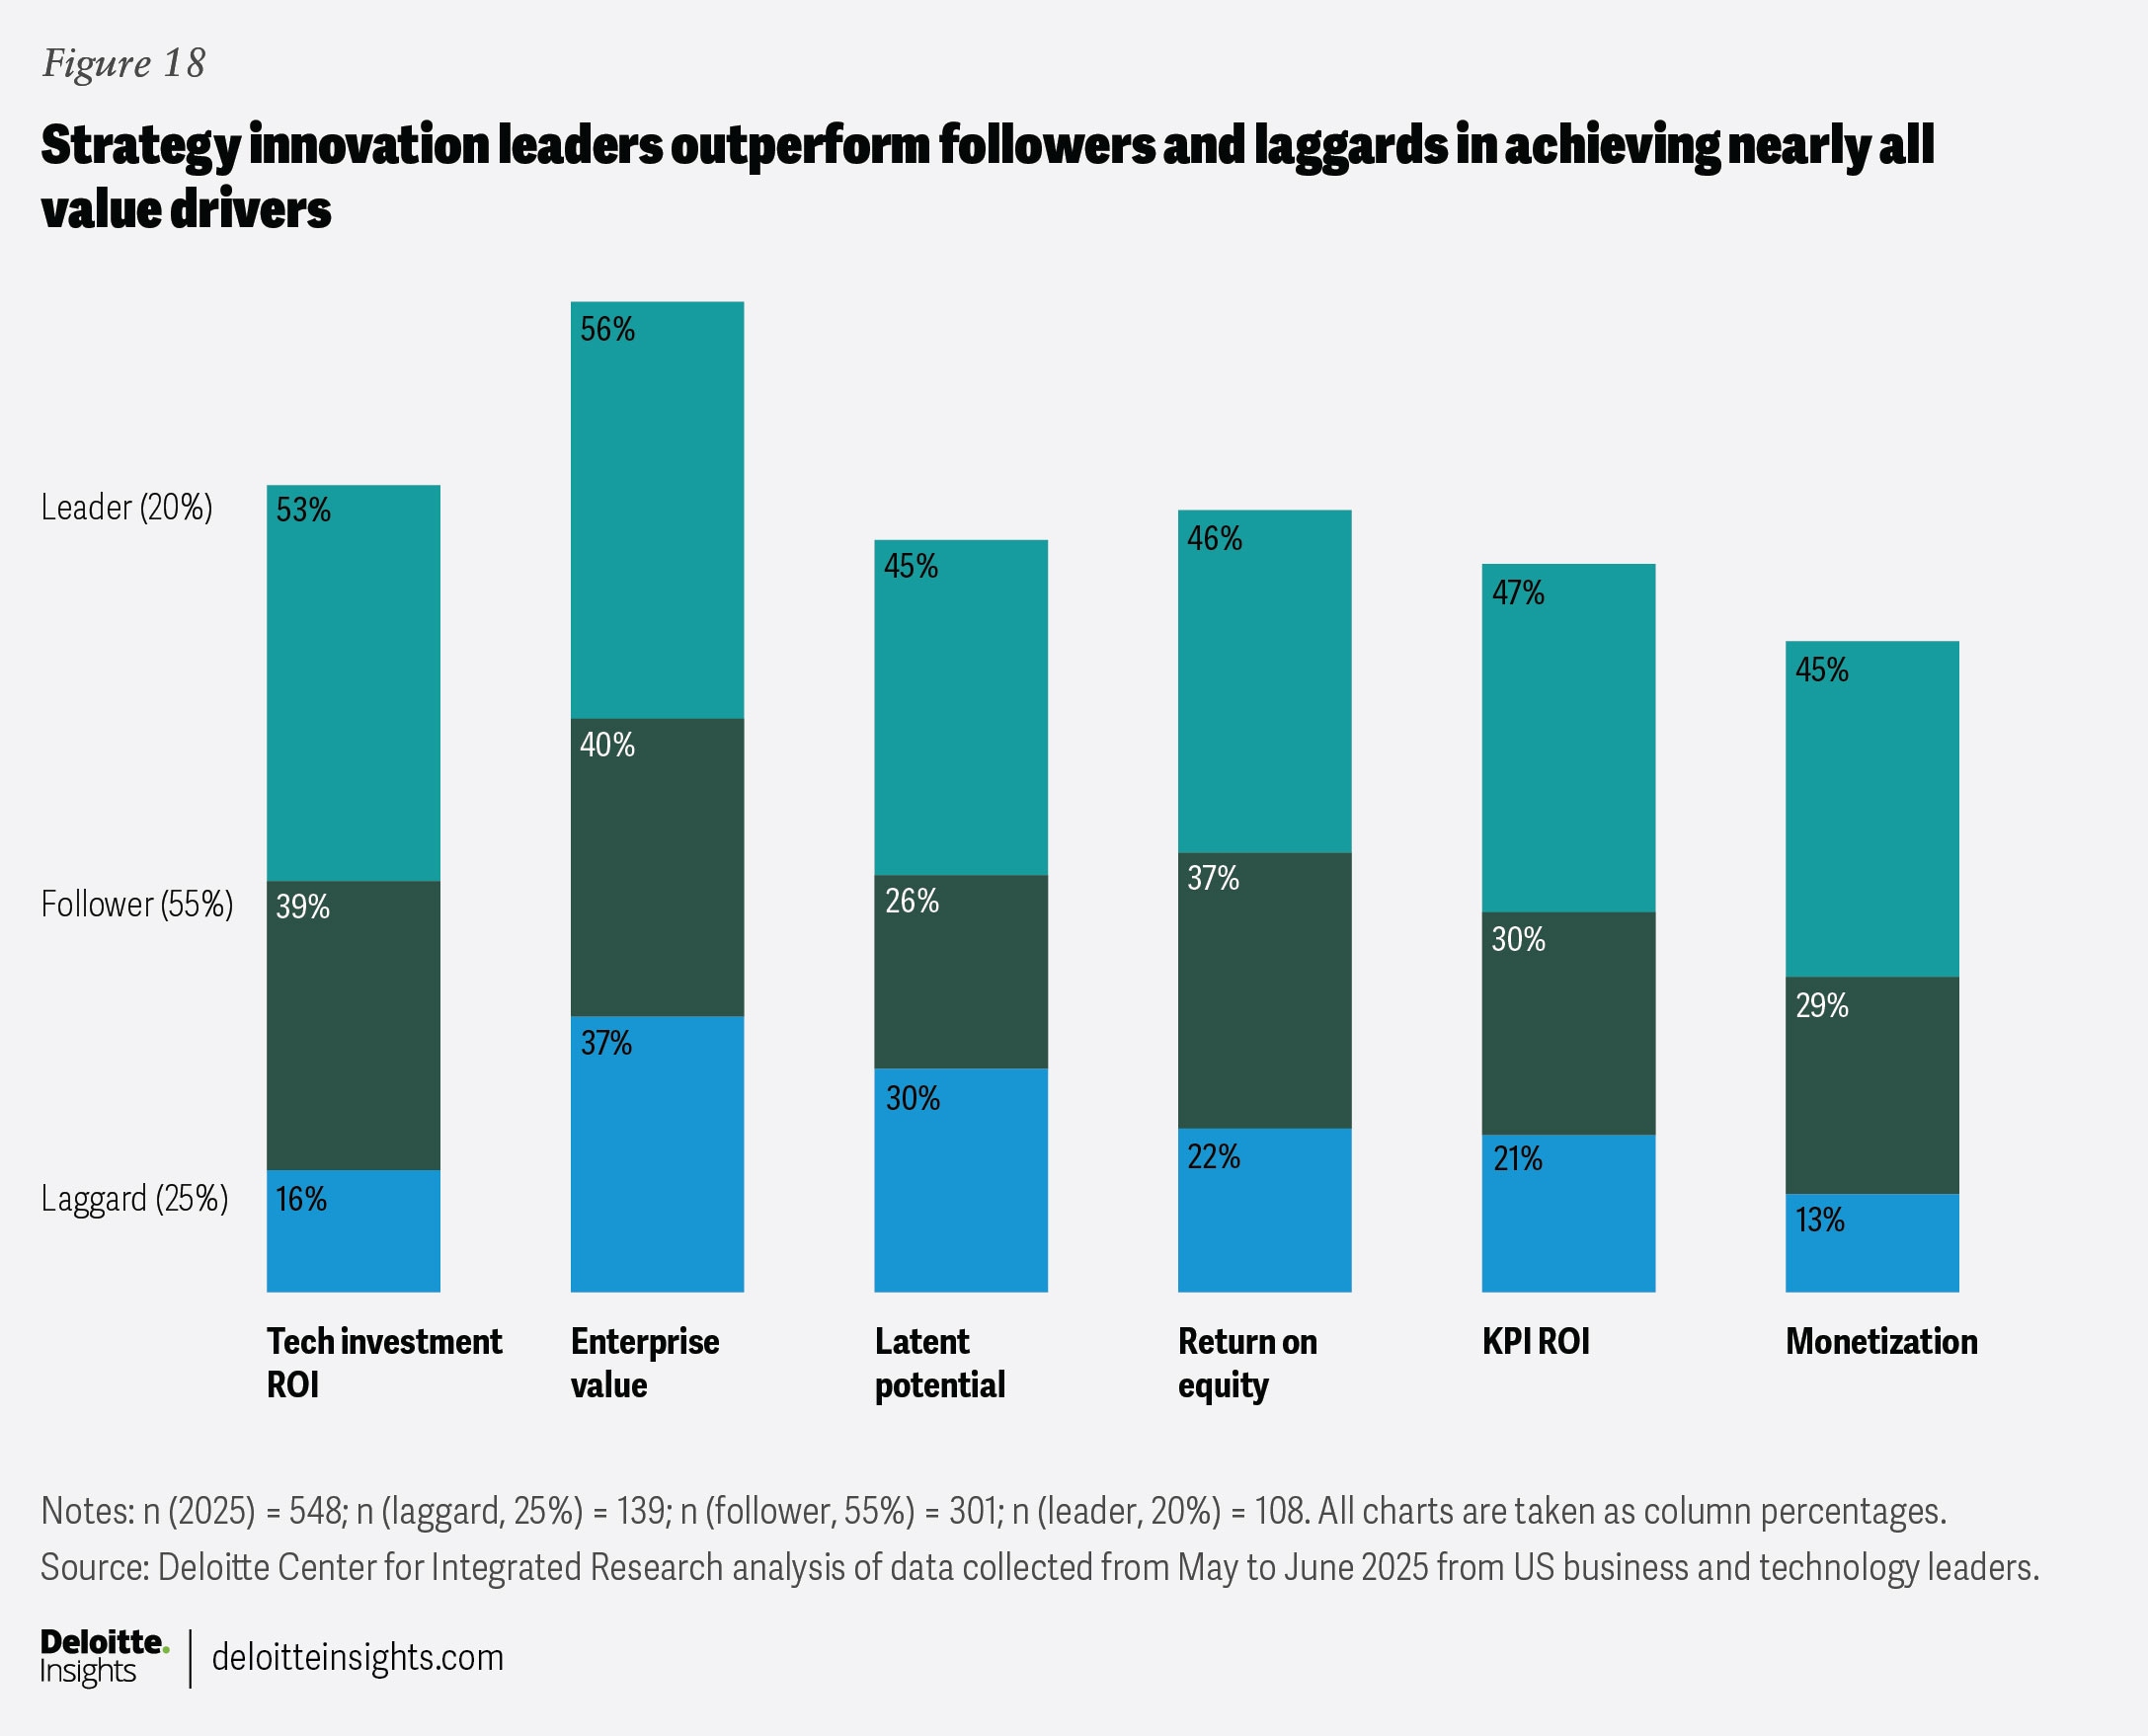
Strategy innovation leaders—organizations most mature in executing these actions—outperform the two other groups in achieving a greater number of value drivers. They report higher tech investment ROI, winning across both foundational and emerging technologies, and realizing greater returns on equity and KPIs. Notably, they attribute over 40% of their enterprise value to digital initiatives and recognize more than 40% in latent potential for future growth (figure 18).
Their ability to build a strong innovation culture appears to be rooted in deep engagement from the chief technology officer, a commitment to holistic and regular value measurement, a willingness to invest in AI for long-term outcomes, and to spend more than their peers on monetization and AI automation.
Balancing AI ambitions with long-term resilience
The data in our 2025 analysis shows that AI is consuming digital budgets at a significant rate compared to the rest of the tech estate. Value creation is real, but uneven—CFOs, CIOs, and CTOs are often pulling in different directions, possibly leaving enterprise value stranded in the gaps. To avoid AI overreach that boosts hype but erodes resilience, leaders should focus on raising digital budgets to match ambition, measuring value beyond ROI, and aligning leadership incentives to enterprisewide outcomes. Those who fail may chase short-term wins, but sacrifice long-term advantage, while those who succeed may redefine digital as the backbone of enterprise growth.
Methodology
Deloitte’s 2025 tech value research, fielded in May and June of 2025, surveyed 548 business and technology decision-makers across five industries (consumer; energy, resources, and industrials; financial services; life sciences and health care; and technology, media, and telecommunications). Respondents from both privately held and public organizations had a minimum annual revenue of US$500 million and held roles at the director level or above, including as C-suite executives and board members. The survey draws on longitudinal data that Deloitte’s Center for Integrated Research has maintained since 2023.
Cluster analysis
Deloitte’s Machine Intelligence and Data Science team used 41 variables derived from the survey questions for the cluster analysis. We used a traditional methodology to conduct a two-stage mixed cluster analysis, which is a set of statistical methods for processing data by organizing items into groups (called clusters), based on how strongly associated they are; for example, clustering the workforce by job functions or duties. This technique is semi-supervised, which means we do not begin analysis with any preconceived notion of how many clusters exist in the data. We determine the likely number of clusters through various tests (for example, scree plots derived from the agglomeration schedule of hierarchical clustering). We then ran the k-means clustering algorithm, which requires a set number of clusters to be specified.
The researchers determined the value of ‘k’ in the k-means clustering from the scree plot’s indication of diminishing marginal returns on additional clustering from the hierarchical clustering analysis. Respondents were clustered into four groups: right-tracking the strategy (group 1), tech capability builders (group 2), digital mavens (group 3), and profitability masters (group 4).
Predictive analysis
Deloitte’s Machine Intelligence and Data Science team used several multivariate logistic regression models to analyze probable relationships among different variables and outcomes in Deloitte’s tech value survey.
The model took the survey responses and determined the probability (by percentage) that an independent variable (for example, the number of extensive contributors to realizing an organization’s digital ambition [0 to 12]) might be associated with a given outcome (for example, gaining large or very large value from 100% of technology investments). The team controlled certain influential firmographic factors, tuning the model to provide reliable insight into technology value behaviors and outcomes.
The Deloitte Center for Integrated Research used informal path analysis to examine probabilistic relationships that influence outcomes—controlling what they can’t change—and stacking value drivers to achieve multiplier effects.
Index analysis for tech strategy innovation leaders
This leader index was created by determining how many of the seven tech strategy innovation actions each organization implemented to a “very large extent” or “completely.” Organizations that matched four to seven actions were classified as leaders; those matching two to three actions as followers; and those matching zero to one action as laggards.
Continue the Conversation
Meet the industry leaders
Tim Smith
Gregory Dost
Garima Dhasmana
Parth Patwari
Diana Kearns-Manolatos
by
Tim Smith
Gregory Dost
Garima Dhasmana
Parth Patwari
Diana Kearns-Manolatos
Iram Parveen
The authors would like to thank David Levin, Ph.D., for his contributions to survey design and analysis, which were pivotal in ideating the research topic and hypothesis.
We would also like to thank Dominic Rasini and Prakul Sharma for their thoughtful feedback on the draft, as well as Ahmed Alibage and Muskan Bhatla for their valuable support with data deep dives.
Our appreciation goes to the marketing team: Ireen Jose, Jackie Polson, Linnea Johnson, Lisa Beauchamp, Rachel Freya Rosenberg, Sarah Q Long, and Saurabh Rijhwani for their guidance and leadership in extending the impact of these insights. Special thanks to Rajesh Medisetti for developing the Tableau dashboard to help amplify the survey data internally.
We are grateful to the Deloitte Insights team, including Annalyn Kurtz and Corrie Commisso for their editorial input; Jim Slatton, Molly Piersol, and Natalie Pfaff for their creative vision; and Blythe Hurley and Prodyut Borah for their production support.
Finally, we would like to acknowledge the KS&R team: Alex Capella, Bridget Maloney, Mike Nash, and Nicolas Karanian for their assistance with survey design and fielding, as well as their support in data analysis and visualization.
Survey questionnaire, fielding, analysis, and vendor management by: David Levin
Tableau dashboard development by: Rajesh Medisetti
Cover image by: Jim Slatton
Visit the Deloitte Center for Integrated Research
Access more insights on some of the most complex issues facing businesses today.