
The domino effect: Implications of chemical plant closures on supply chains
A wave of chemical plant closures is impacting supply chains, altering how and where chemicals are produced worldwide
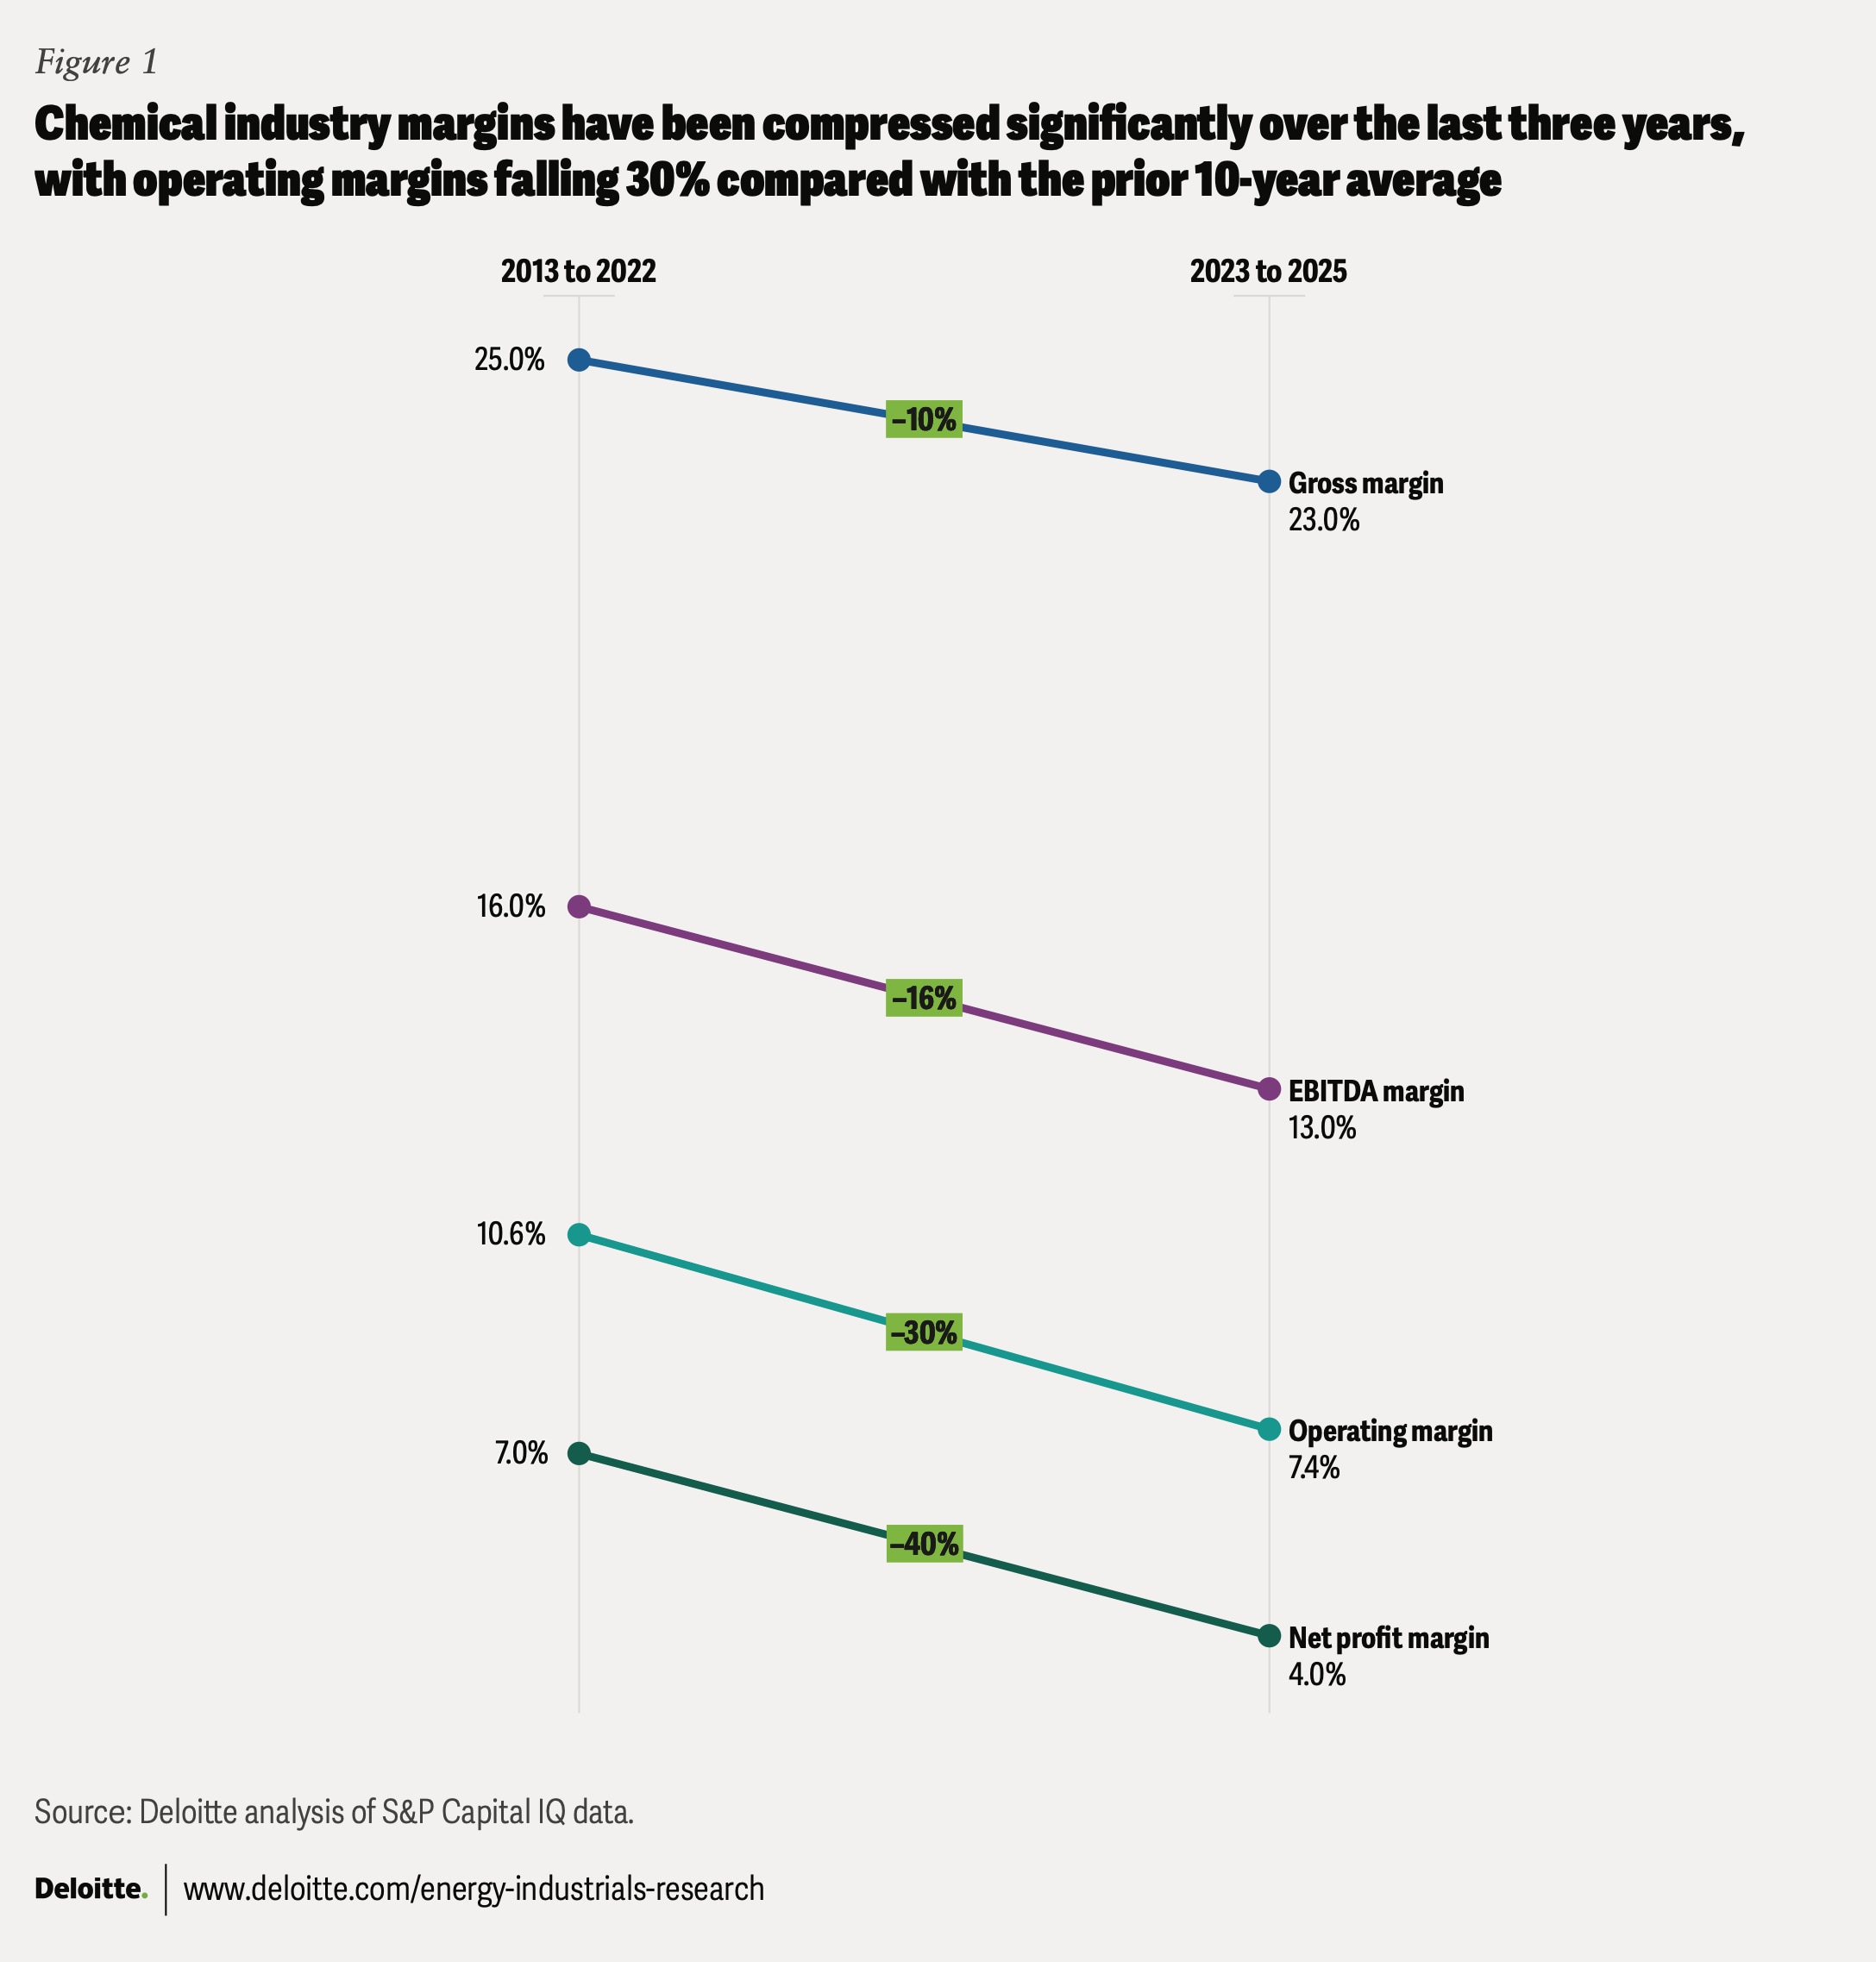
Over the past five years, a transformation has been reshaping the global chemical industry. To better understand emerging restructuring and supply chain trends, Deloitte analyzed more than 120 publicly announced chemical plant closures and mothballings globally since the start of 2022 (see methodology).1 The drivers may sound familiar: overcapacity, weak demand in several end markets, and structural disadvantages in feedstock and energy costs in some regions, all of which have compressed margins (figure 1).2
But the significance goes beyond routine restructuring. Chemical production operates within deeply interconnected value chains, where feedstocks, intermediates, and byproducts link thousands of products and industries. Plant closures can set off a domino effect across the chemical value chain where raw material flows change, intermediate supply concentrates, and the map of where things get made can be redrawn (see sidebar, “Two plants, one city”).3
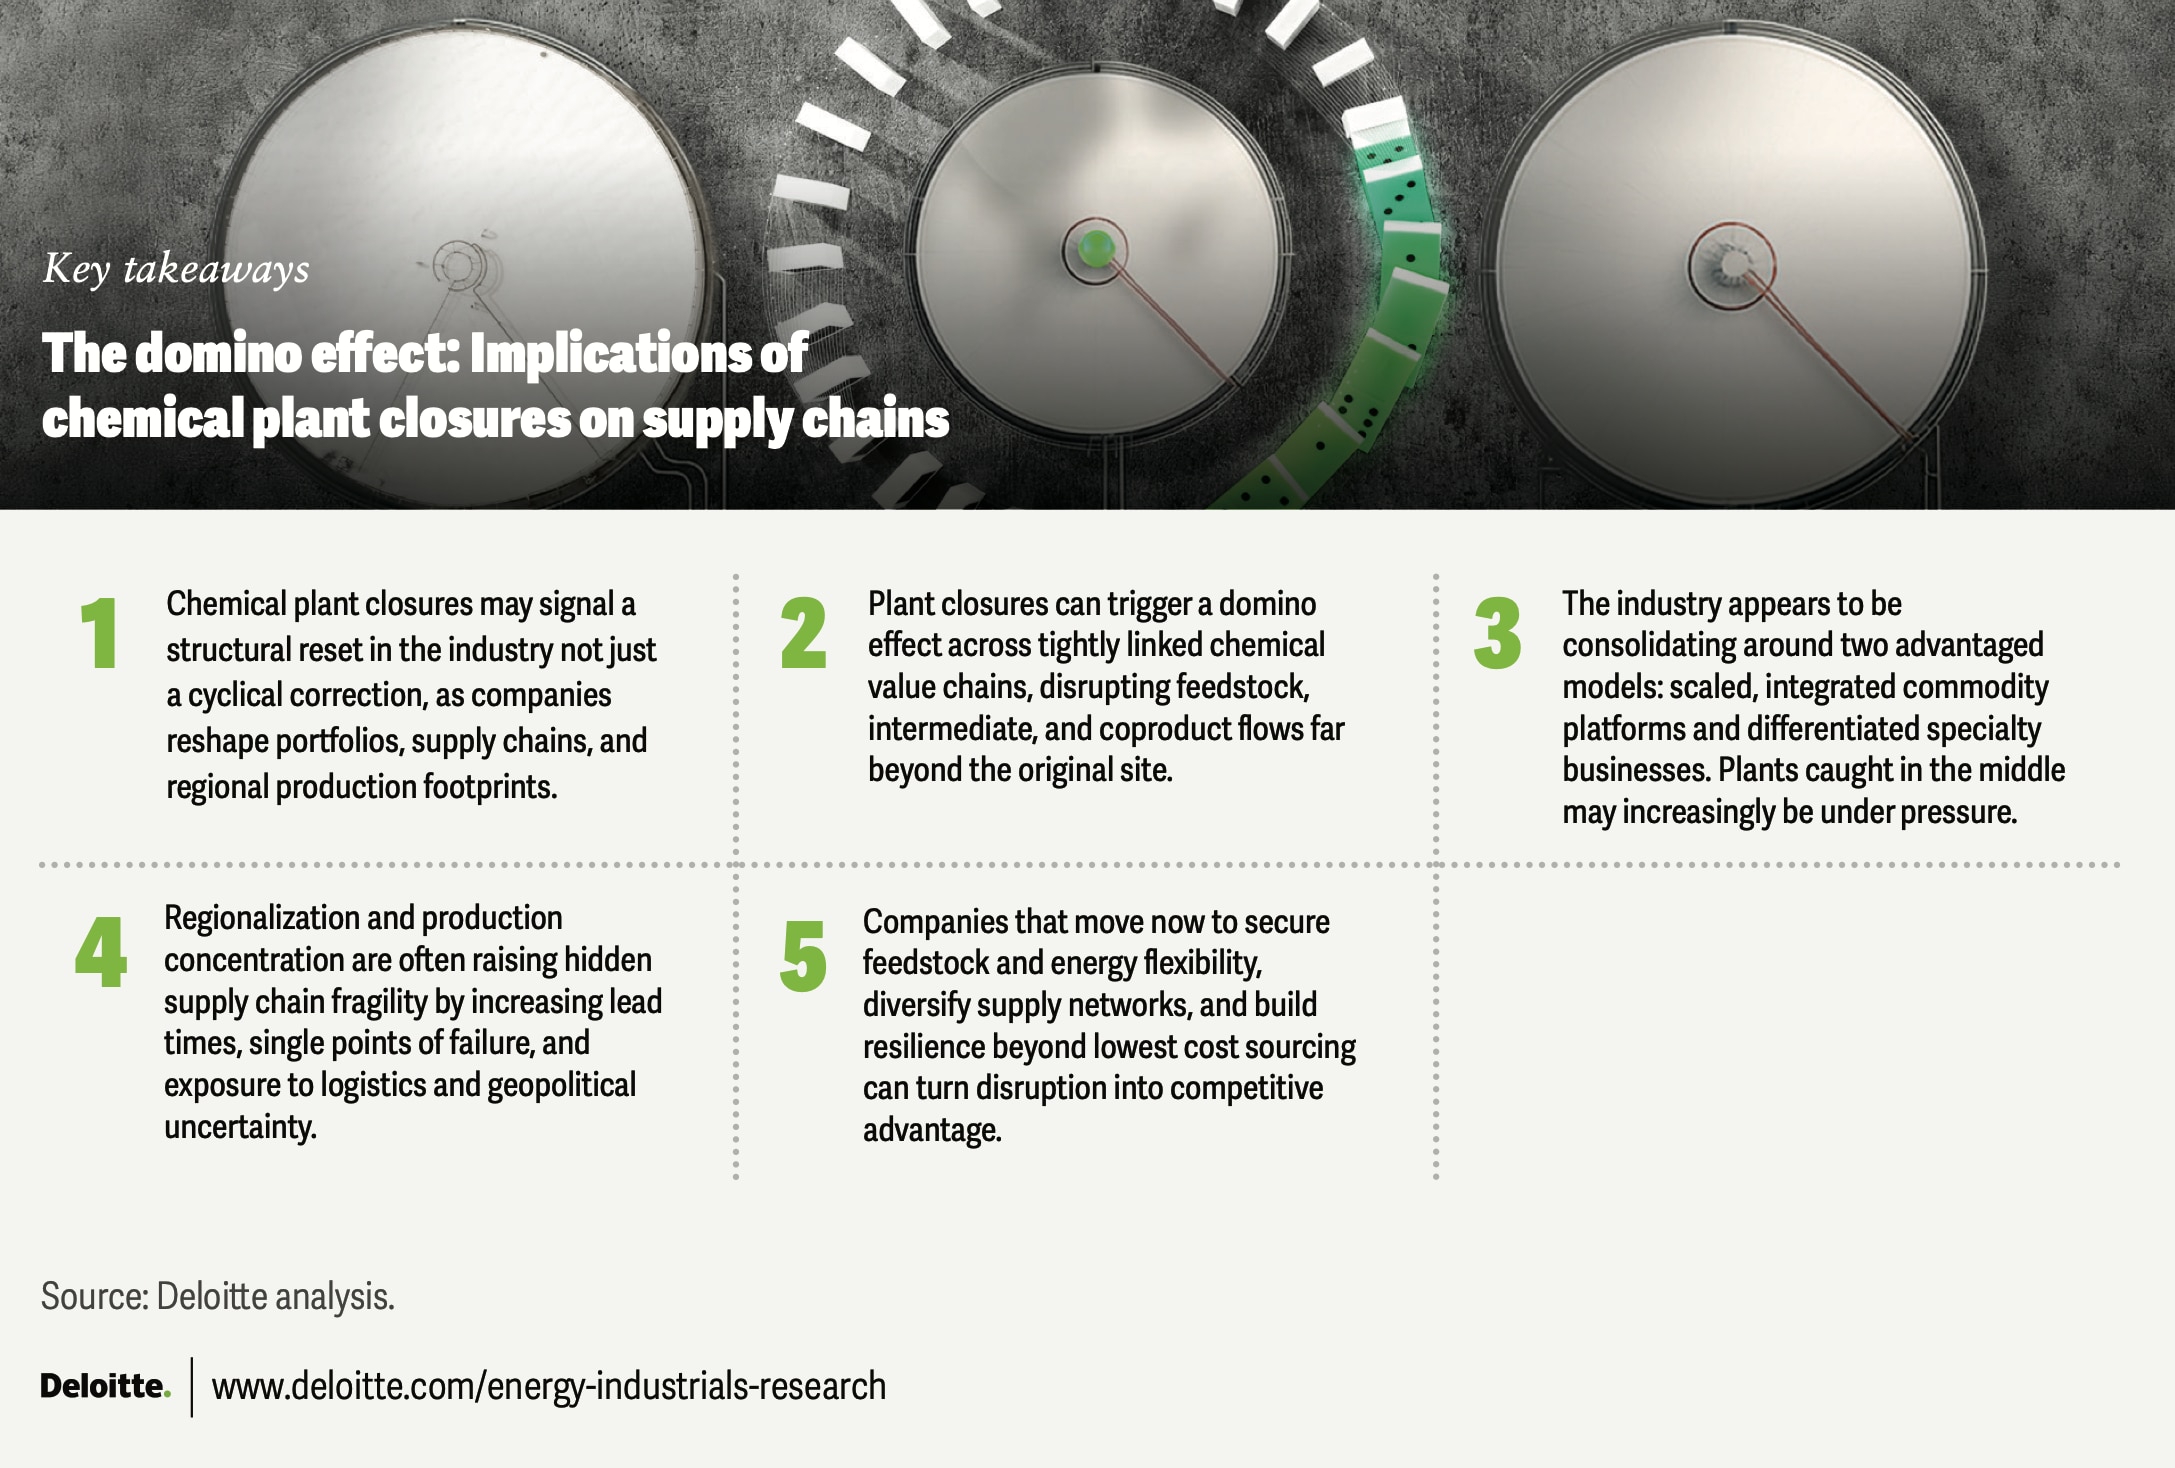
This creates a challenge for industry leaders: how to restore financial health while making deliberate choices about plant locations and maintaining the supply chain security that customers increasingly value. And the urgency is growing. Closures continue across Europe, carbon policies in the European Union continue to evolve, South Korea and Japan are pushing petrochemical restructuring, Chinese companies continue to add capacity, and some capacity in the United States has been rationalized despite the region’s feedstock advantage.4
Companies that reposition now can become more resilient and put themselves ahead of the competition; those that wait could risk higher costs, greater disruption, and strategic disadvantage.5
An industry under pressure
The past five years subjected the chemical industry to a perfect storm: Demand softened just as new capacity came online.6 In the Middle East, petrochemical production expanded by utilizing cheap feedstocks.7 In China, integrated refinery-chemical mega-complexes were commissioned.8 In the United States, world-scale ethane crackers leveraging shale gas economics were built.9 And capacity continues to be added, with more than 8 million tons of polyethylene capacity expected to come online in 2026 from projects being built in China and the United States.10
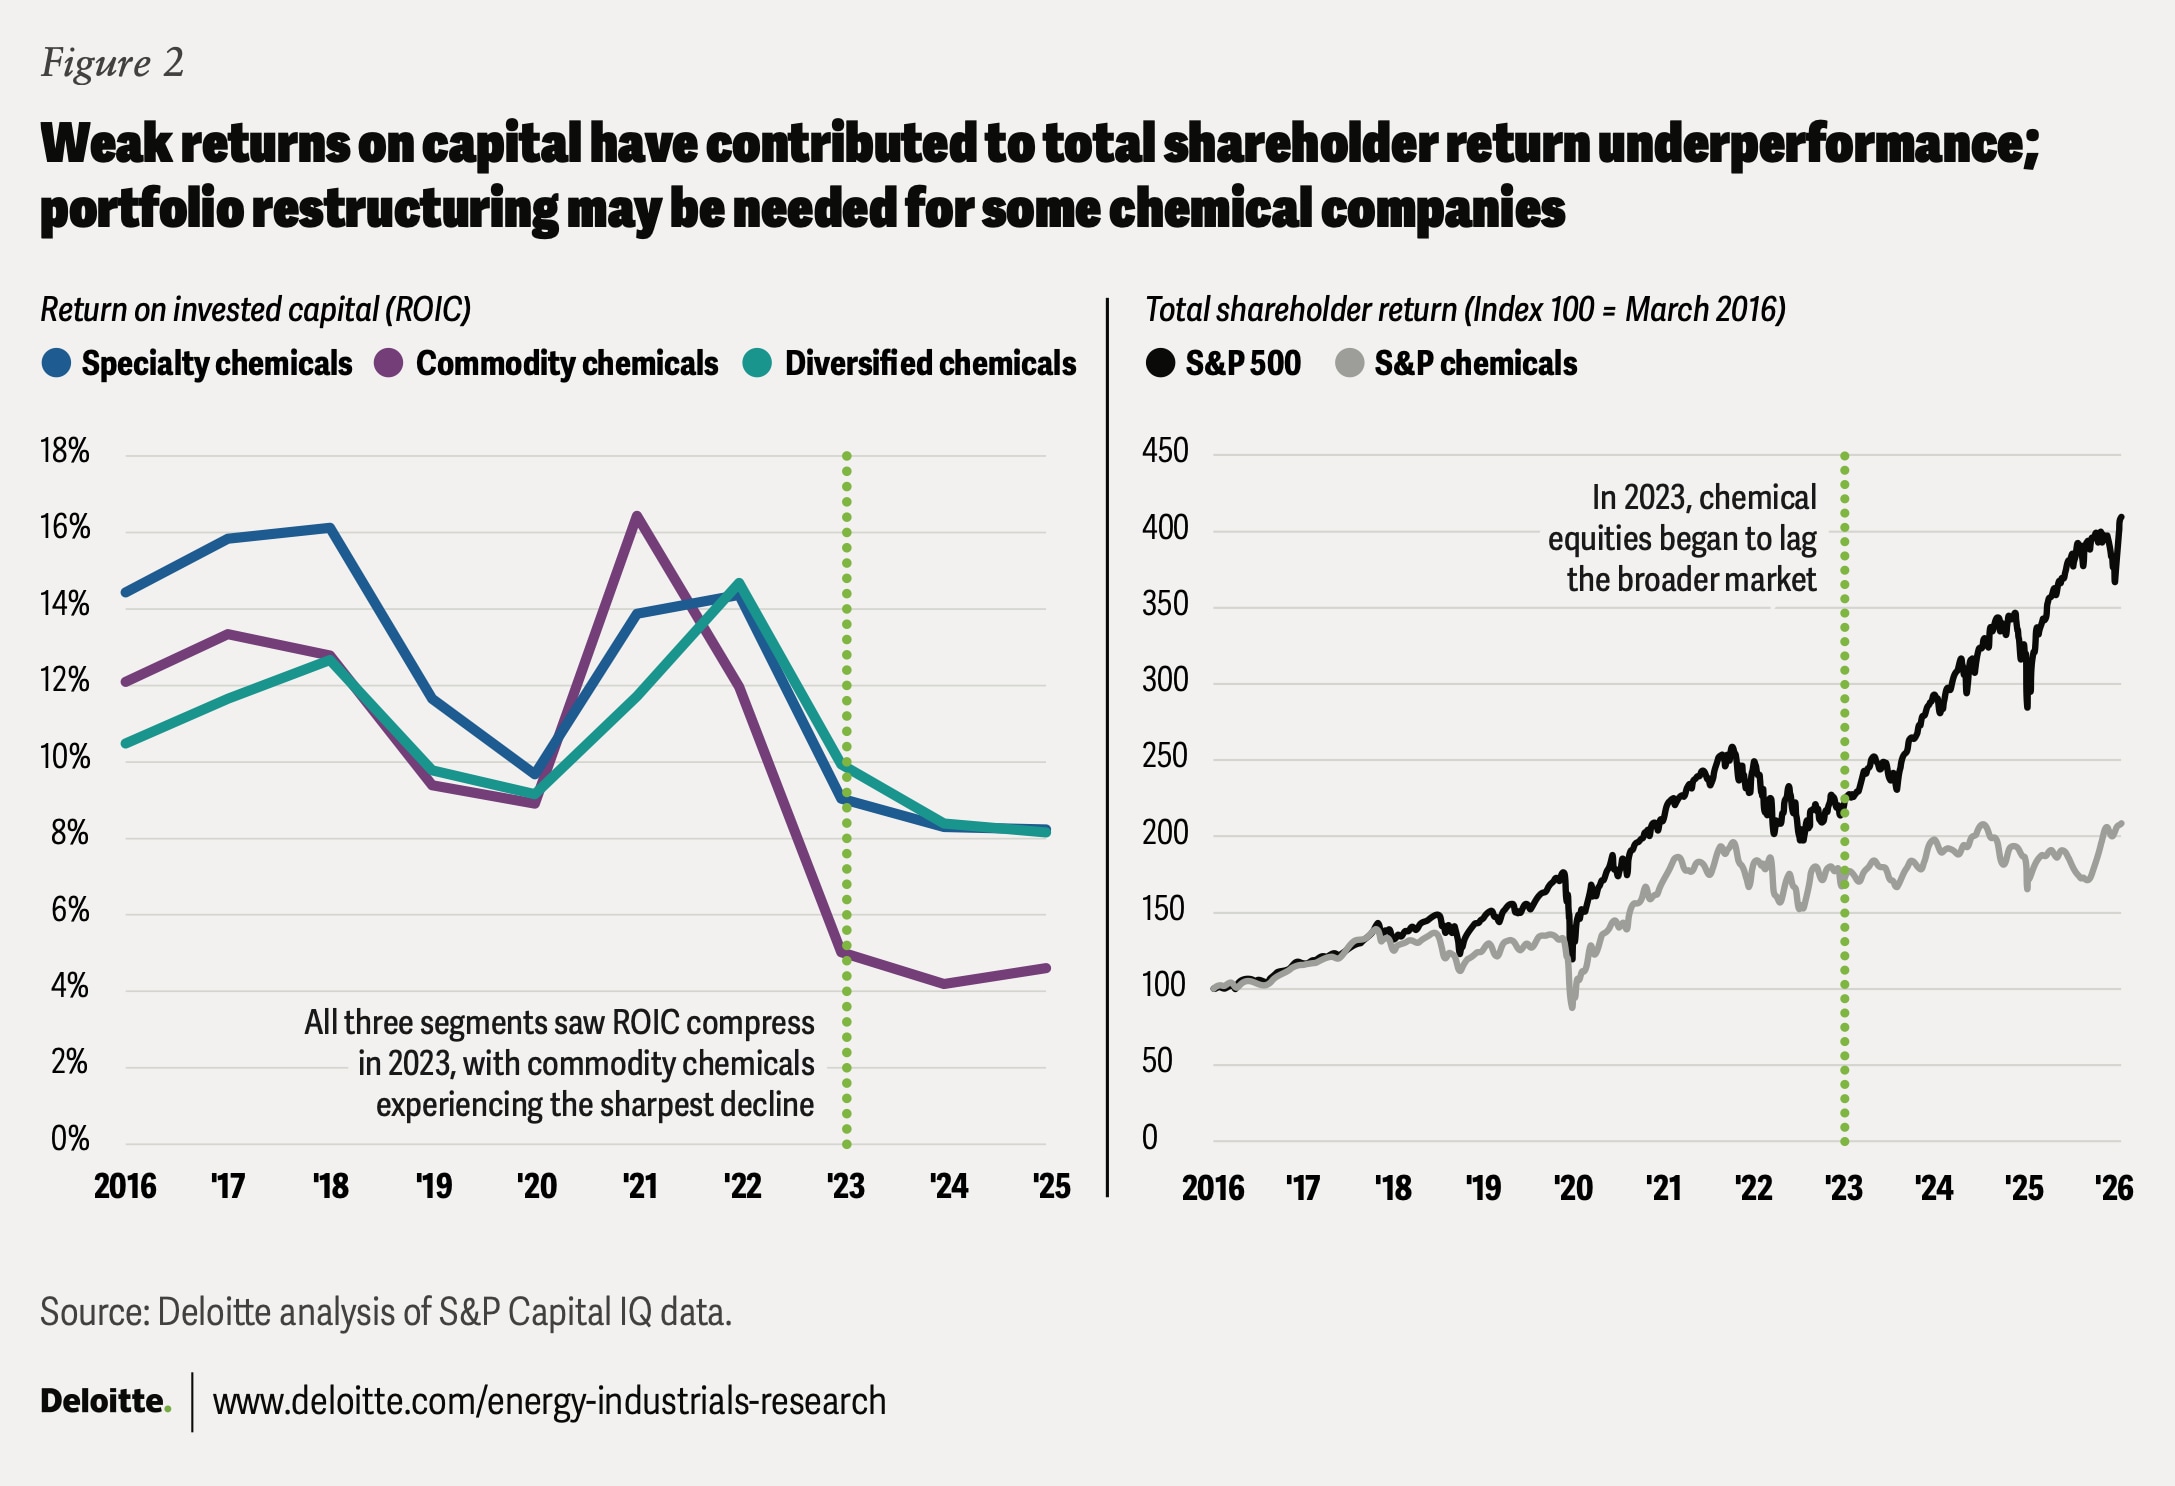
The result? Structural overcapacity that has pressure-tested links in the value chain. Margins and return on invested capital have fallen across large segments of the industry (figure 2). Total shareholder returns have underperformed the S&P 500 since 2023, further pressuring chemical companies to take action. Some of the industry’s largest companies have announced restructuring programs, asset write-downs, and capacity reductions.11
Patterns appearing in plant closures
Deloitte’s analysis of publicly announced closures and mothballings reveals several clear patterns. Many involve older, subscale assets that have challenges competing with modern, large-scale integrated facilities. They are typically located in regions with high energy and feedstock costs or operate in markets with persistent oversupply.
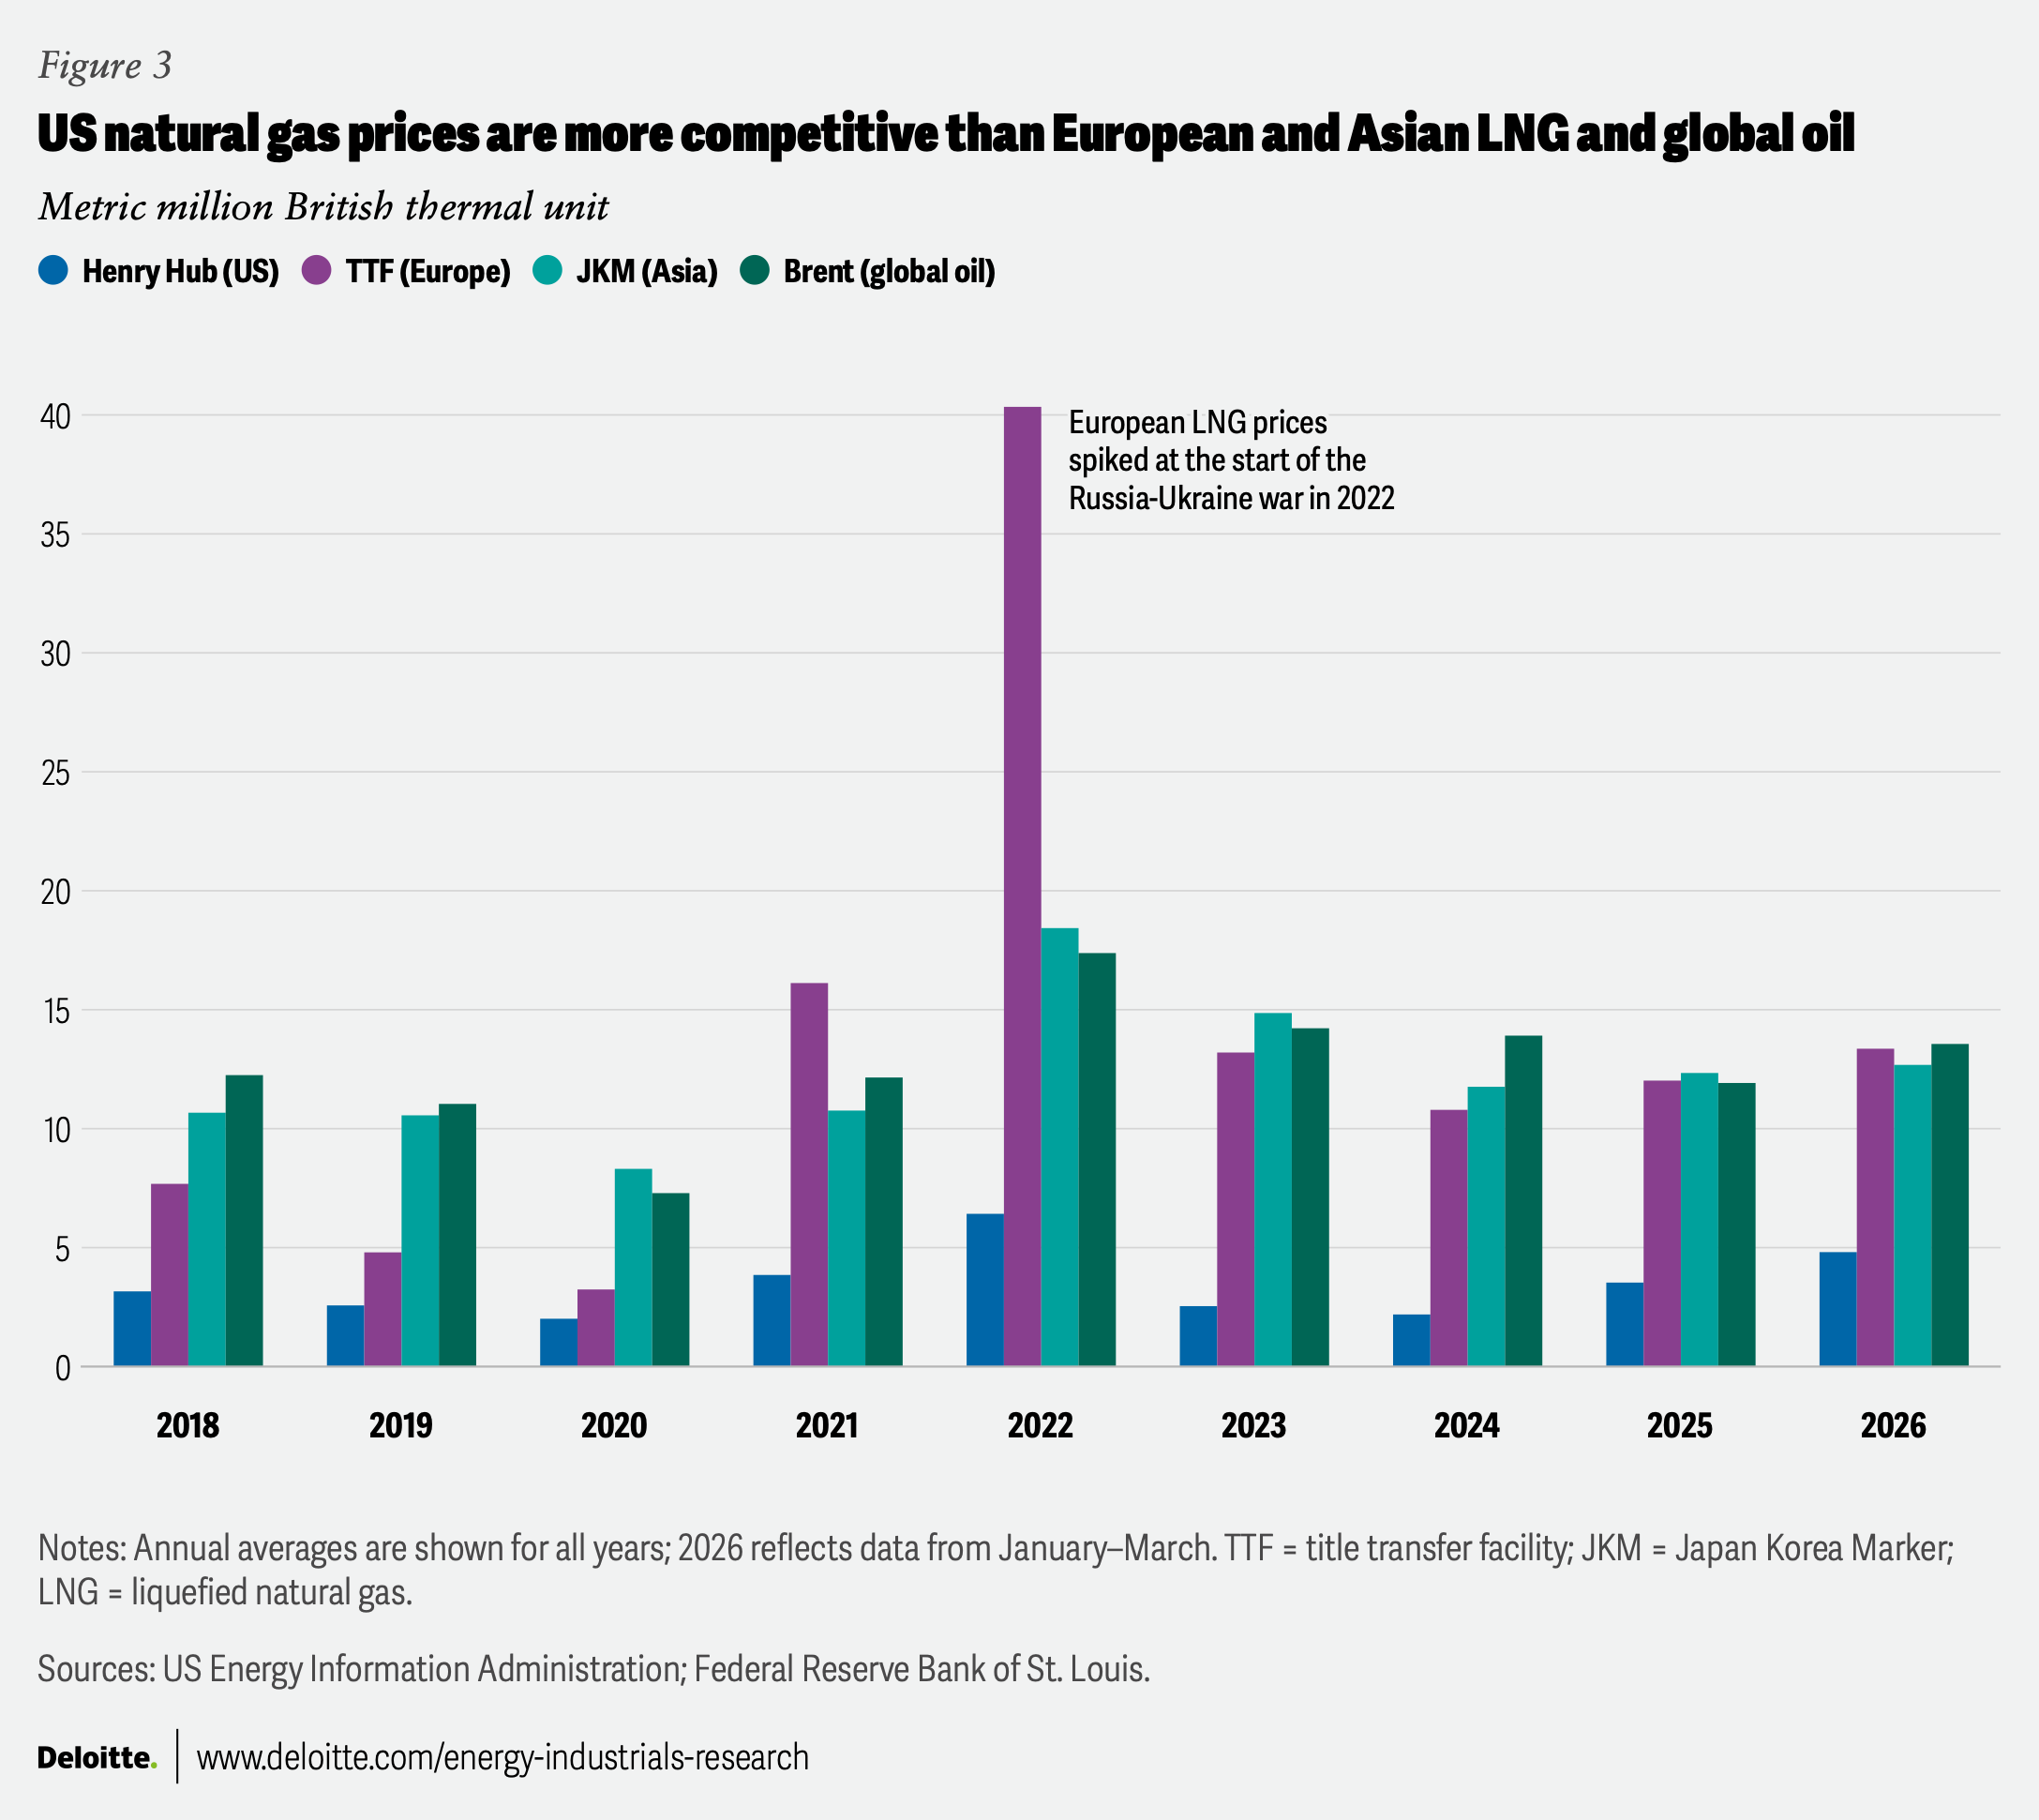
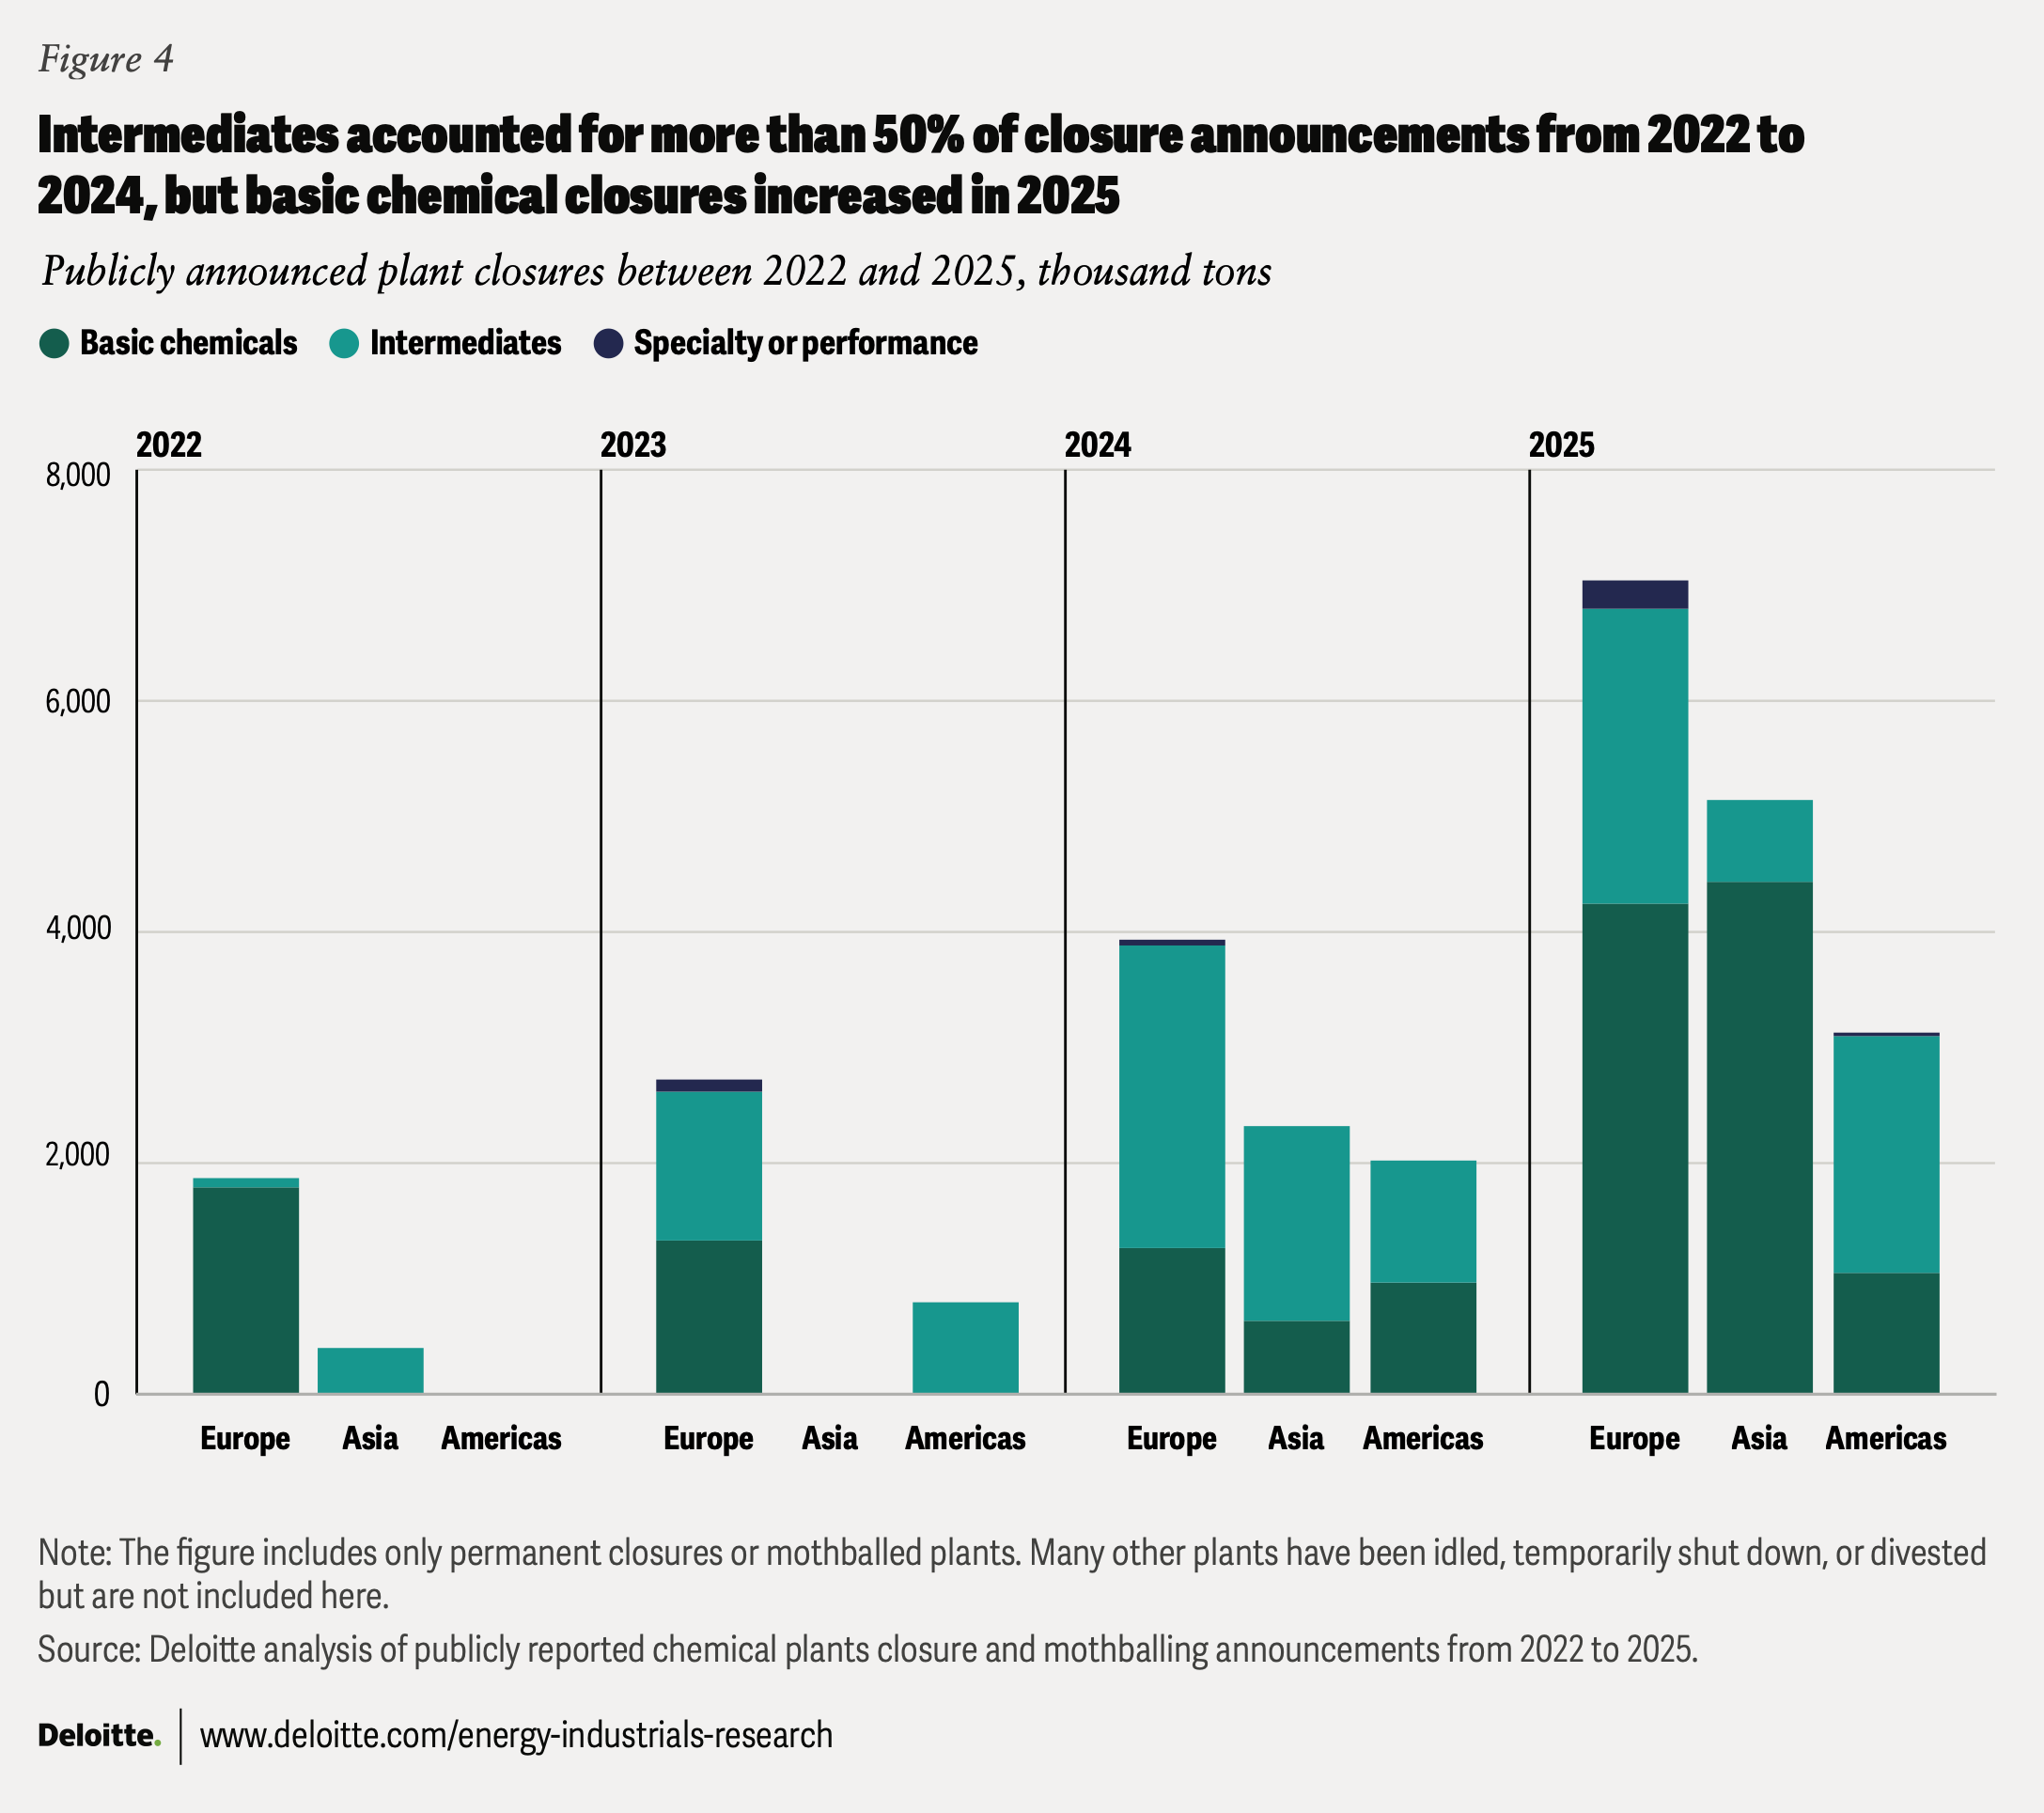
Between 2022 and 2025, over half of companies’ announcements cited high energy or feedstock costs as the primary driver, and more than 80% of those closures were in Europe.12 This reflects Europe’s surge in natural gas prices in 2022 following the onset of the Russia-Ukraine war (figure 3) and the resulting pressure on regional competitiveness.13
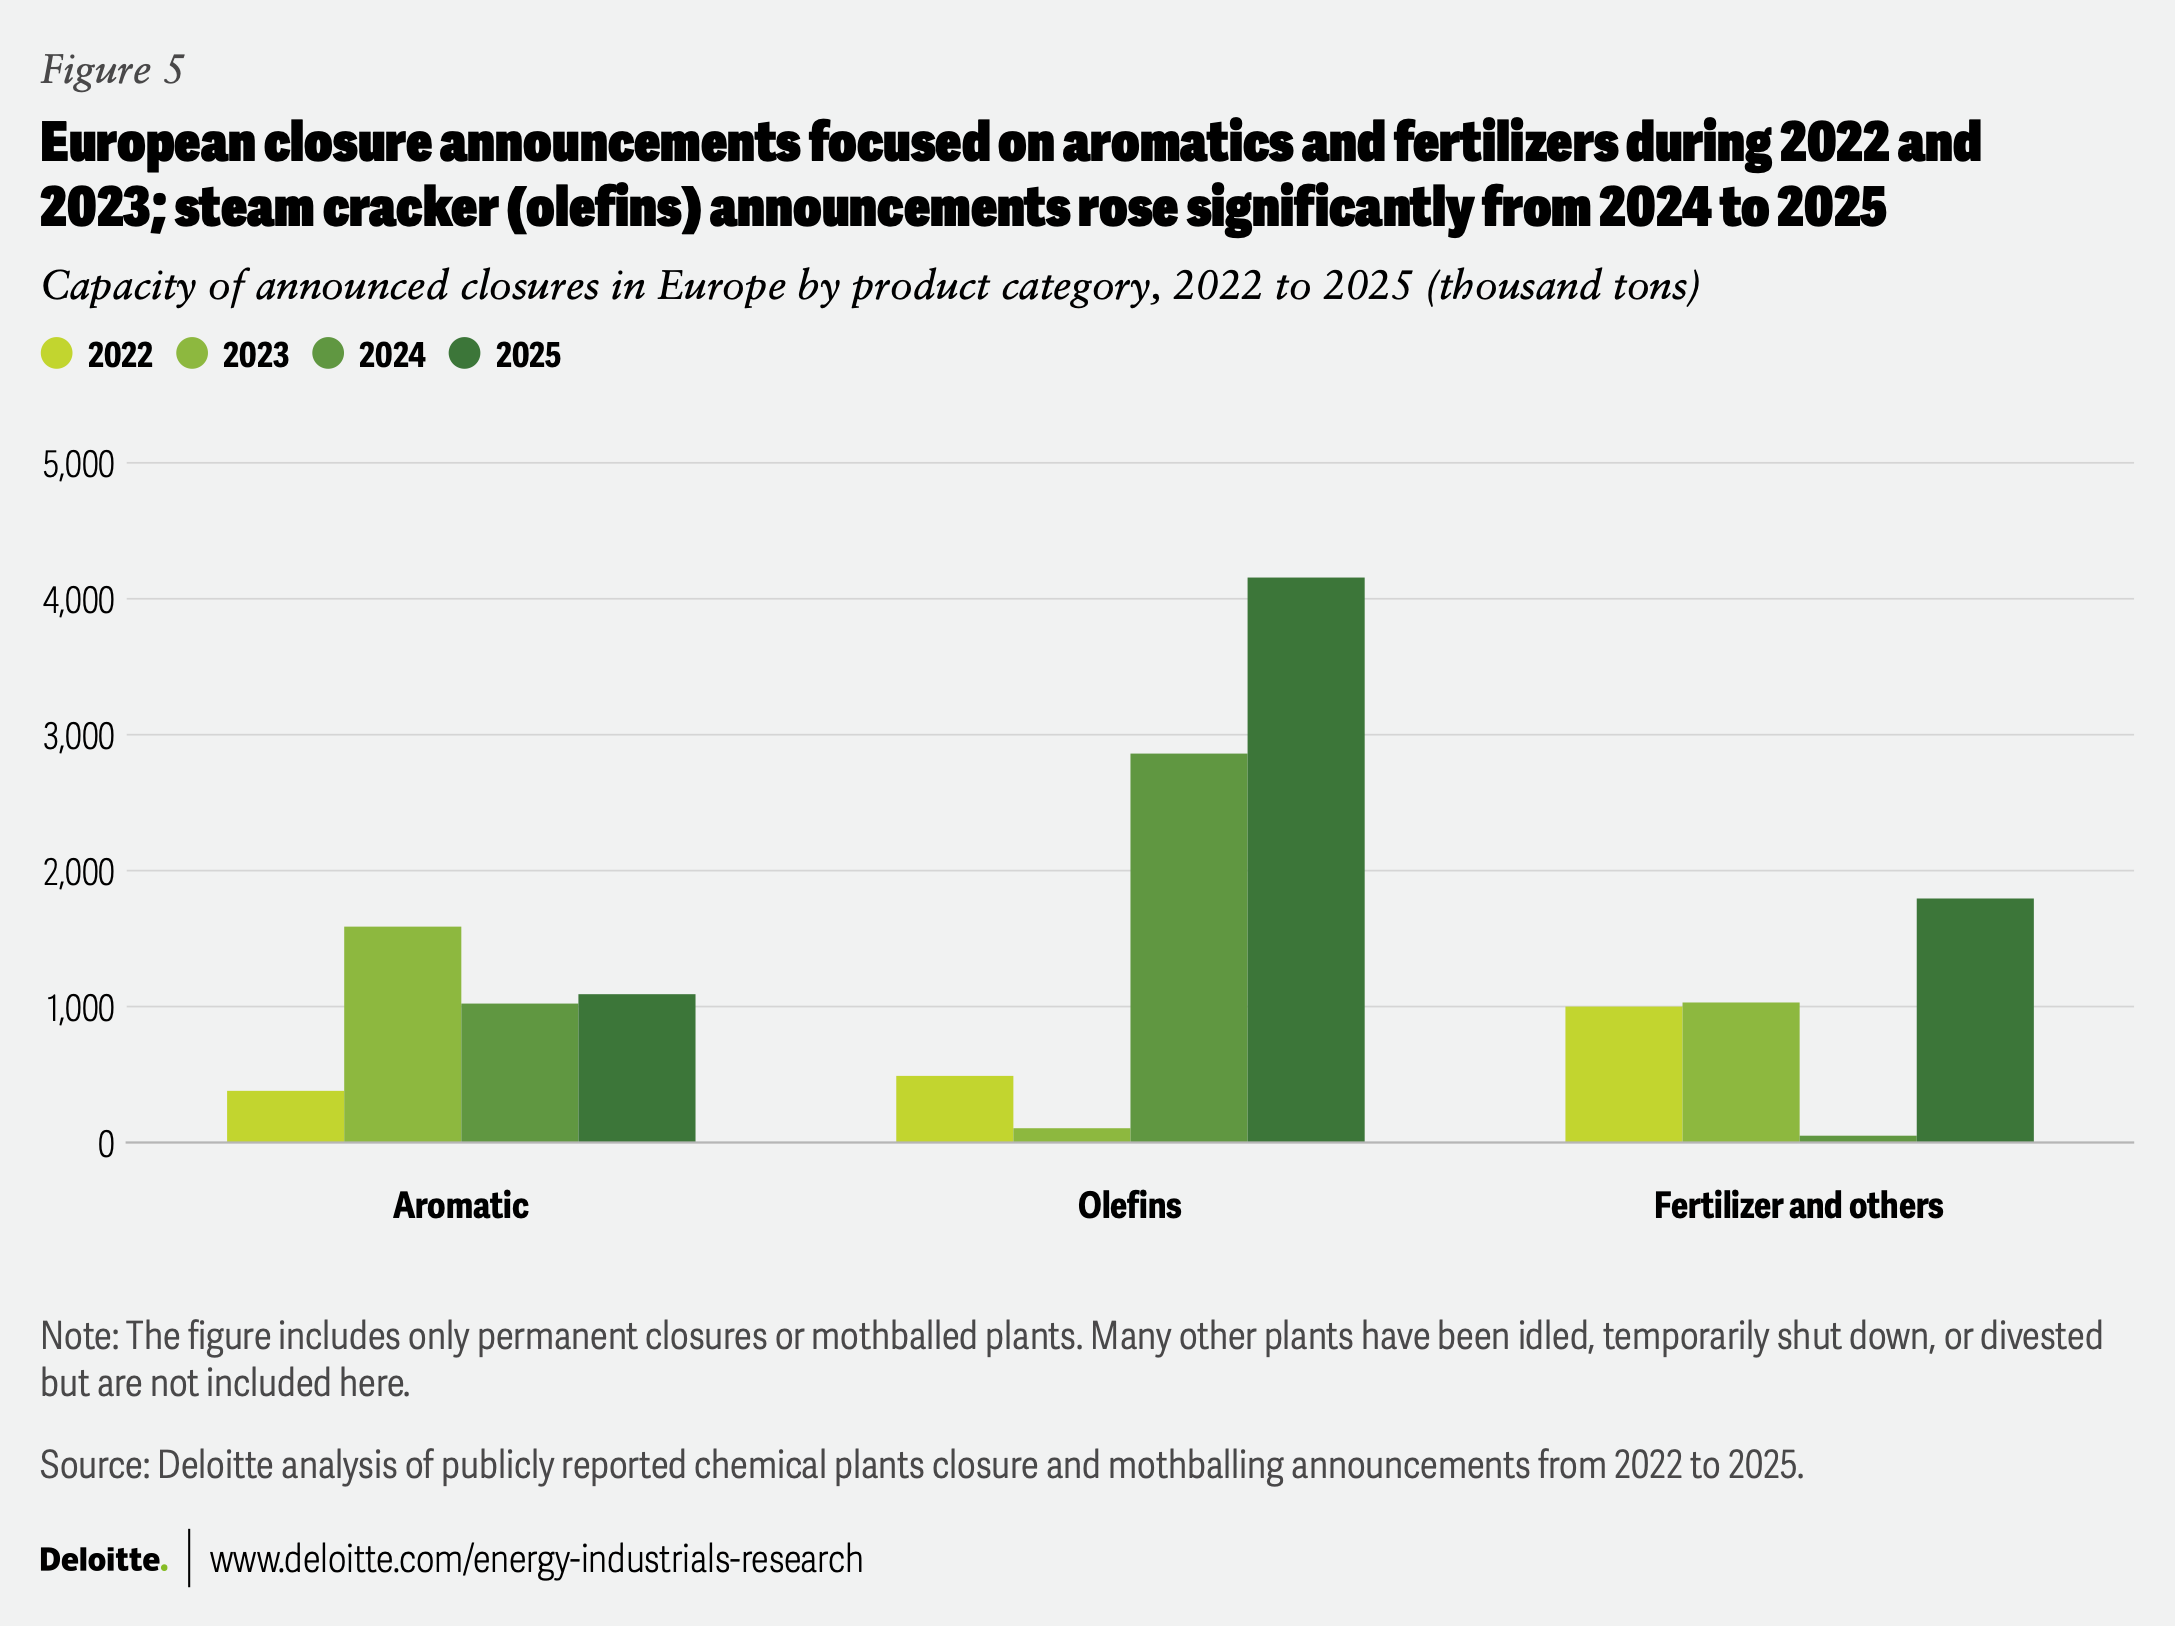
More revealing, however, may be how the dominos have fallen. Rather than starting upstream with steam crackers and cascading downstream, the first wave of closures hit intermediate plants in the aromatics value chain: styrene, cumene, and phenol. Only later did closures move upstream to crackers.14
This inversion reveals where the system is vulnerable: not upstream near the feedstock level, but in intermediates exposed to global competition. In a high-cost region, these assets become uneconomic first because they can be displaced by lower-cost production elsewhere (figures 4 and 5).15
How the dominos fell:
- 2022 to 2023: Within Deloitte’s database of publicly announced closures, nearly three-quarters of global closure announcements were for European plants in the aromatics or fertilizer value chains.16 These plants were more vulnerable due to rising input costs, weak demand for many aromatics, and the fact that aromatics and fertilizers are generally easier to import than olefin derivatives.17
- 2024: Closures remained concentrated in organic chemicals, but they were more evenly distributed across olefin and aromatics value chains as companies restructured broader portions of their portfolios. Europe still accounted for most closures (nearly 50%), with increased activity across parts of Asia Pacific (specifically Japan and South Korea) and in the Americas.18
- 2025: Total global closure announcements nearly doubled in 2025 as companies acted on portfolio reviews initiated during the margin compression of 2023. Half of the closures were steam crackers, split roughly evenly between Asia Pacific and Europe.19
A new industry structure is emerging
Executives are right to consider second-order effects: As upstream and intermediate capacity closes, producers downstream can lose local supply, face longer logistics chains, and absorb greater input volatility. Chemical plant closure announcements have continued into early 2026, reflecting ongoing structural pressure across the industry.20 And while geopolitical uncertainty may delay near-term decisions, the direction seems clear.
First, consolidation does not appear to be finished. Rationalization of intermediate assets and broader restructuring of organic chemical value chains will likely continue until demand recovers or excess capacity is absorbed.21
Second, some portfolio actions are expanding beyond closures. Some companies are accelerating product pruning, asset repurposing, joint ventures, and selective backward integration to regain cost and supply control.22
Third, not all specialties are insulated. “Near-commodity” specialties face the same structural pressures as base chemicals, while truly differentiated and performance chemicals remain more resilient due to pricing power and customer lock-in.23
Fourth, the value chain is regionalizing. In the late 20th century, the chemical industry increasingly moved toward global integration, with companies expanding across continents and becoming more reliant on international trade. Over the past two to three years, that 50-year trend toward globalization has started to reverse. The United States and the Middle East are consolidating their upstream and midstream advantage; Europe is shifting toward higher-value downstream segments; and China is investing across the full value chain to compete on both cost and integration.24
Taken together, these forces point to a hollowing out of the middle. The industry is diverging around two models:
- Mega-scale, integrated commodity complexes that compete on cost and integration, leveraging advantaged feedstocks and world-scale assets
- Differentiated specialty platforms that compete on performance, formulation, and customer intimacy, where margins are protected by innovation and switching costs
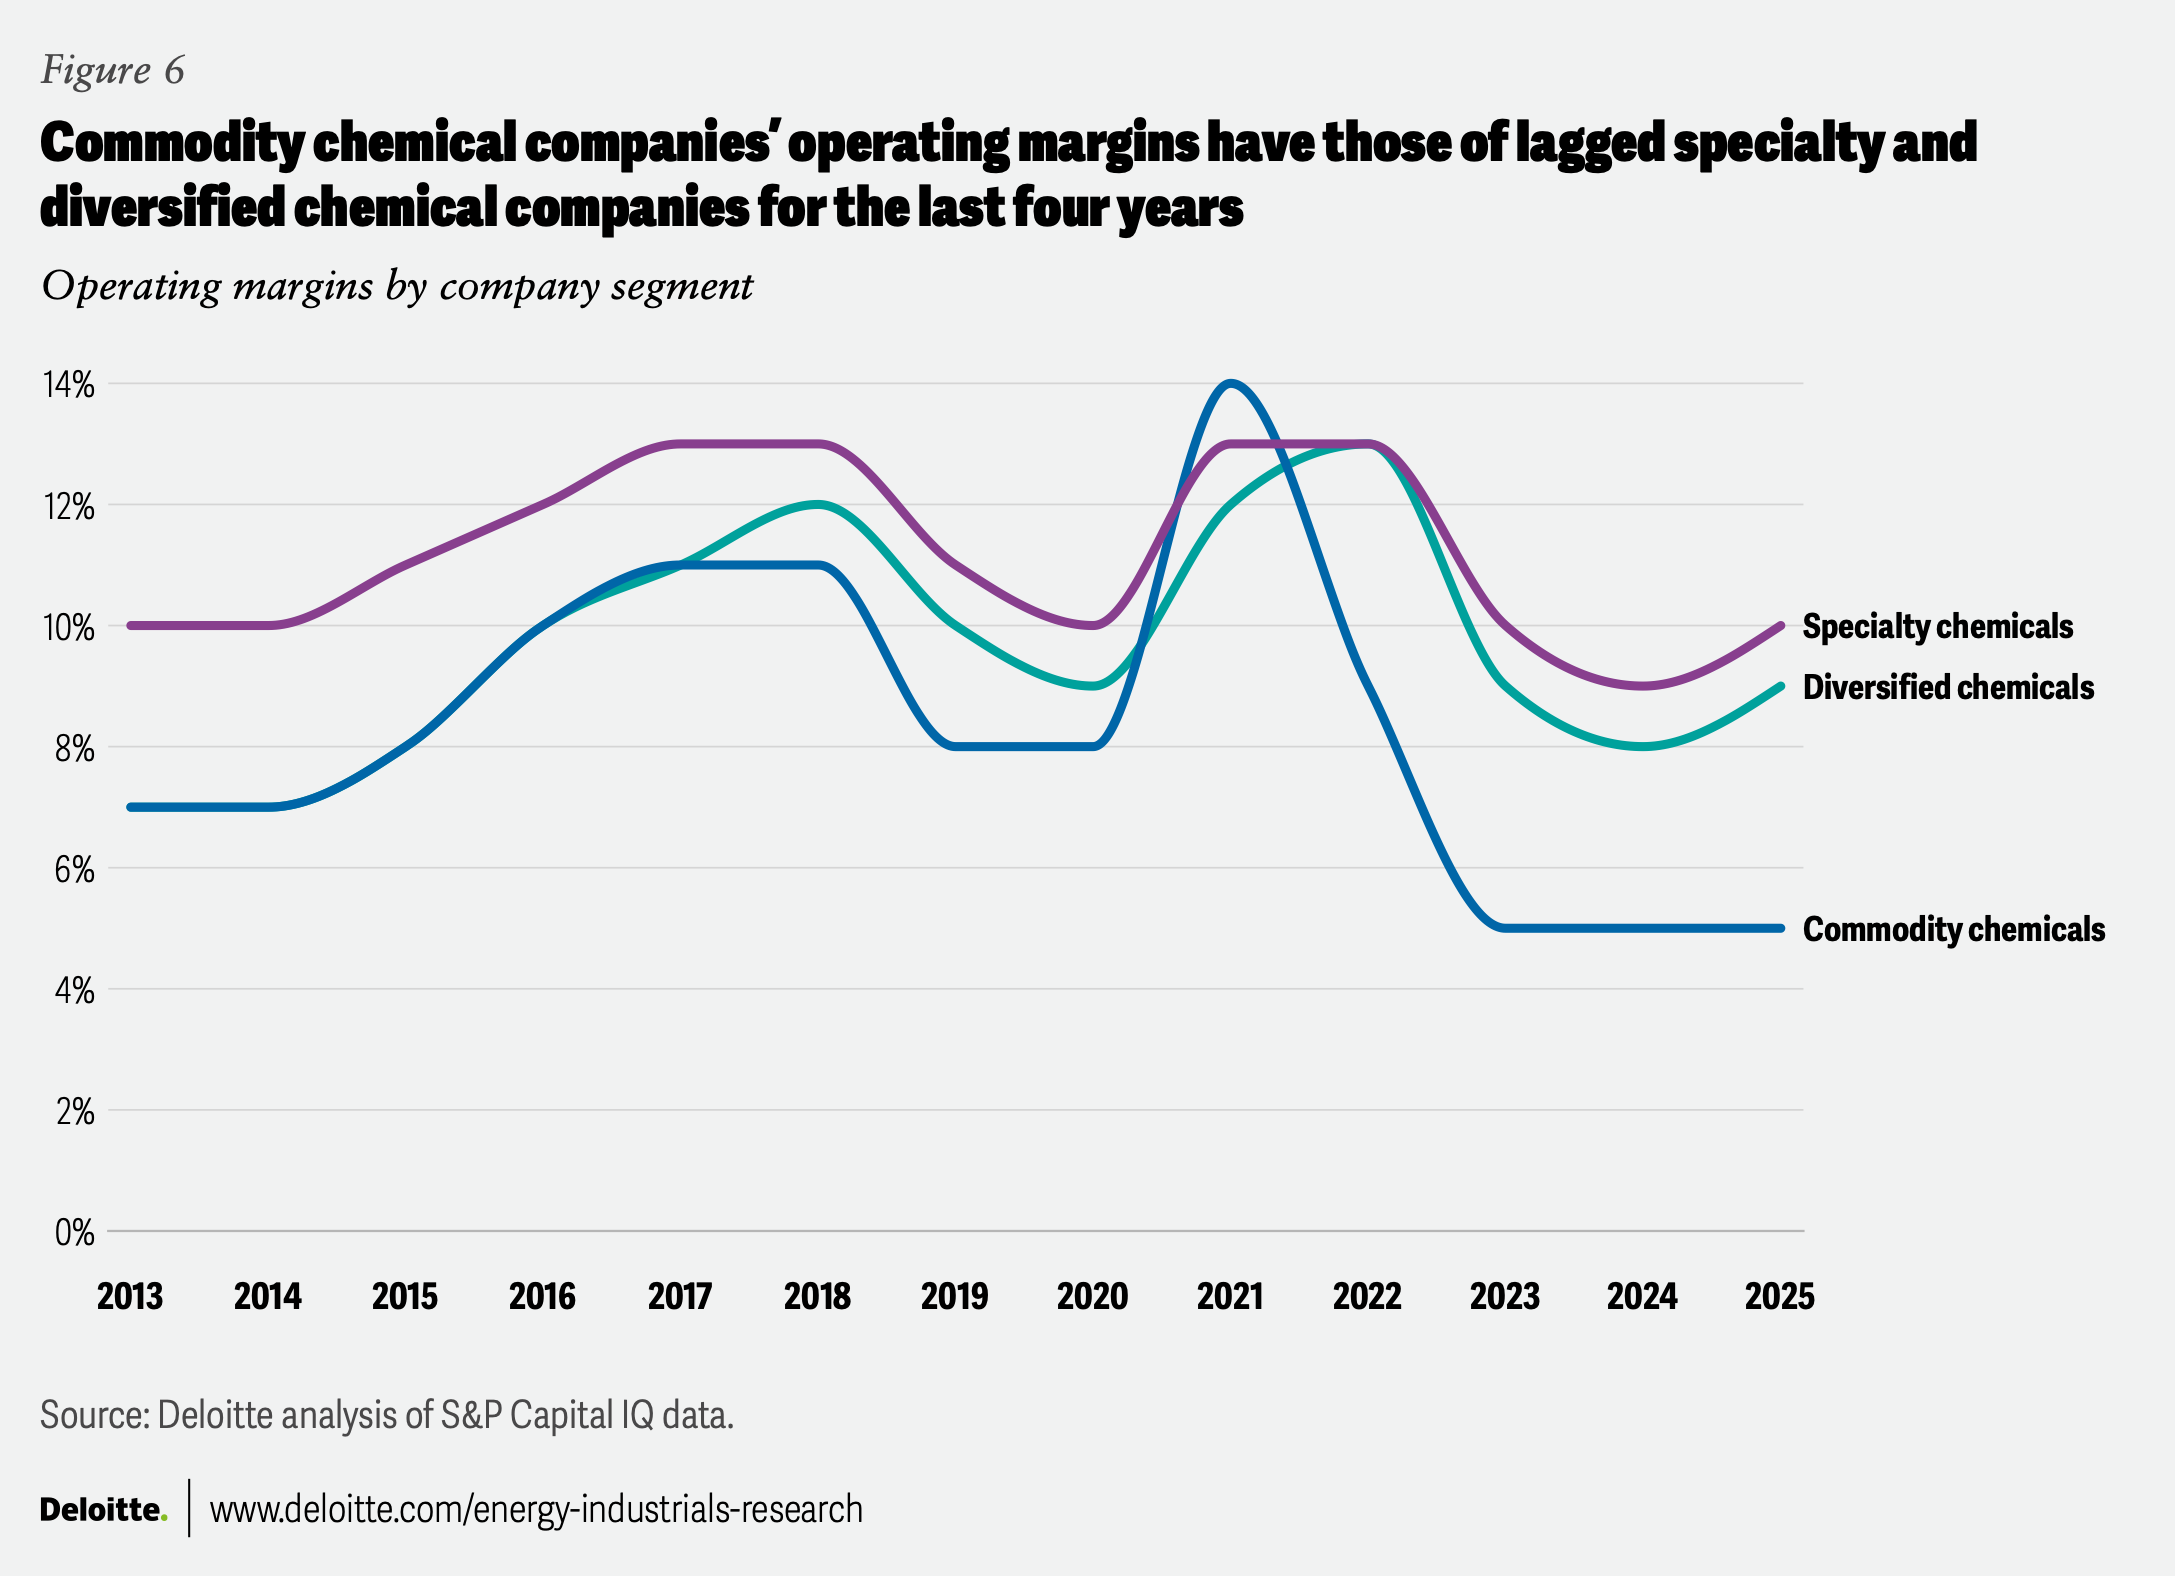
Exposed players sit between these poles: mid-scale commodity producers without feedstock advantage and specialty producers without true differentiation. This structural squeeze helps explain the widening margin gap between commodity and specialty chemical companies (figure 6).25
The supply chain domino effect
Chemical supply chains have been repeatedly stress-tested over the past five years—from pandemic-related disruptions to geopolitical shocks and diverging trade and carbon policies. But the current restructuring is introducing a different risk: hidden fragility that could emerge in the next disruption.26
Supply chains are being reshaped. Some are shortening as production moves closer to end markets through nearshoring and regionalization. Others are lengthening as production concentrates in a few advantaged regions, forcing materials to travel farther to reach demand centers. A manufacturer that once sourced intermediates locally may now rely on imports, adding weeks to lead times and significantly increasing supply risk, transportation costs, and carbon intensity.27
Geographic concentration is increasing vulnerability. As fewer plants produce a given material, each one becomes a potential single point of failure, heightening exposure to logistics disruptions and geopolitical shocks.28
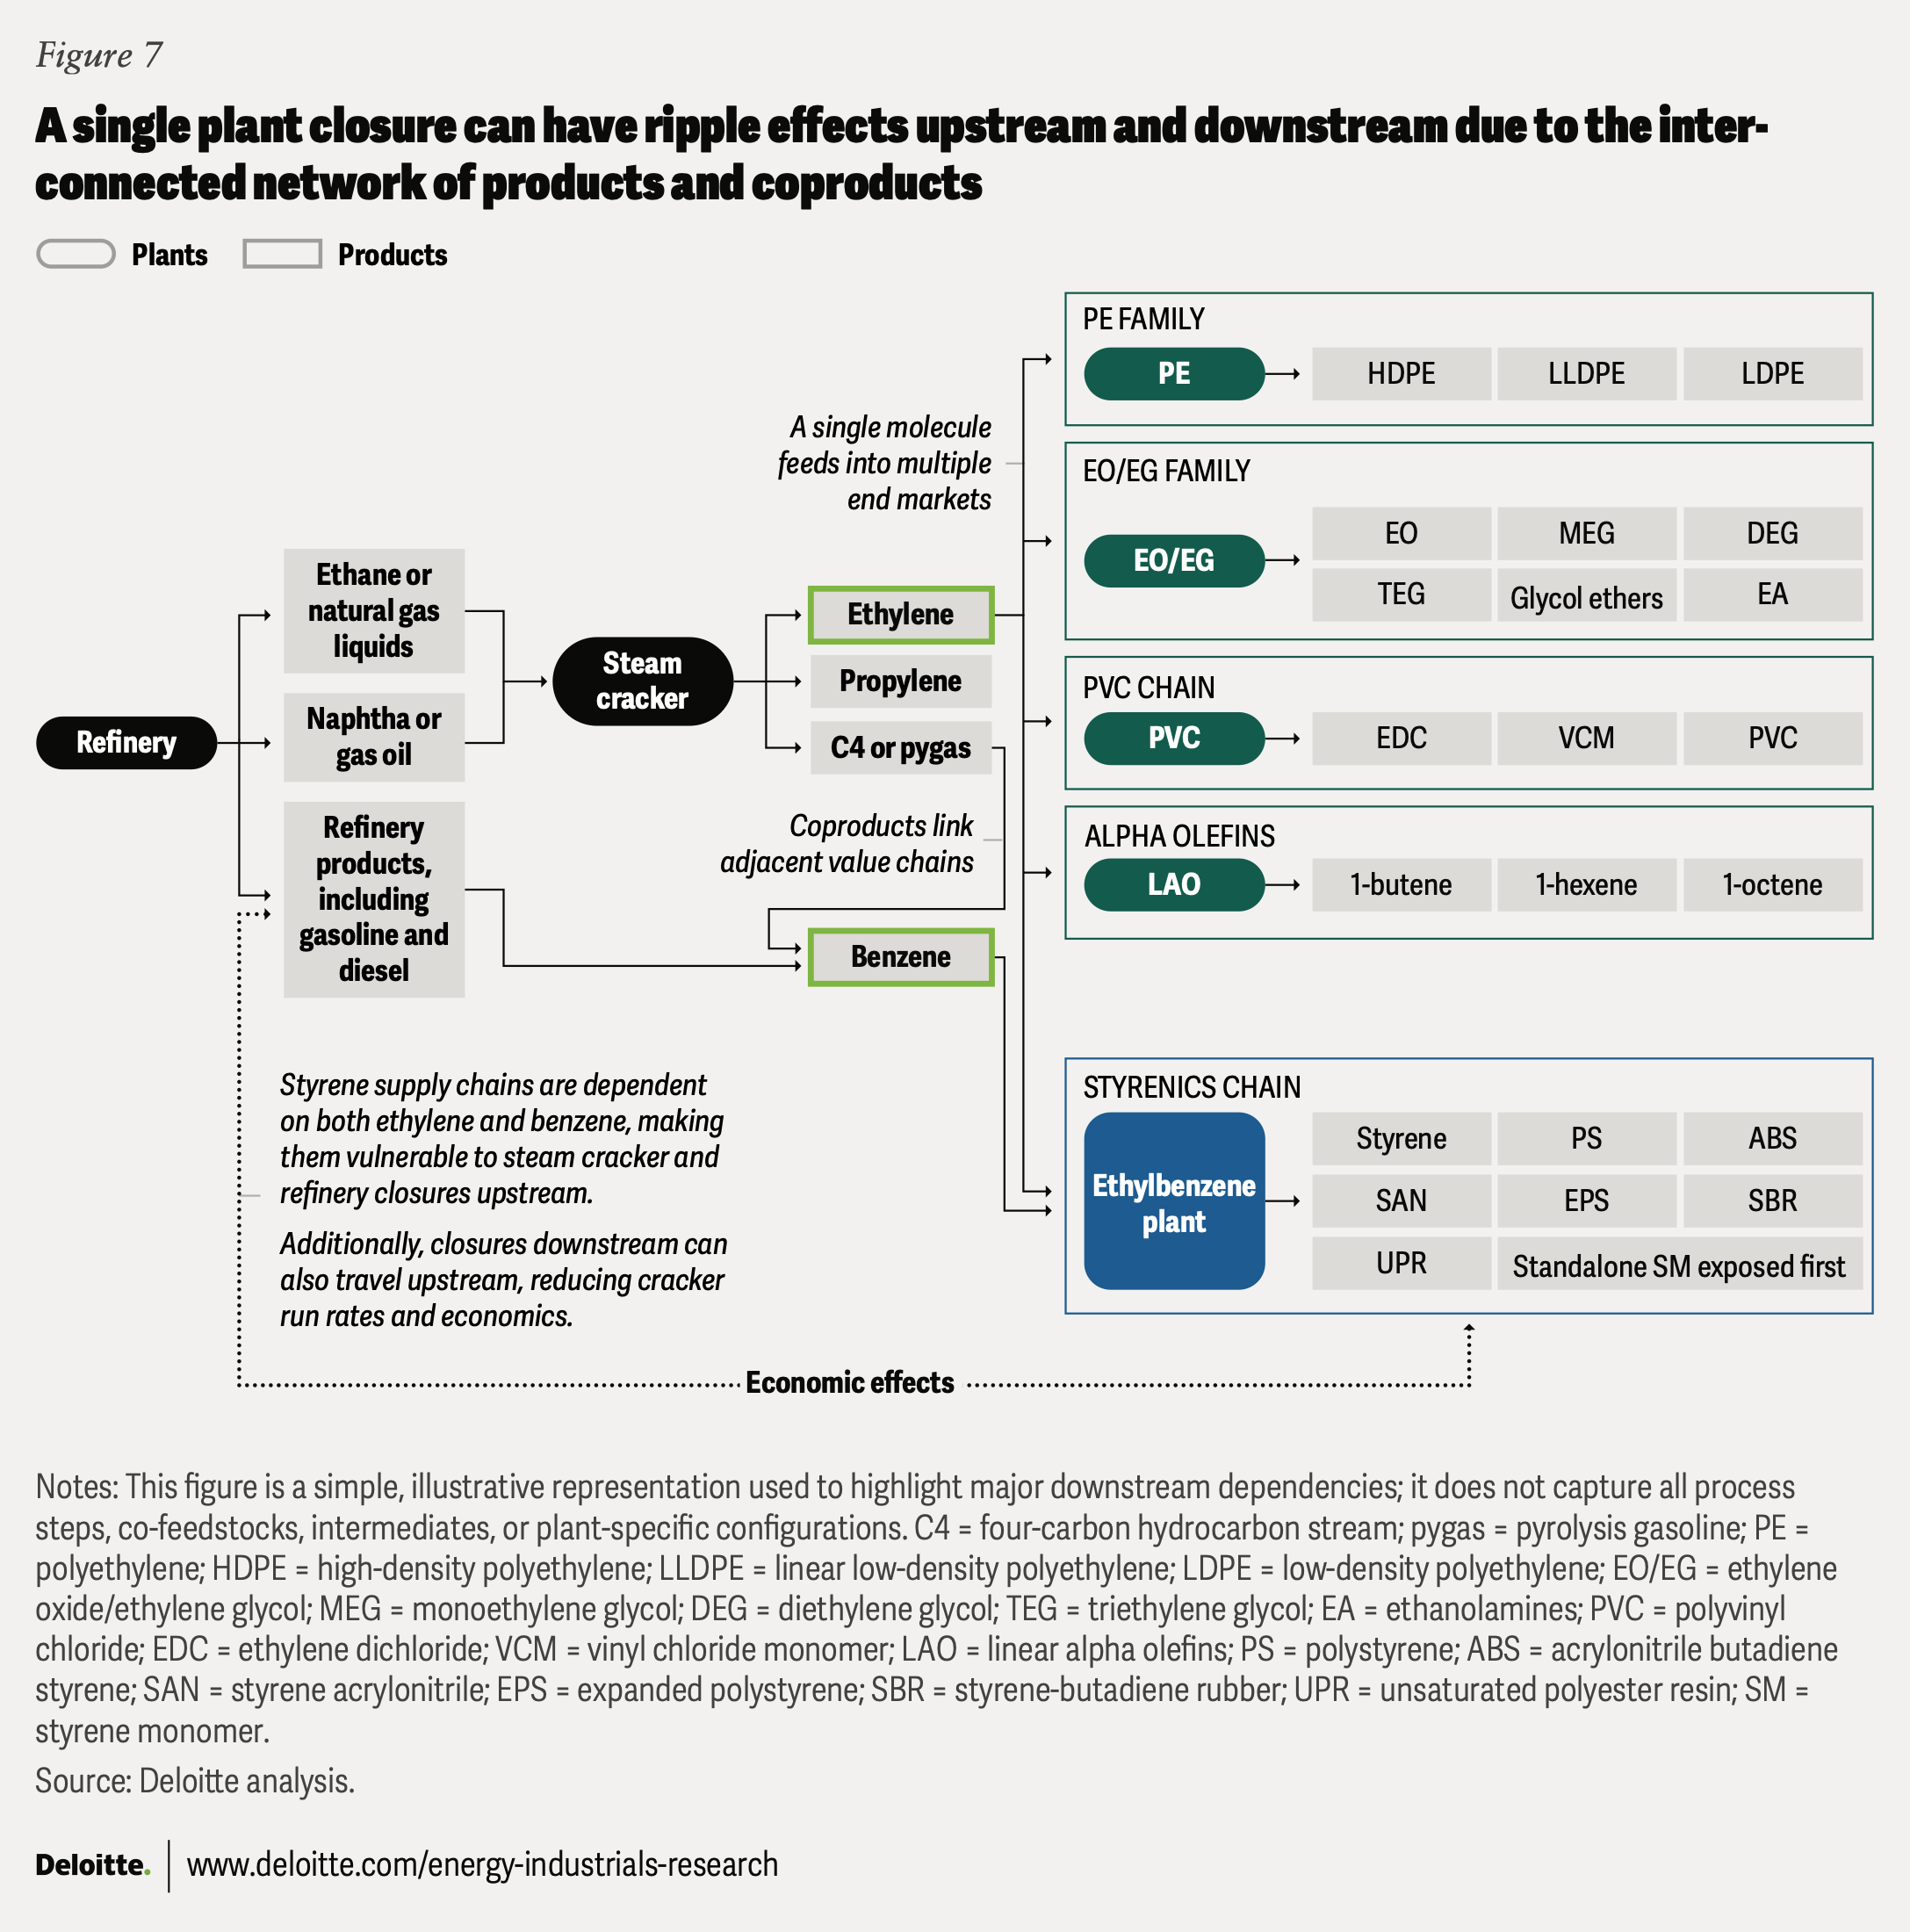
In Europe, industrial ecosystems are disappearing. Integrated chemical complexes rely on tightly connected material flows, where one plant’s byproduct becomes another plant’s feedstock. When a unit shuts down, these links can break, triggering cascading effects across the site and the wider value chain.
For example, closing a steam cracker can reduce ethylene supply and tighten availability for downstream products such as styrene (figure 7). Conversely, if a styrene plant closes, local demand for benzene from the nearby refinery could drop sharply. The refinery would then need an alternative outlet for benzene or face storage constraints. Over time, lower transport volumes could also leave pipeline infrastructure underutilized and at risk of becoming stranded. Similar knock-on effects can occur across other value chains.
A fundamental paradox is that industry rationalization—necessary for financial health—can undermine the supply security that customers increasingly value. This tension can force strategic choices that chemical companies should consider.
Resilience strategies for the new chemical landscape
Volatility and uncertainty may not be temporary conditions; they could be the new baseline. Companies that thrive in this environment will likely balance resilience with cost efficiency while positioning for long-term strategic considerations.
Different strategies work for different positions in the value chain. Consider the following five approaches:
1. Securing feedstock and energy advantage
Feedstock and energy costs remain powerful drivers of competitiveness in chemicals.
While a company may not be able to easily control the prices of feedstock, it can build in feedstock flexibility—the ability to run on multiple raw materials, which can provide insulation from supply disruptions and price spikes. Crackers designed to handle ethane, propane, naphtha, or even alternative feedstocks such as bio-naphtha can optimize feedstock selection as prices shift.29 Some companies are also exploring circular or bio-based feedstocks, with shorter, more localized supply chains.
Energy security should include multiple approaches: aggressive energy efficiency programs to help reduce consumption, long-term contracts from a diverse set of suppliers for liquefied natural gas or hydrogen to lock in favorable pricing, investment in renewable energy where economics allow, onsite power generation to reduce grid dependence, and diversification across multiple energy sources to minimize exposure to any single fuel.30
2. Building diversified supply networks
The “single-source, lowest-cost” procurement approach has been challenged by recent disruptions. Leading companies now practice disciplined dual sourcing for critical feedstock and actively qualify multiple suppliers. But true supply chain resilience should include visibility beyond tier 1 suppliers. Today, it’s important to understand where a company’s critical raw materials originate and which production assets their supply chain ultimately depends upon. Increasingly, customers downstream are often expecting more transparency and resiliency from their upstream suppliers.
3. Rethinking geographic location strategies
Geography increasingly contributes to competitive advantage. Some companies are evaluating where to locate new investments and which existing assets to prioritize.31 The calculus involves multiple factors: proximity to feedstock sources, distance to key markets, length and complexity of supply chains, regulatory environment, energy costs, and carbon exposure.
For some companies, gains from regionalization (building production capacity closer to end-use markets) seem appealing as supply chain resilience and carbon footprint become strategic priorities. Shorter supply chains can mean faster response to demand shifts, lower transportation costs, and reduced exposure to logistics disruptions.32
4. Business model transformation
One strategic question for chemical companies is how to reshape portfolios and operating models region by region: What is the long-term role of the business in each region? Some may pursue deeper vertical integration and scale through large industrial complexes in cost-advantaged regions. Others may embrace asset-light petrochemical models, practicing capital discipline through modular designs, partnership structures (joint ventures and shared assets), or brownfield optimization rather than greenfield construction. Others may focus on differentiated specialty materials closer to high-value end markets.33
5. Operational excellence and digitalization
Finally, operational excellence and digitalization can reinforce each other, improving responsiveness, transparency, and resilience in volatile markets. Together, they can give companies better real-time visibility into what is happening across the network, while also strengthening execution. With tools like advanced forecasting, digital twins of plants and networks, digital commerce, and artificial intelligence-enabled decision support, companies can improve asset reliability, make planning and scheduling more adaptive, and move from fixed plans to dynamic optimization.
In practical terms, this can allow firms to better balance just-in-time efficiency with just-in-case resilience. Instead of applying uniform inventory targets, they can use real-time data and predictive analytics to decide where inventory buffers are needed and how large those buffers should be, given specific risks in the system. At the end of 2025, chemical companies were holding an average of 94 days of inventory, more than 9% above the prior five-year average.34 While that level of inventory could be costly in stable market conditions, it likely helped soften the immediate impact of energy and feedstock volatility linked to recent disruptions in the Middle East.35
In a margin-constrained environment, these improvements matter. Even relatively small gains in operational performance can translate into a competitive advantage when scaled across complex global networks.
Continue the conversation
Meet the industry leaders
David Yankovitz
Kate Hardin
by
David Yankovitz
Tom Aldred
Robert Kumpf
Kate Hardin
Ashlee Christian
The authors would like to thank Ankhi Biswas for her key contributions to this report, including research, analysis, and writing.
The authors would also like to acknowledge the support of Clayton Wilkerson for orchestrating resources related to the report; Katrina Drake Hudson and Dario Failla who drove the marketing strategy and related assets to bring the story to life; Kaitlin Pellerin for her leadership in public relations; Rithu Thomas and Aparna Prusty from the Deloitte Insights team who edited the report and supported its publication; and Harry Wedel for the visual design.
Editorial (including production and copyediting): Rithu Thomas, Aparna Prusty, and Anu Augustine
Design: Pooja Lnu, Harry Wedel, and Molly Piersol
Cover image by: Pooja Lnu
Knowledge services: Vanapalli Viswa Teja
Visit the Deloitte Center for Energy & Industrials
Access more insights for the aerospace and defense, chemicals and specialty materials, engineering and construction, industrial manufacturing, mining and metals, oil and gas, power and utilities, and renewable energy sectors.