The future of essential jobs in core infrastructure sectors
How are essential jobs in oil and gas, manufacturing, construction, and other core infrastructure sectors evolving amid market shifts, talent gaps, and digital disruption?
Key takeaways
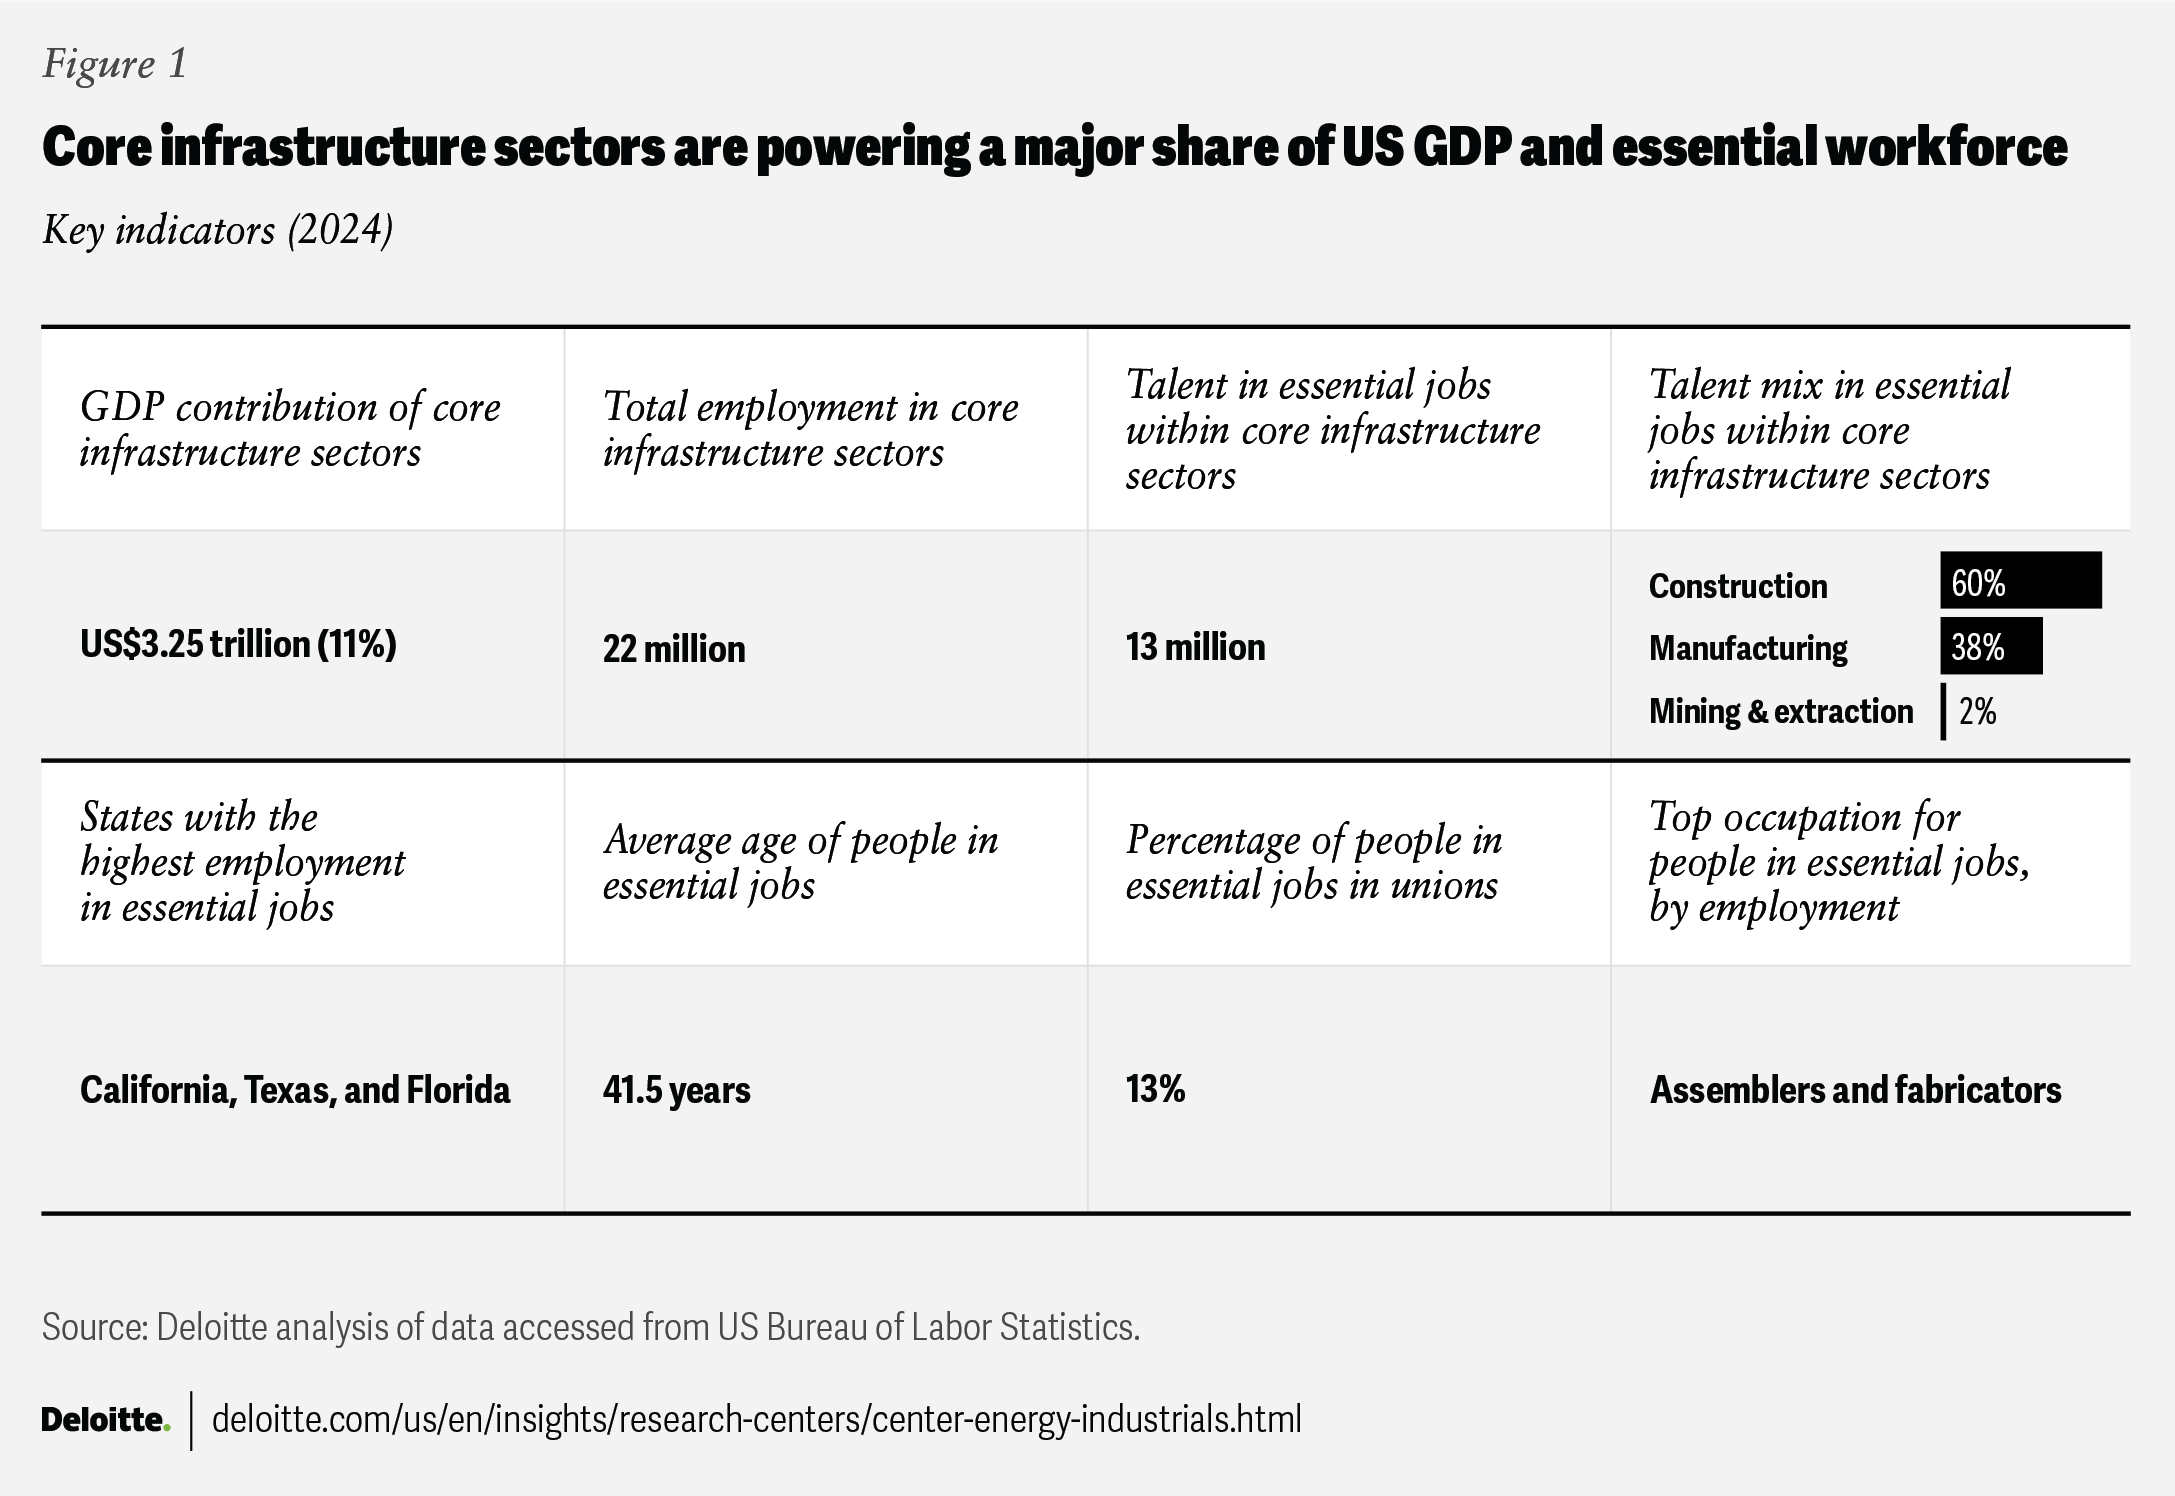
- Hydrocarbons, industrial product manufacturing, and construction (core infrastructure sectors) employ 40% of the talent in essential infrastructure jobs (industrial personnel) across the United States.
- By 2033, core infrastructure sectors will require more than 6 million new workers in essential jobs.
- Talent in essential jobs shows a preference for logistics and warehousing roles, raising concerns about having enough workers for construction, production, and maintenance in the future.
- Core infrastructure sectors have reversed years of outflow, filling an additional 1 million in essential jobs within the last two years, with the South and West leading the growth.
- Sustaining high productivity requires a combination of more machines, better capital utilization, and skilled hands.
- Digital upskilling of talent in essential jobs can deliver up to four times the gains of mechanical upskilling.
Please click here to download a PDF version of the Key takeaways.
More than 33 million Americans work in essential infrastructure jobs such as construction workers, machinists, electricians, welders, and fabricators.1 Nearly 40% of them (about 13 million) are employed in mining and extraction (including oil and gas), industrial product manufacturing, and construction sectors (hereafter referred to as core infrastructure sectors2), which are critical to America’s physical and economic infrastructure (figure 1).3
Table of contents
- Understanding workforce composition
- Decoding the talent inflow
- Locations driving essential jobs growth
- Automation's role in labor productivity and workforce dynamics
- Redefining skilled labor
- Building the backbone for essential infrastructure growth
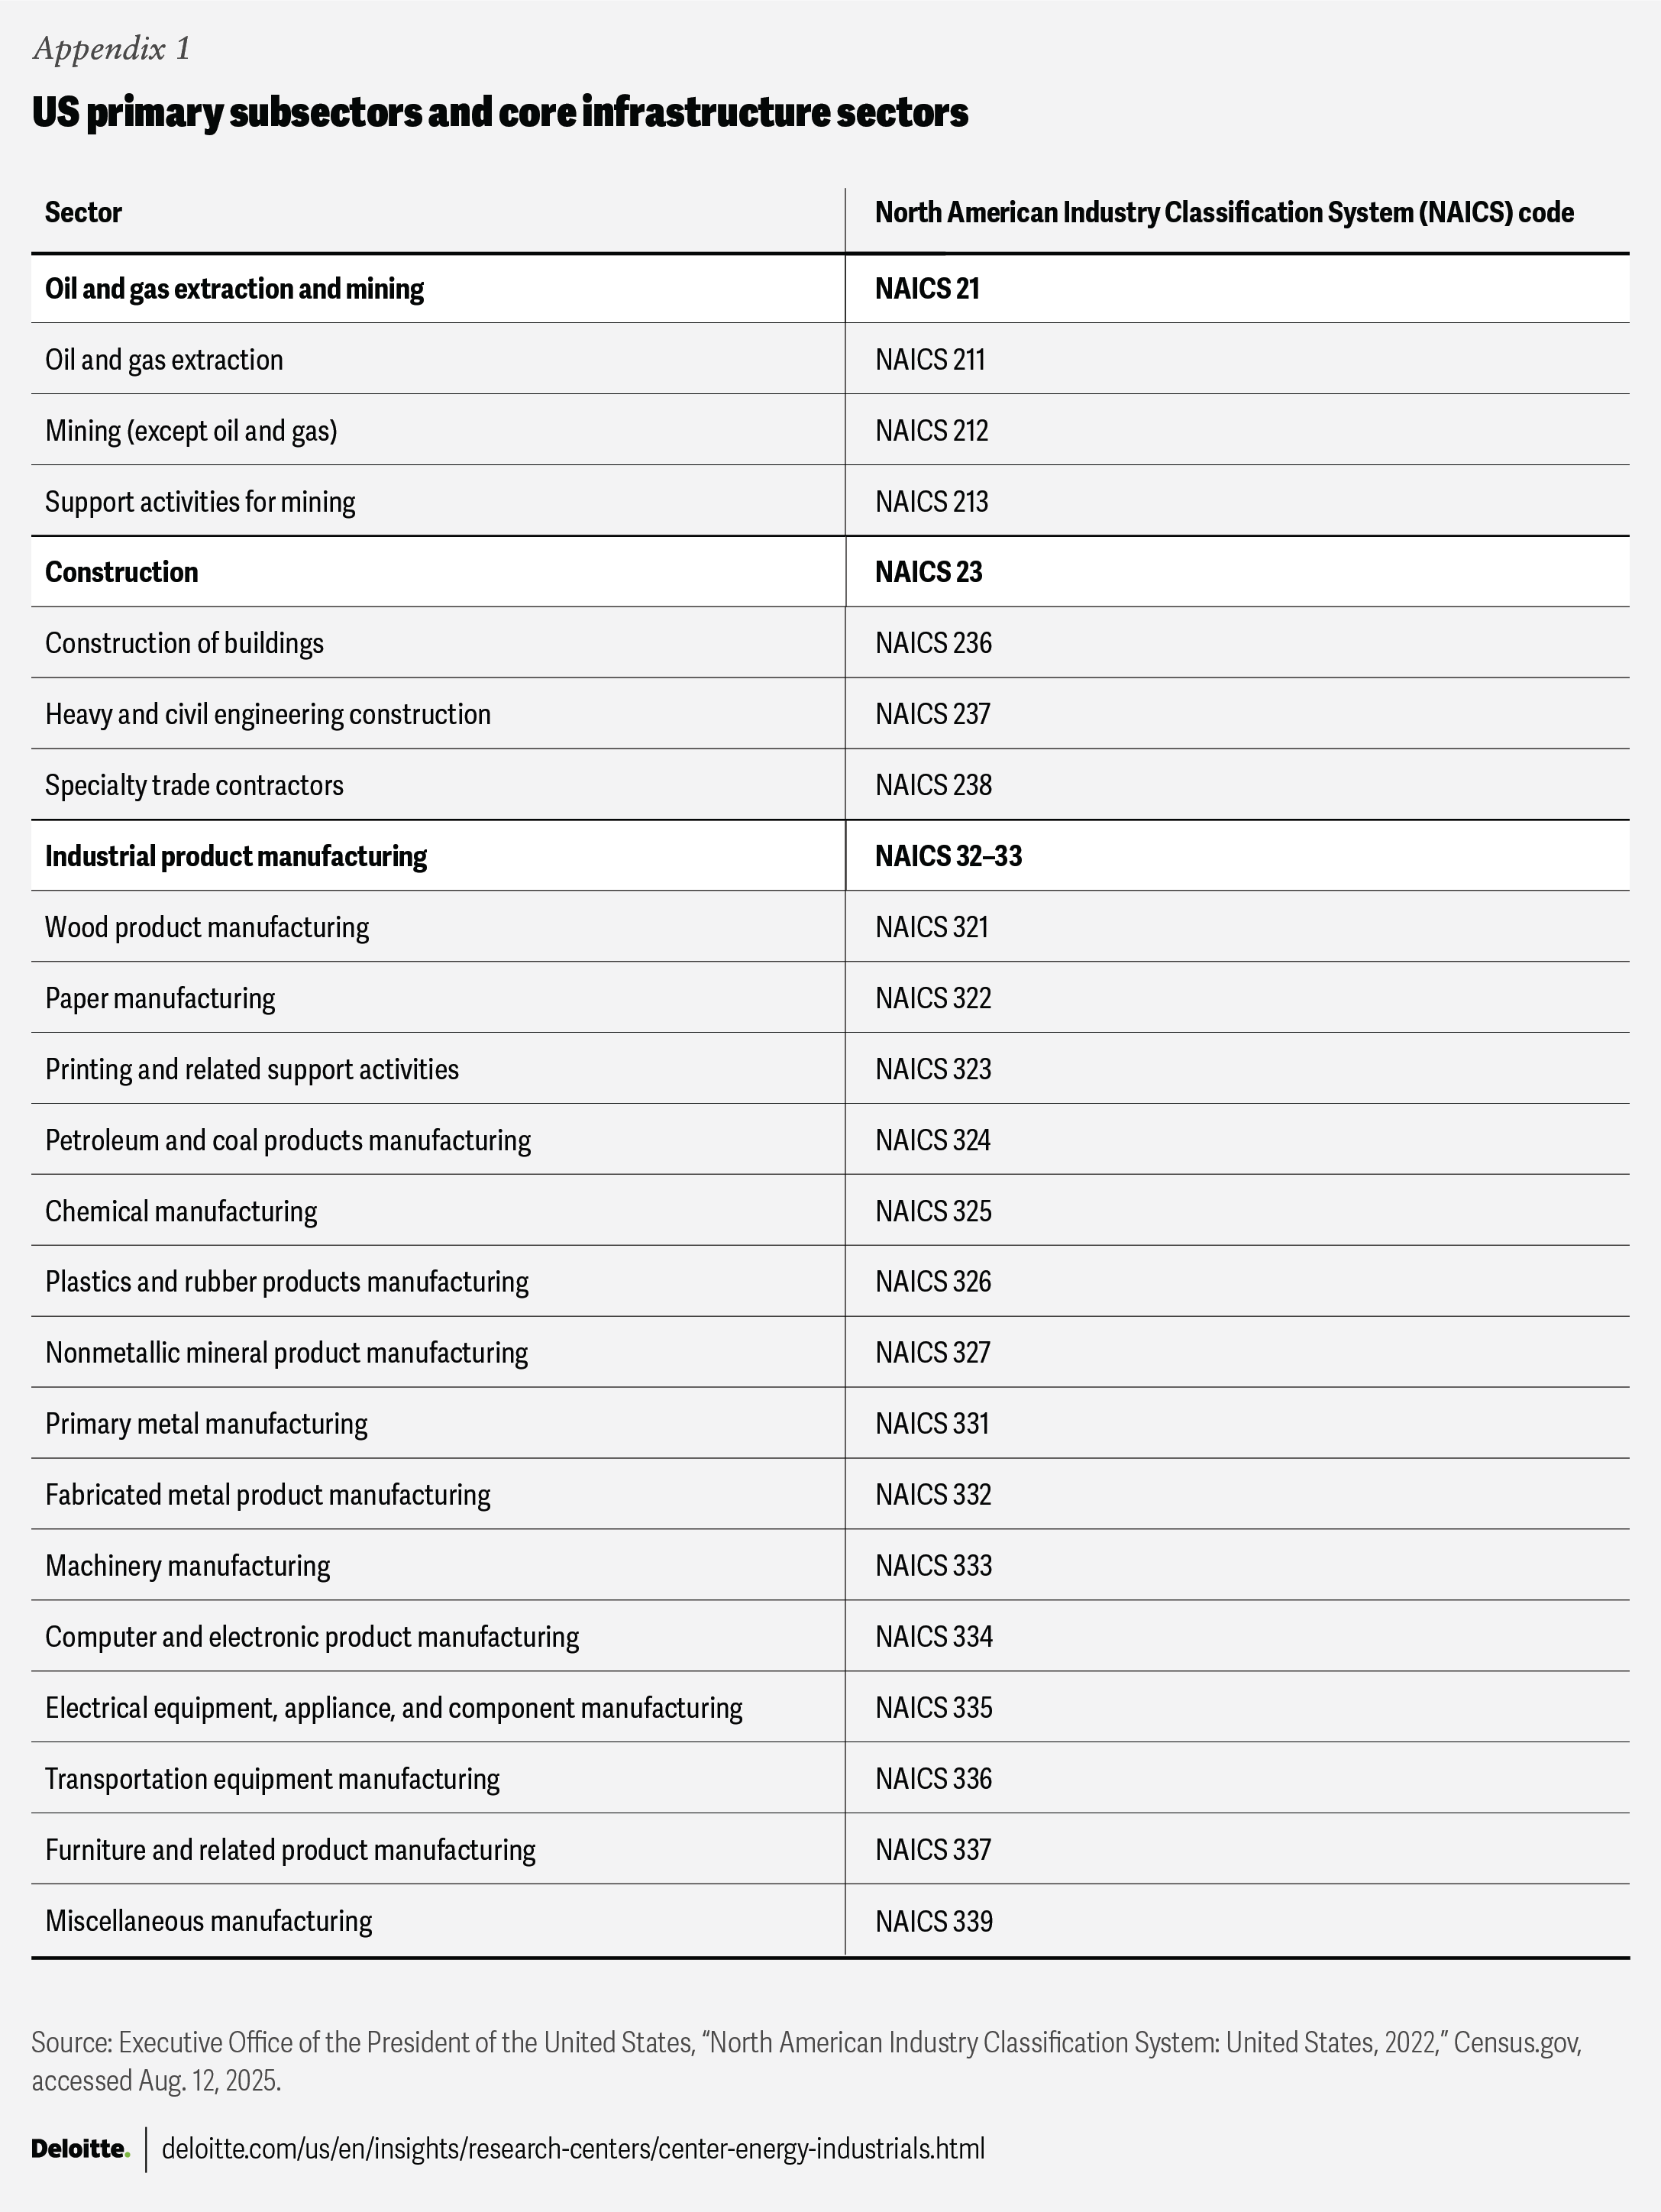
Essential workers in core infrastructure sectors are defined as industrial personnel whose roles in production, maintenance, logistics, and site safety are critical to the continuous operation of core infrastructure sectors such as mining, construction, materials manufacturing, and machinery or equipment manufacturing (North American Industry Classification System [NAICS] codes 21, 23, 32, 33). For further details, refer to the appendix.
Despite rapid advances in automation and digital technology, the proportion of talent in these essential jobs has remained unchanged over the past 15 years—20% across the overall US workforce and 40% within core infrastructure sectors.4 The numbers suggest that demand for talent in essential jobs has held firm, even as demand in other parts of the economy has shifted. Additionally, these jobs are among the hardest to backfill, as we highlighted in our recent research on workforce transformation in energy and chemicals. The US construction industry, for instance, is likely to face a deficit of half a million workers by 2026.5
Overall, approximately 6.1 million new essential jobs could be needed in core infrastructure sectors over the next decade—0.85 million as new positions and 5.25 million as backfills for retirements.6 A shrinking younger workforce (by 2033, the share of workers below 34 years is projected to decline by 5%), falling labor force participation (62.3% in 2025, a 5% decline compared to 2010 levels), aging infrastructure (US$5 trillion in depreciated assets), and immigration policy changes (25% of the essential workforce in core infrastructure sectors are coming from outside the United States) may pose challenges.7
One goal of the industry is to reshore and rebuild domestic energy and industrial product manufacturing capabilities. In this context, insights into five areas are vital:
- Career drivers shaping choices between production and service occupations
- Shifts in workforce movement into and out of core infrastructure sectors
- States, metropolitan areas, and cities driving essential jobs growth
- The role of technology in reshaping labor productivity and workforce dynamics
- Mechanical readiness and digital expertise across important essential jobs
1. The hidden drift: Decline in the mainstream, growth at the edges
The widening demand-supply gap in essential production, manufacturing, and repair and maintenance roles highlights the need for proactive talent management. Addressing this challenge starts with having a clear understanding of the four main categories of essential infrastructure jobs:
- Building and resource extraction occupations (for example, construction roles)
- Manufacturing and production occupations (for example, welders)
- Installation and maintenance occupations (for example, engine mechanics)
- Logistics and supply chain occupations (for example, warehousing-related roles)
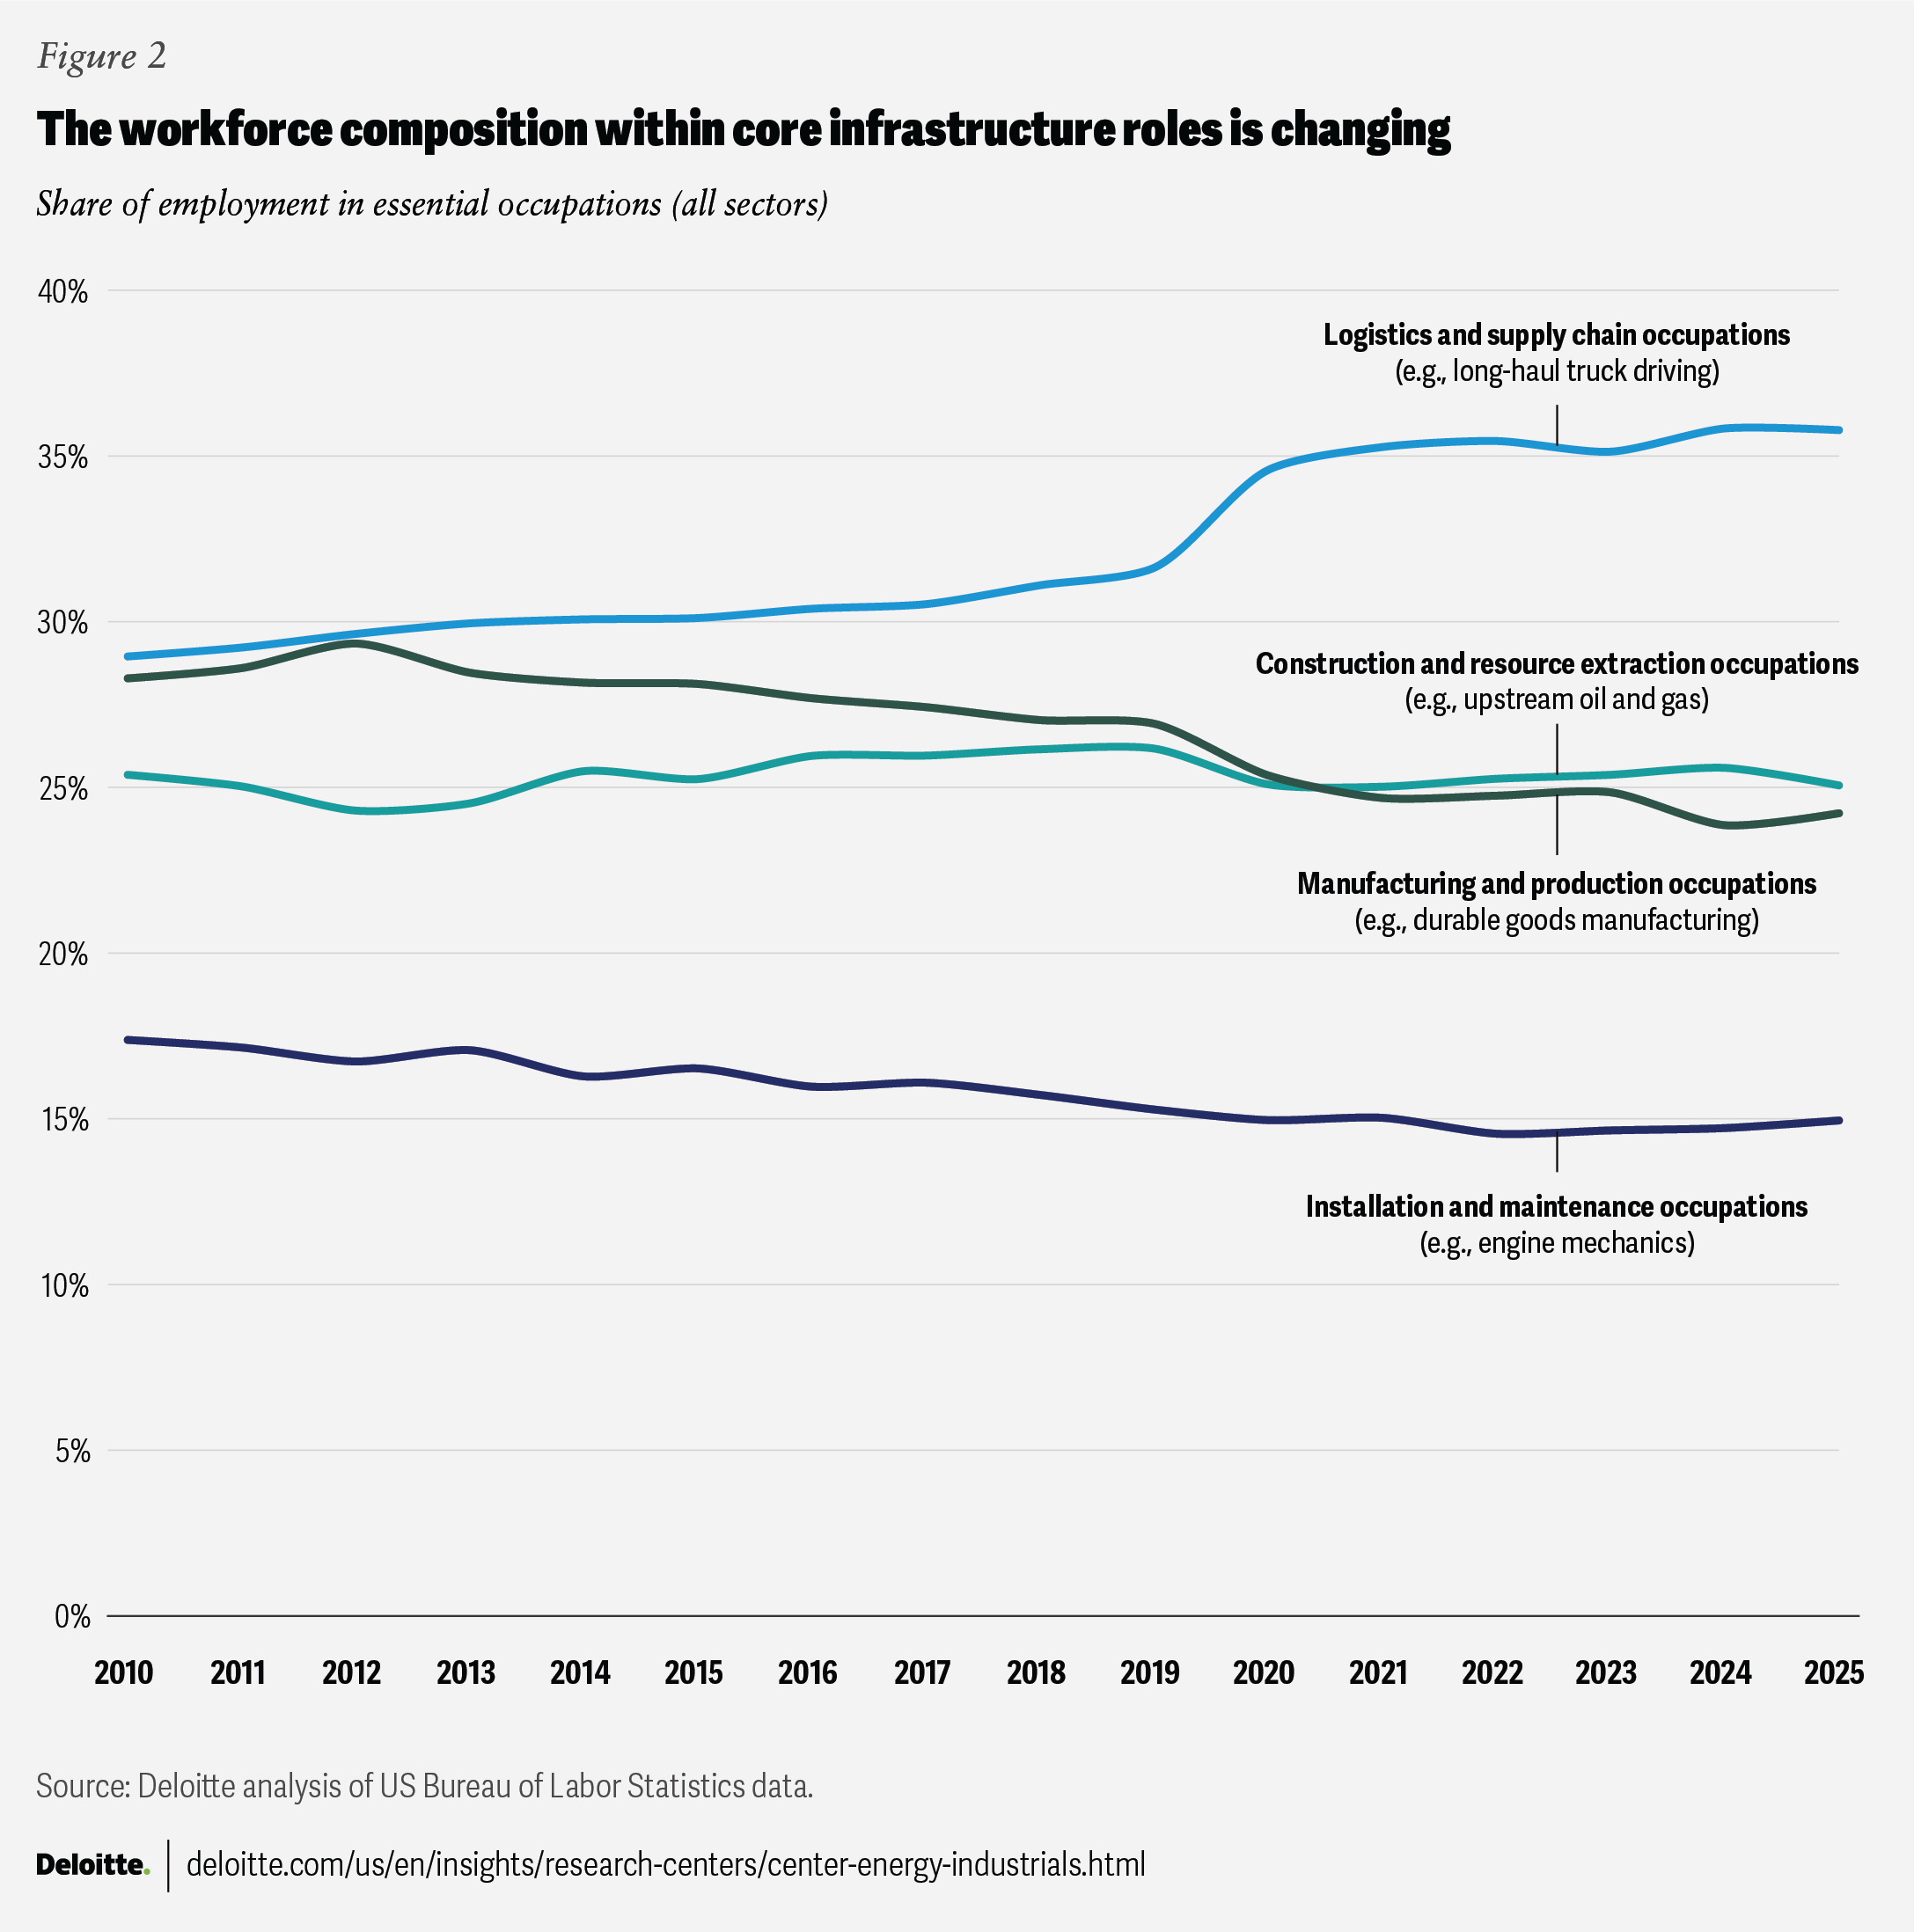
Recent shifts, particularly after the COVID-19 pandemic, have altered the composition of talent in these fields. The share of manufacturing and production occupations has dropped from 30% in 2012 to under 24% in 2025, while installation and maintenance occupations now account for less than 15% of the talent in essential jobs (figure 2).8 This decline may undermine efforts to strengthen domestic manufacturing and increase the likelihood of repair delays and system failures as infrastructure ages.
But where is this workforce—and the latest wave of new talent in essential jobs—gravitating? Increasingly, they appear to be moving toward logistics and supply chain-related occupations, which now account for nearly one-third of all essential jobs.9 Although wages in these roles tend to be lower, many workers are drawn by abundant openings, low barriers to entry (often a high school diploma and short-term, on-the-job training), as well as relatively stable demand tied to e-commerce growth.10
This shift has also been propelled by expansion in the e-commerce, technology, and export sectors. For example, in 2024, the national average wage for logistics and supply chain occupations was 24% lower than that of building and resource extraction roles, yet they continue to attract a growing share of essential workers.11
Changes within each of the core infrastructure sectors are also significant. Talent in essential jobs within the construction sector is increasingly choosing residential over nonresidential or industrial projects. The share of workers in residential construction has grown from 37% in 2010 to over 41% in 2024, a period that also saw residential construction spending increase fourfold to US$682 billion.12
2. The great inflow: A million people in essential jobs moved into core infrastructure sectors in the past two years
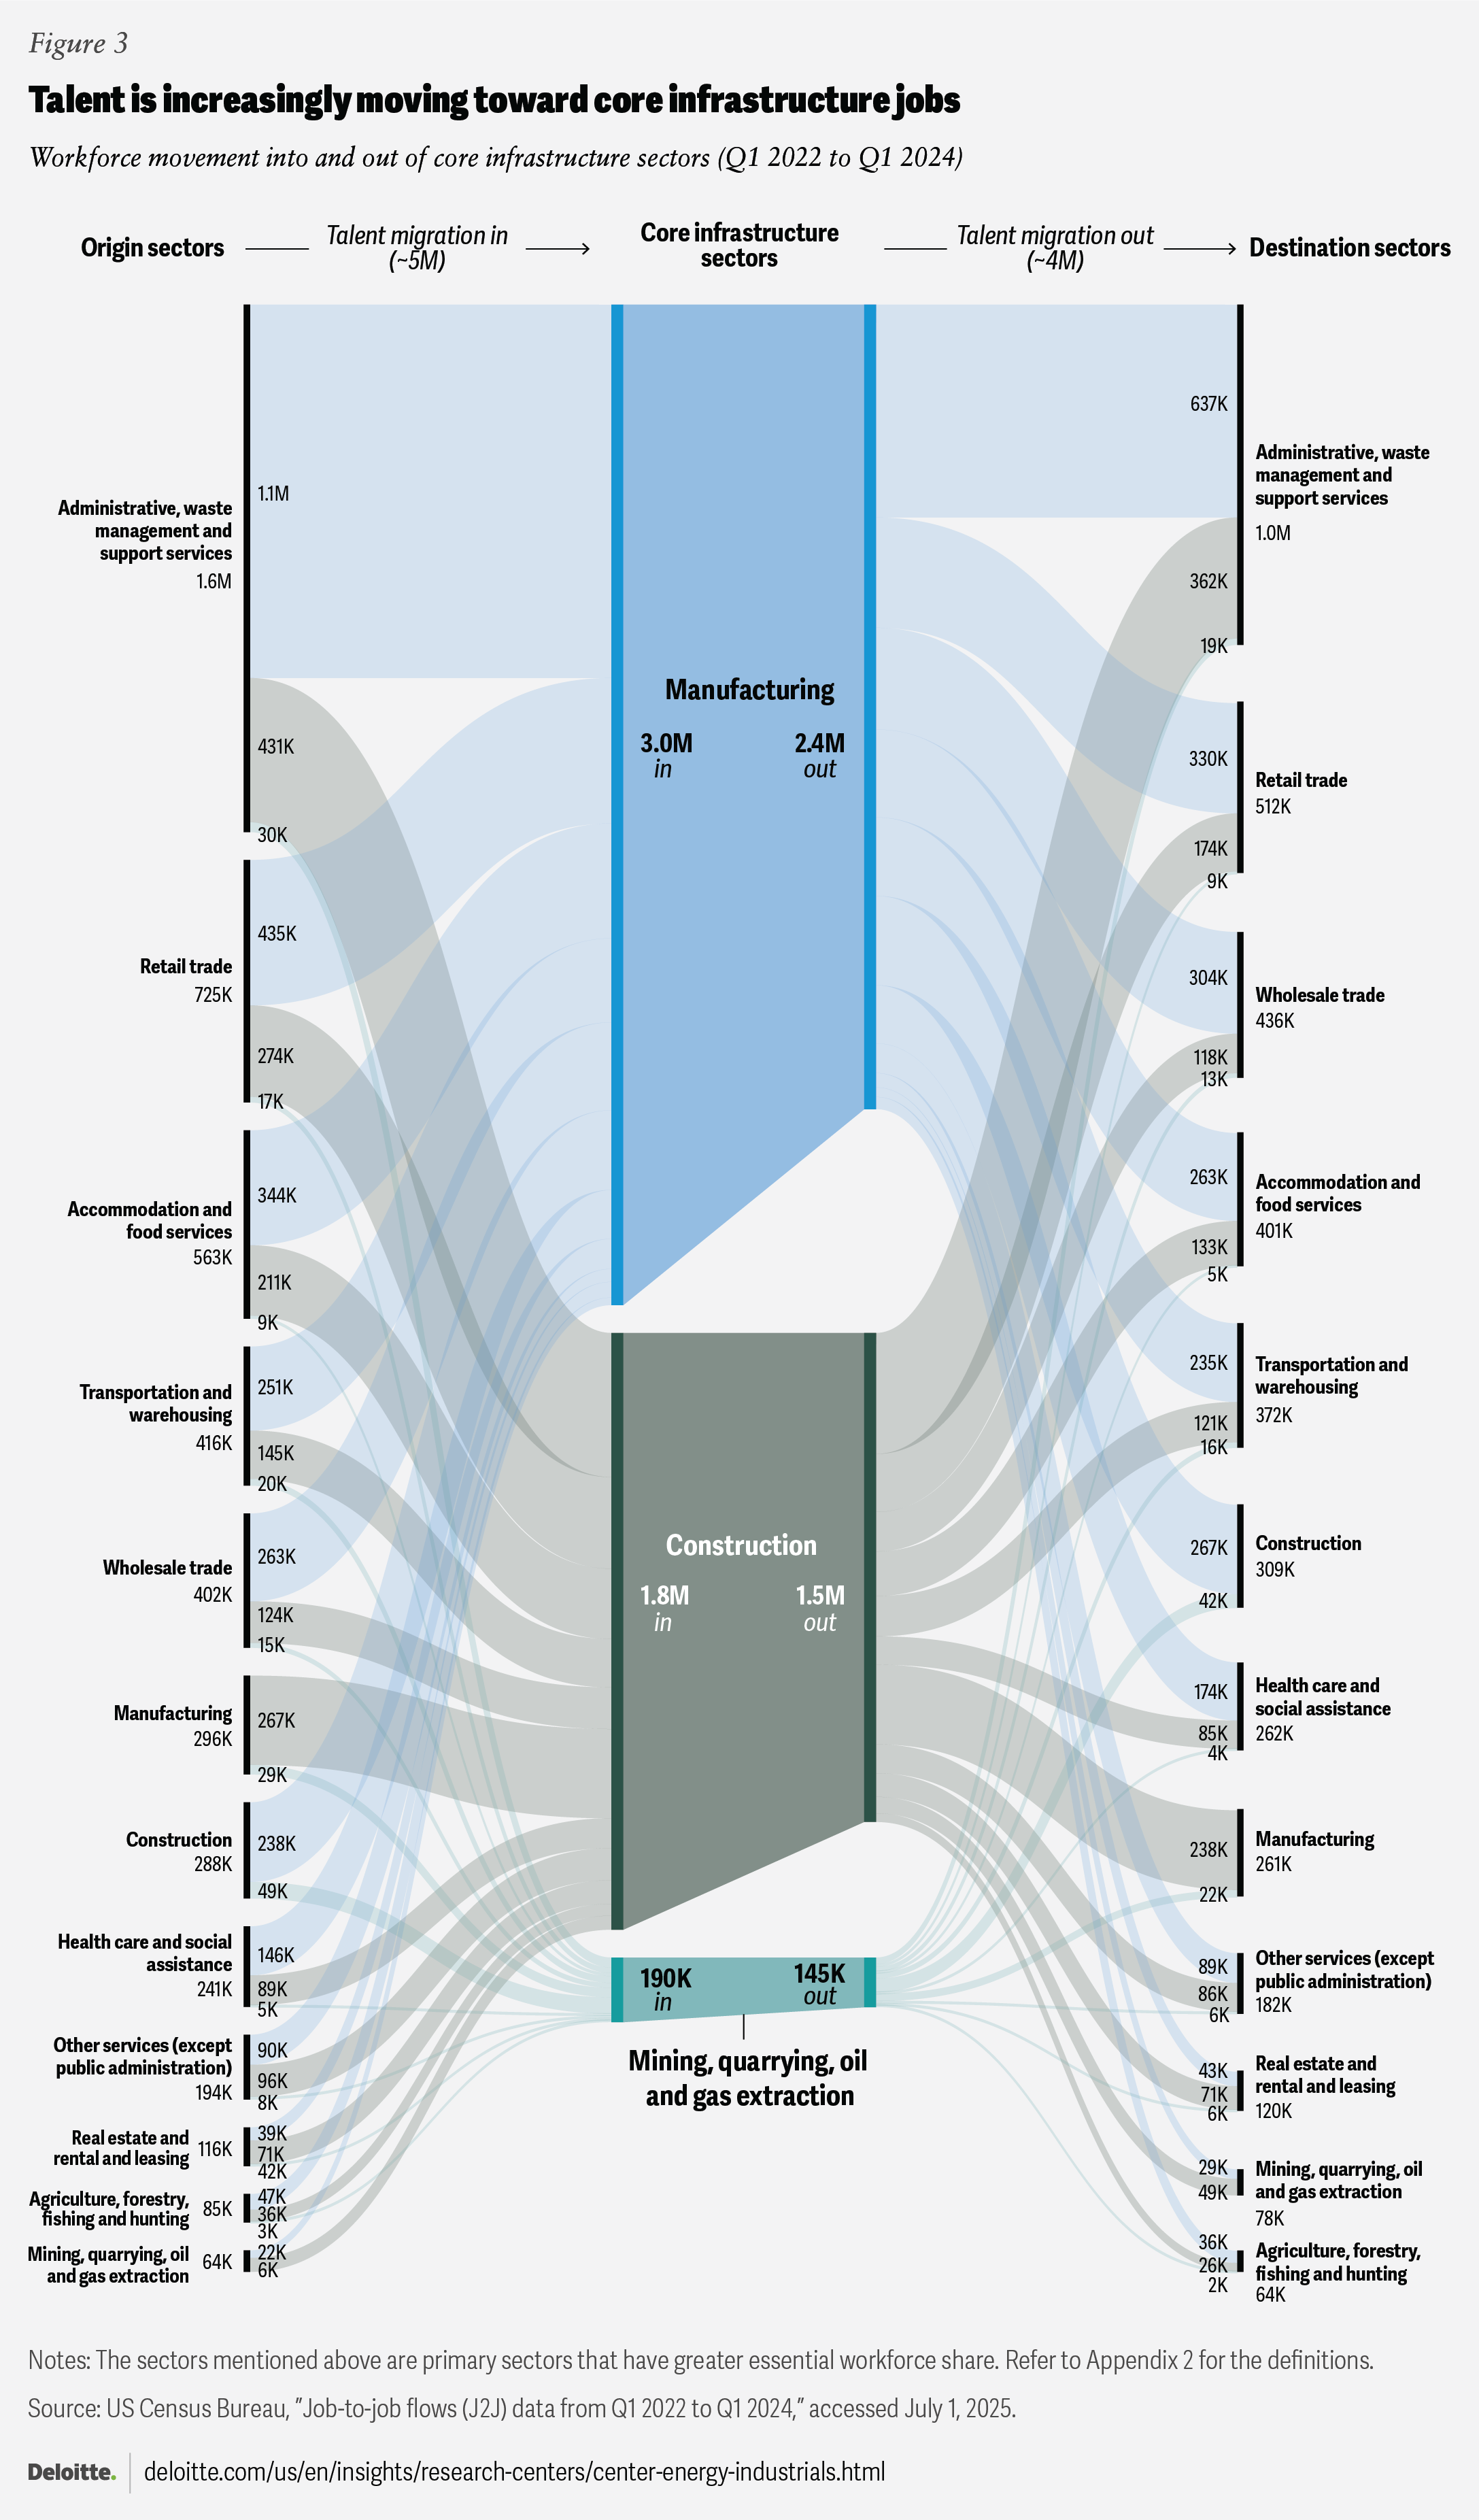
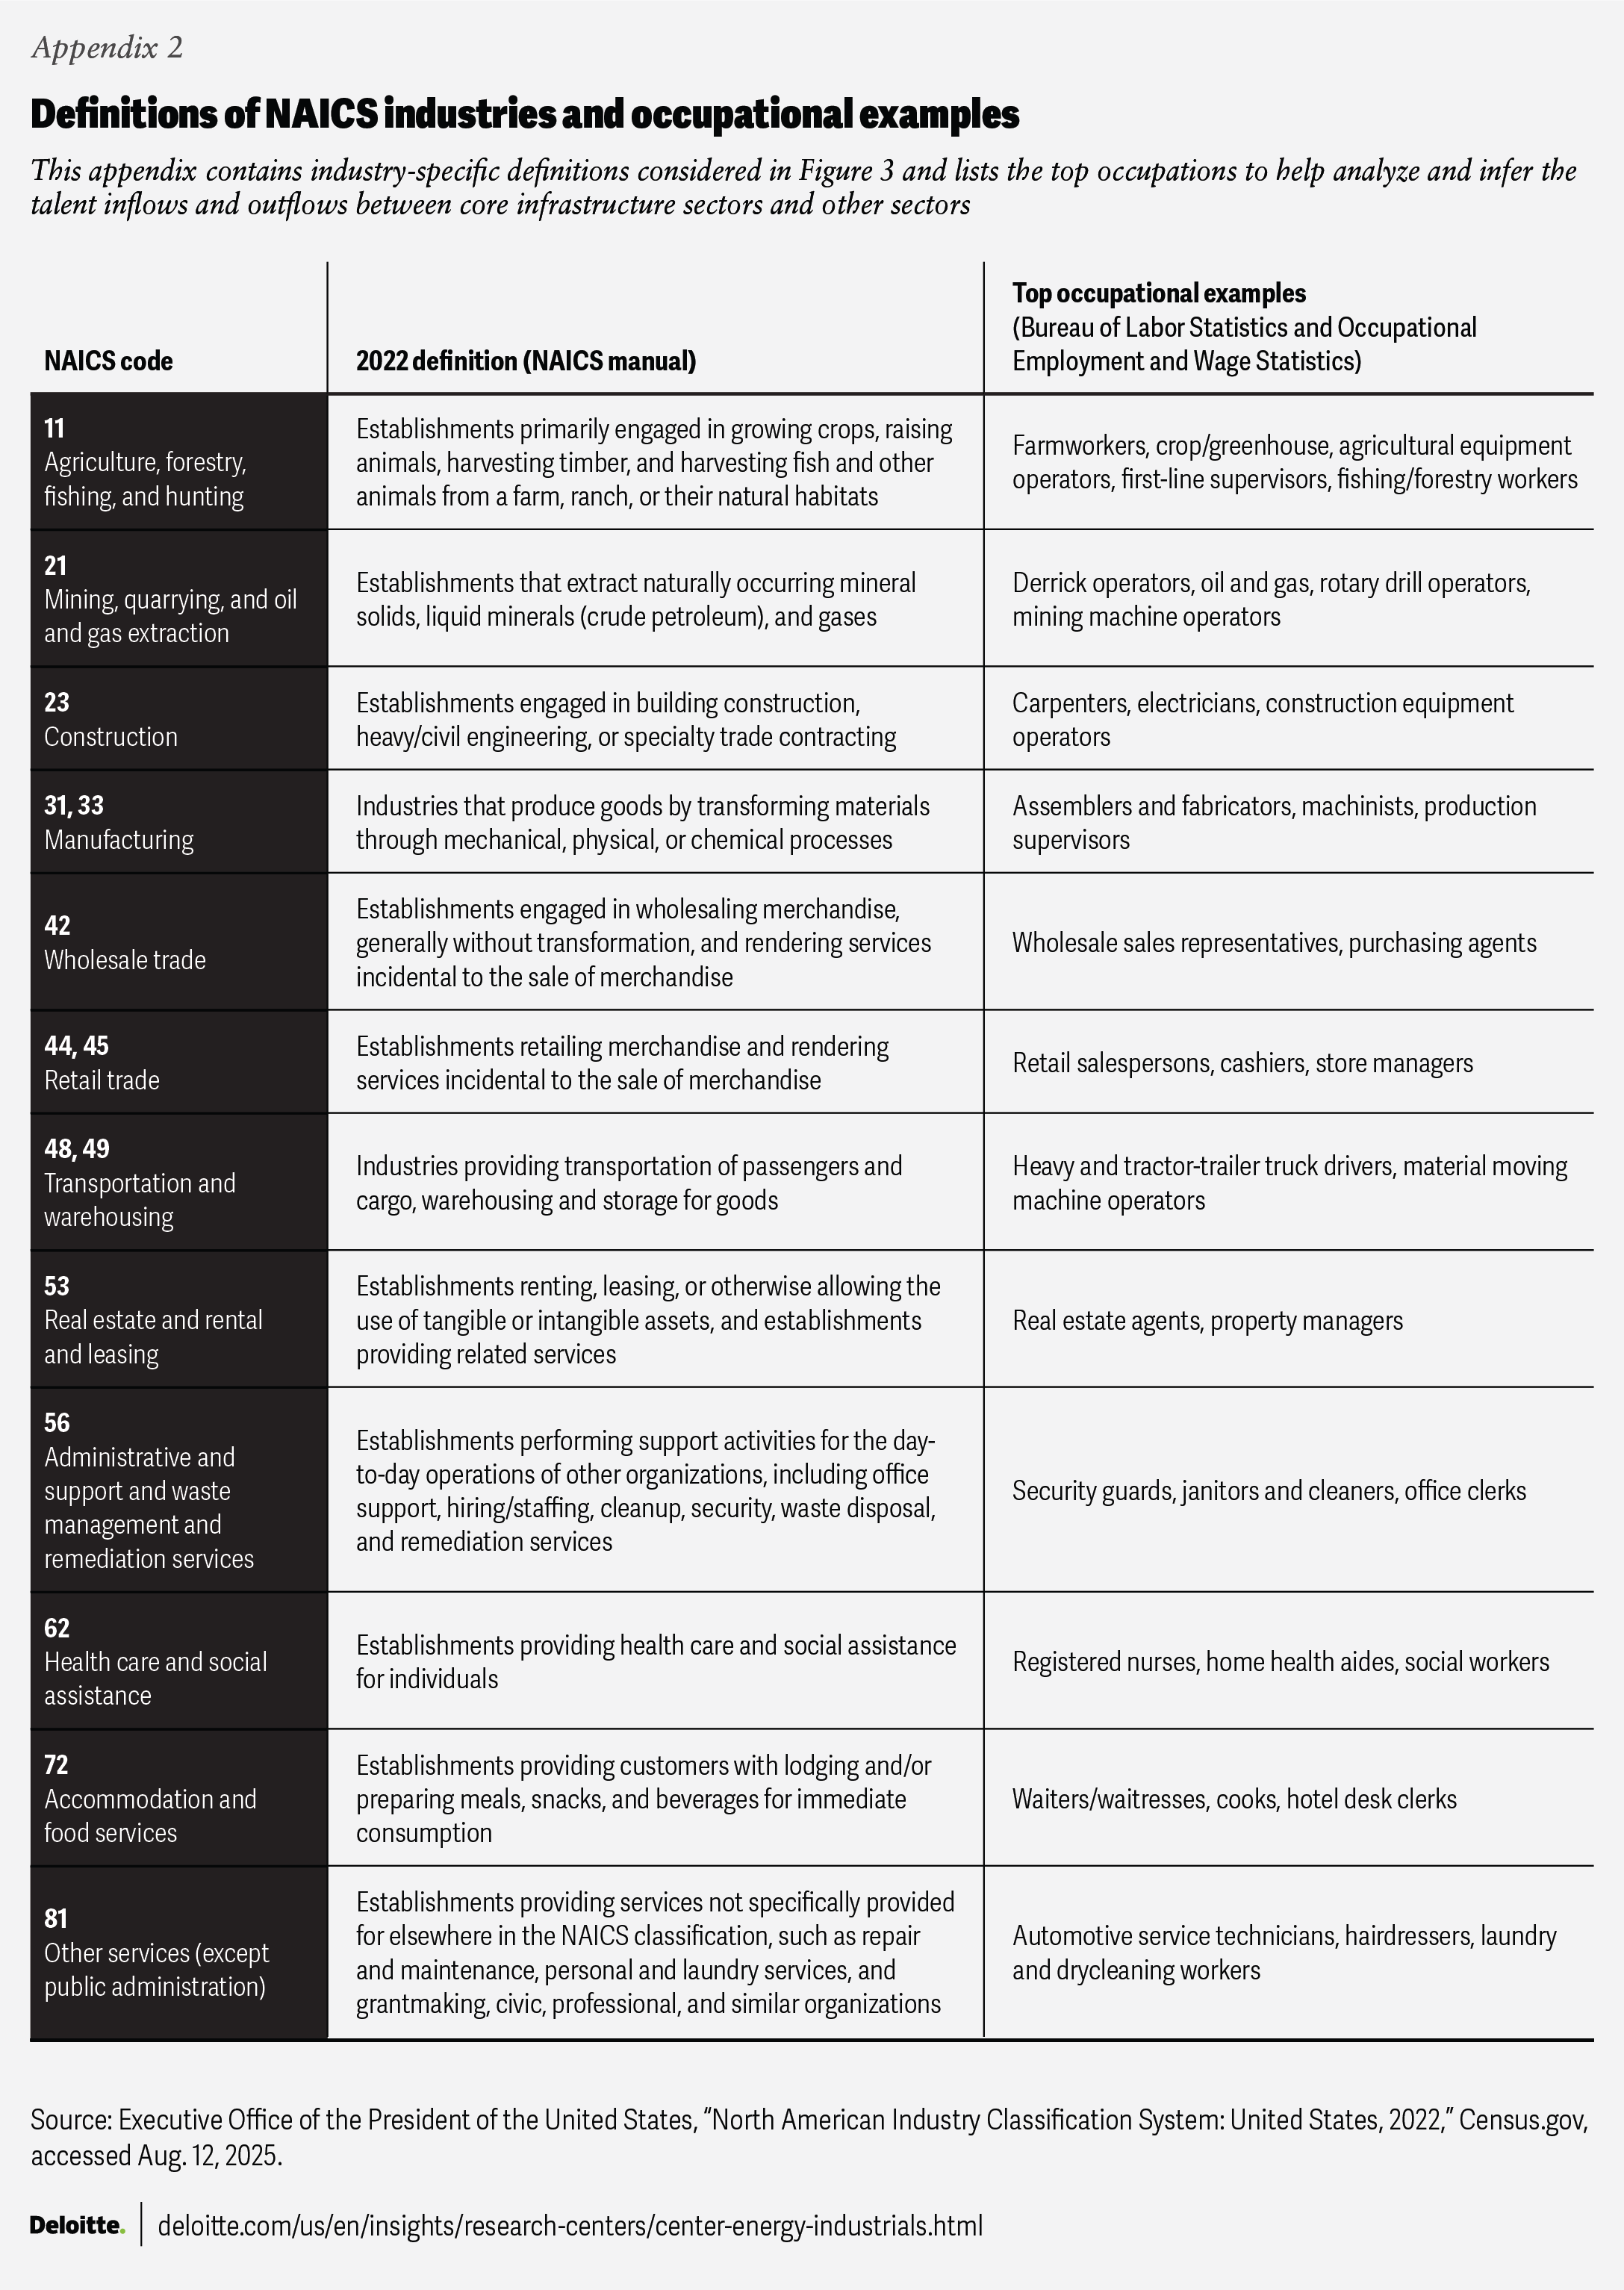
With over 200 major infrastructure projects worth more than US$650 billion underway or proposed across the United States, the sector should look to provide the right balance of growth and stability for its workforce.13 After years of workforce decline, there has been a shift: Between the first quarter of 2022 and the first quarter of 2024, core infrastructure sectors added nearly 5 million essential workers and lost nearly 4 million to other industries (see appendix 2 for a detailed definition of “other industries”), resulting in a net gain of nearly 1 million (figure 3).14 Building on this progress will likely be critical for long-term growth and success.
- Talent entering from other sectors: US manufacturing15 and construction sectors attracted the largest share of talent among core infrastructure sectors, accounting for 96% (4.8 million workers) of overall inflows, while mining and extraction made up the remaining 4% (0.2 million workers). A notable portion came from administrative and support services—especially temporary staffing agencies—potentially reflecting a growing “temporary-to-permanent” workforce trend (figure 3). Additionally, about 780,000 workers from retail, accommodation, and food services shifted into the manufacturing sector between the first quarter of 2022 and the first quarter of 2024. On average, hourly wages in manufacturing were nearly 35% higher than in retail.16
- Talent leaving for other sectors: Despite being primary talent attractors, the US manufacturing and construction sectors also experienced the highest outflows, collectively losing around 3.9 million workers since 2022. Notably, over 637,000 workers moved from manufacturing to administrative and support services. While core infrastructure sectors can offer stable employment, demanding work conditions and advanced skill requirements may also prompt some workers to pursue roles in other fields.17
- Talent moving within the core infrastructure sectors: A robust two-way talent exchange exists among core infrastructure sectors: Nearly 267,000 workers moved from manufacturing to construction, over 238,000 shifted in the opposite direction, and about 49,000 transitioned from construction to mining. These movements highlight the interchangeability of skills and a closely connected talent pool, potentially influenced by wage differentials and competition for talent.18 For example, the average hourly wages in construction are typically 12% higher than in manufacturing.19
3. Talent magnets: Shifting industrial base and divergent policies affecting talent growth in essential core infrastructure jobs across locations
As talent and growth sectors shift across the United States, organizations should consider refreshing their location strategies to stay ahead of emerging talent clusters and retain workers in essential core infrastructure jobs. Over the past 15 years, the South and West have led the talent growth in essential jobs, adding nearly 5.6 million workers—twice as many as the Midwest and Northeast combined—driven by expansion in the e-commerce, technology, and export sectors (figure 4).20 State-level policies on wages, housing, cost of living, and economic incentives have also played a key role in attracting talent to these regions. Primarily led by Texas, California, and Florida, these regions now host eight of the world’s 20 largest warehouses and support several infrastructure projects, keeping demand for essential talent high.21
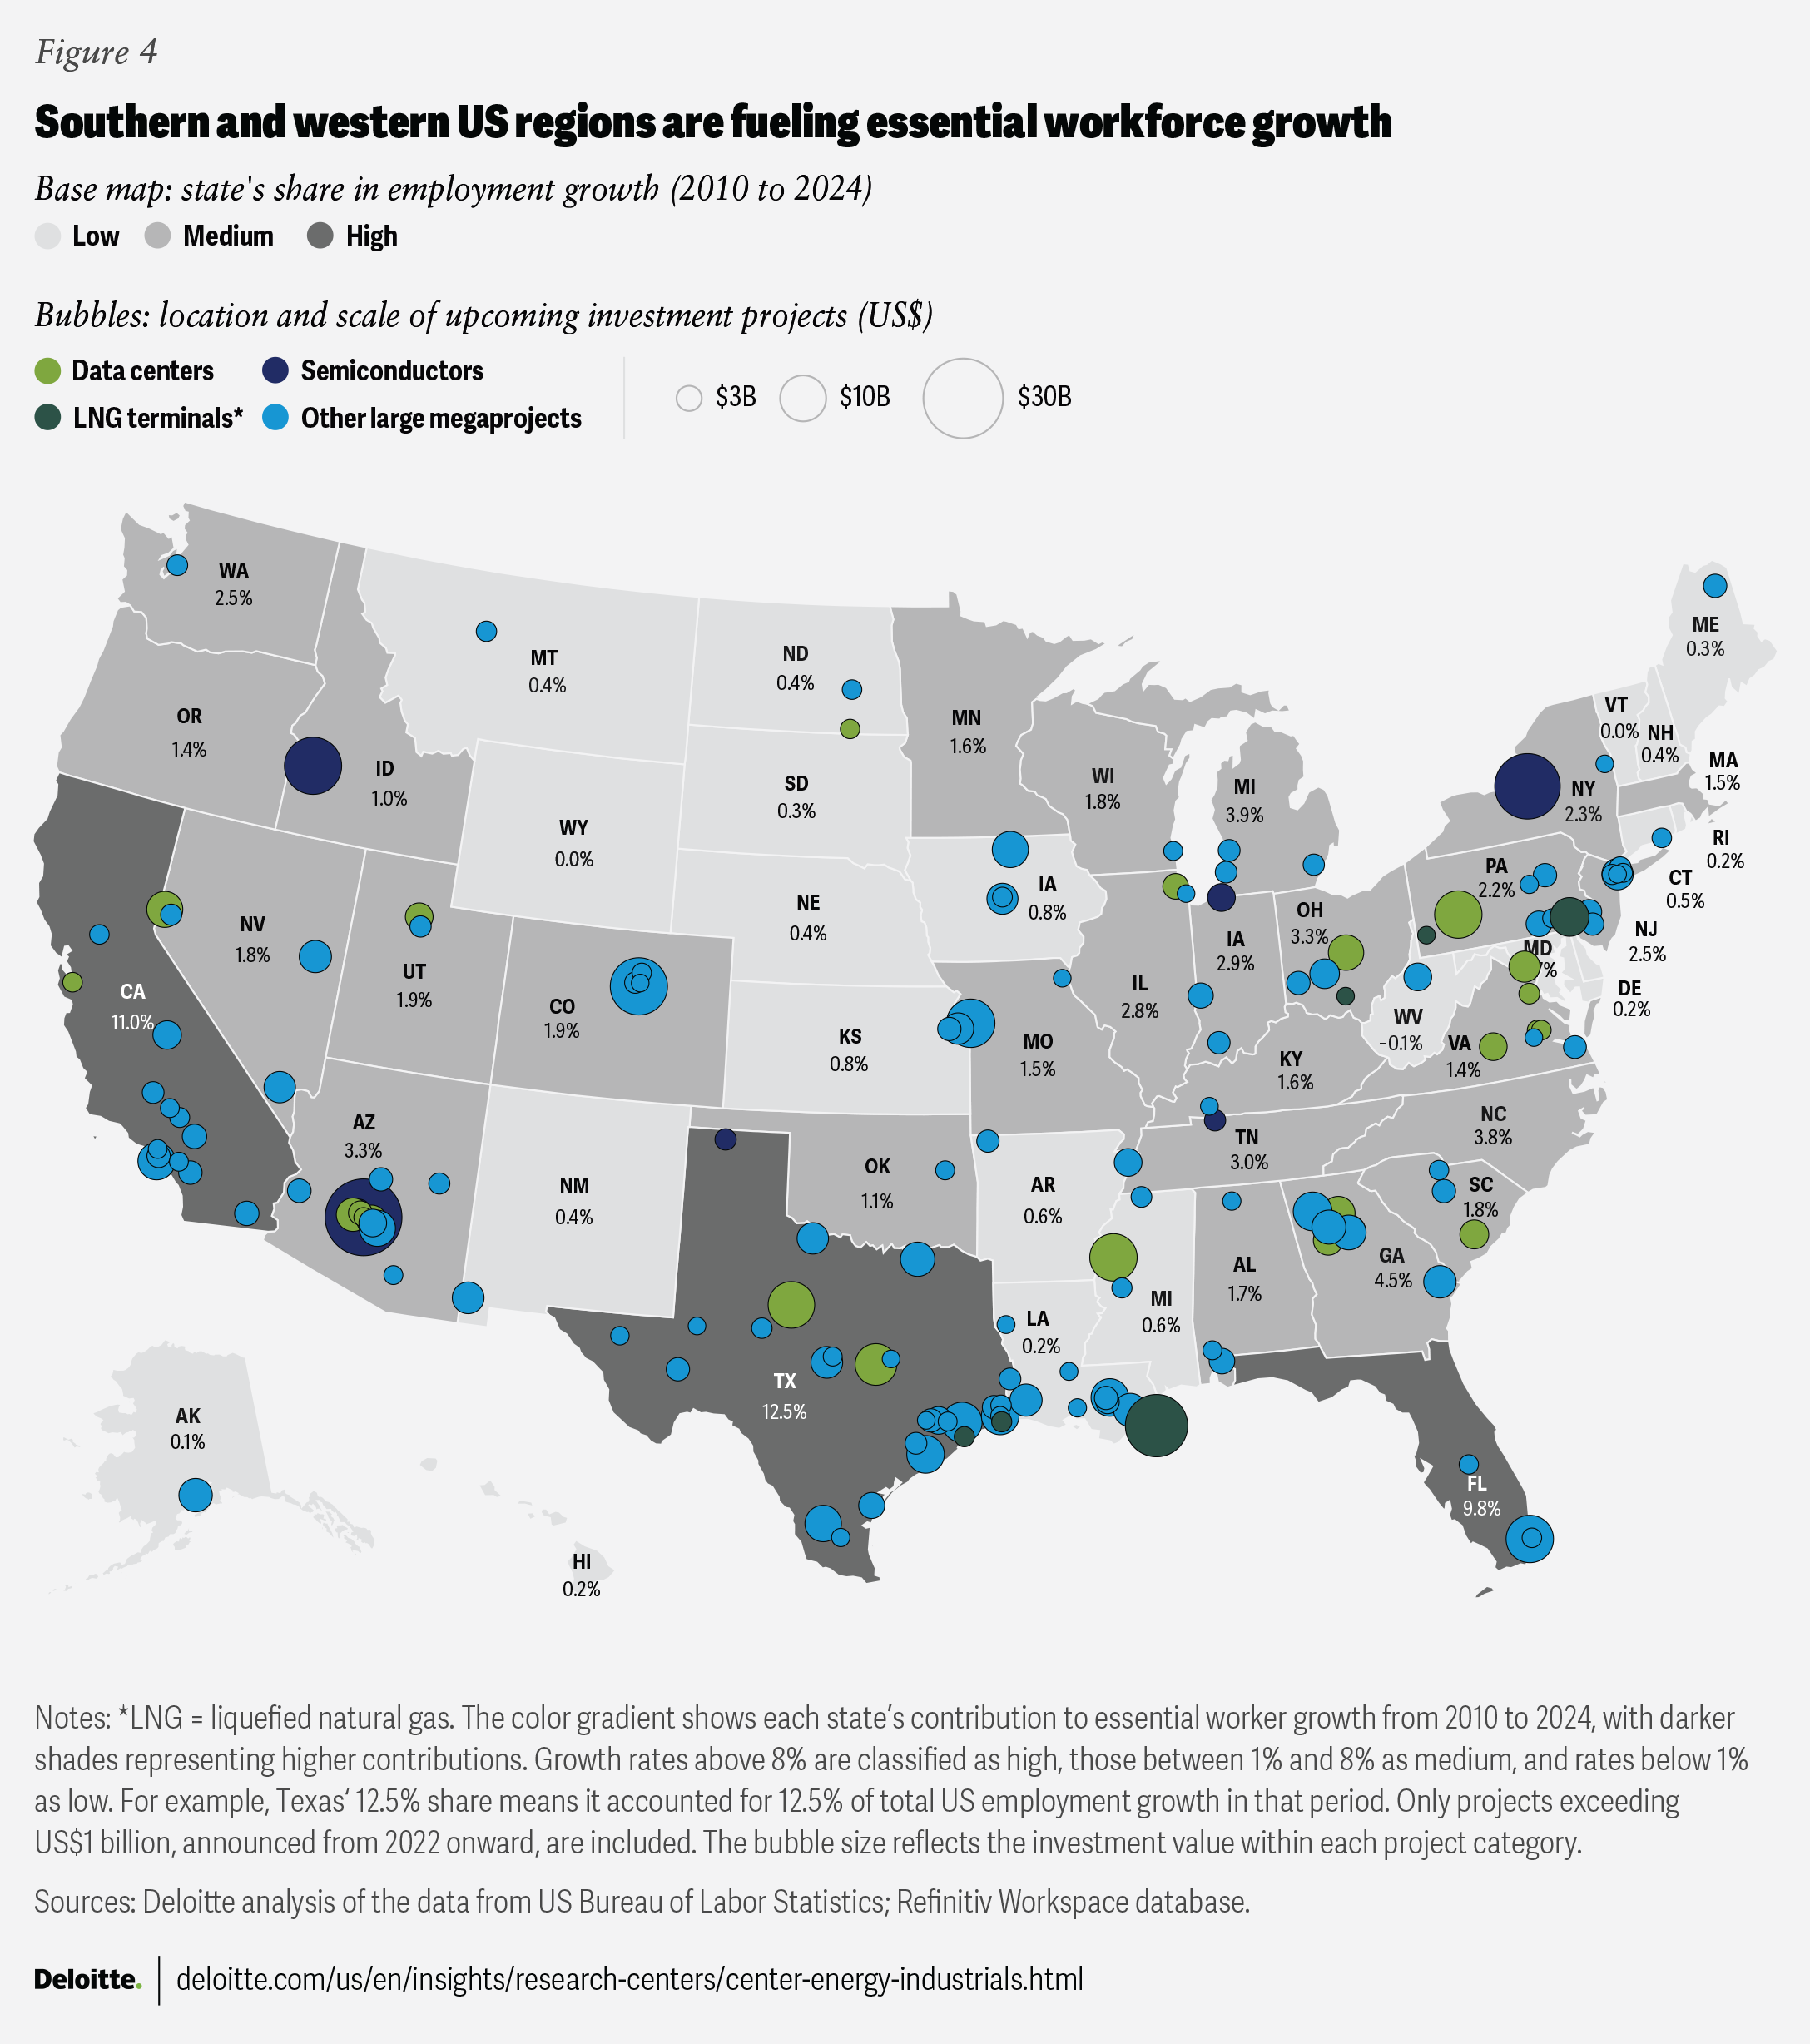
Following the shale boom, Texas appears poised for another wave of growth, with nearly US$100 billion in new liquified natural gas, data center, and semiconductor projects driving strong demand for skilled workers in essential jobs.22 Similarly, about US$30 billion in planned investments for data centers and other megaprojects is expected to sustain strong demand for essential workers in California, which has added nearly 900,000 such jobs since 2010, mainly in logistics and supply chain.23
Several metropolitan areas have also become talent magnets due to better job opportunities and more affordable housing. For instance, the Atlanta–Sandy Springs–Marietta (Georgia) and Phoenix–Mesa–Chandler (Arizona) areas have collectively added over 400,000 essential jobs since 2010. Atlanta, recognized as one of the most affordable cities in the United States, has further attracted talent with a 30% wage increase in essential jobs over five years, surpassing the 22% wage growth seen at the national level.24 Similarly, cities like Riverside (California) and Houston (Texas) continue to attract talent in essential jobs, as wage inflation has kept pace with the rise in cost of living for these essential jobs.
Conversely, the decline in overall manufacturing and coal mining activities resulted in significant job losses in some regions, which have seen a fall in essential jobs since 2010.25 Low wages have further accelerated worker outflow, as have economic shifts toward new industries. For example, the New Orleans–Metairie area in Louisiana has seen a shift in jobs due in part to the local economy shifting toward tourism, which now accounts for nearly 40% of its local economic activity.26
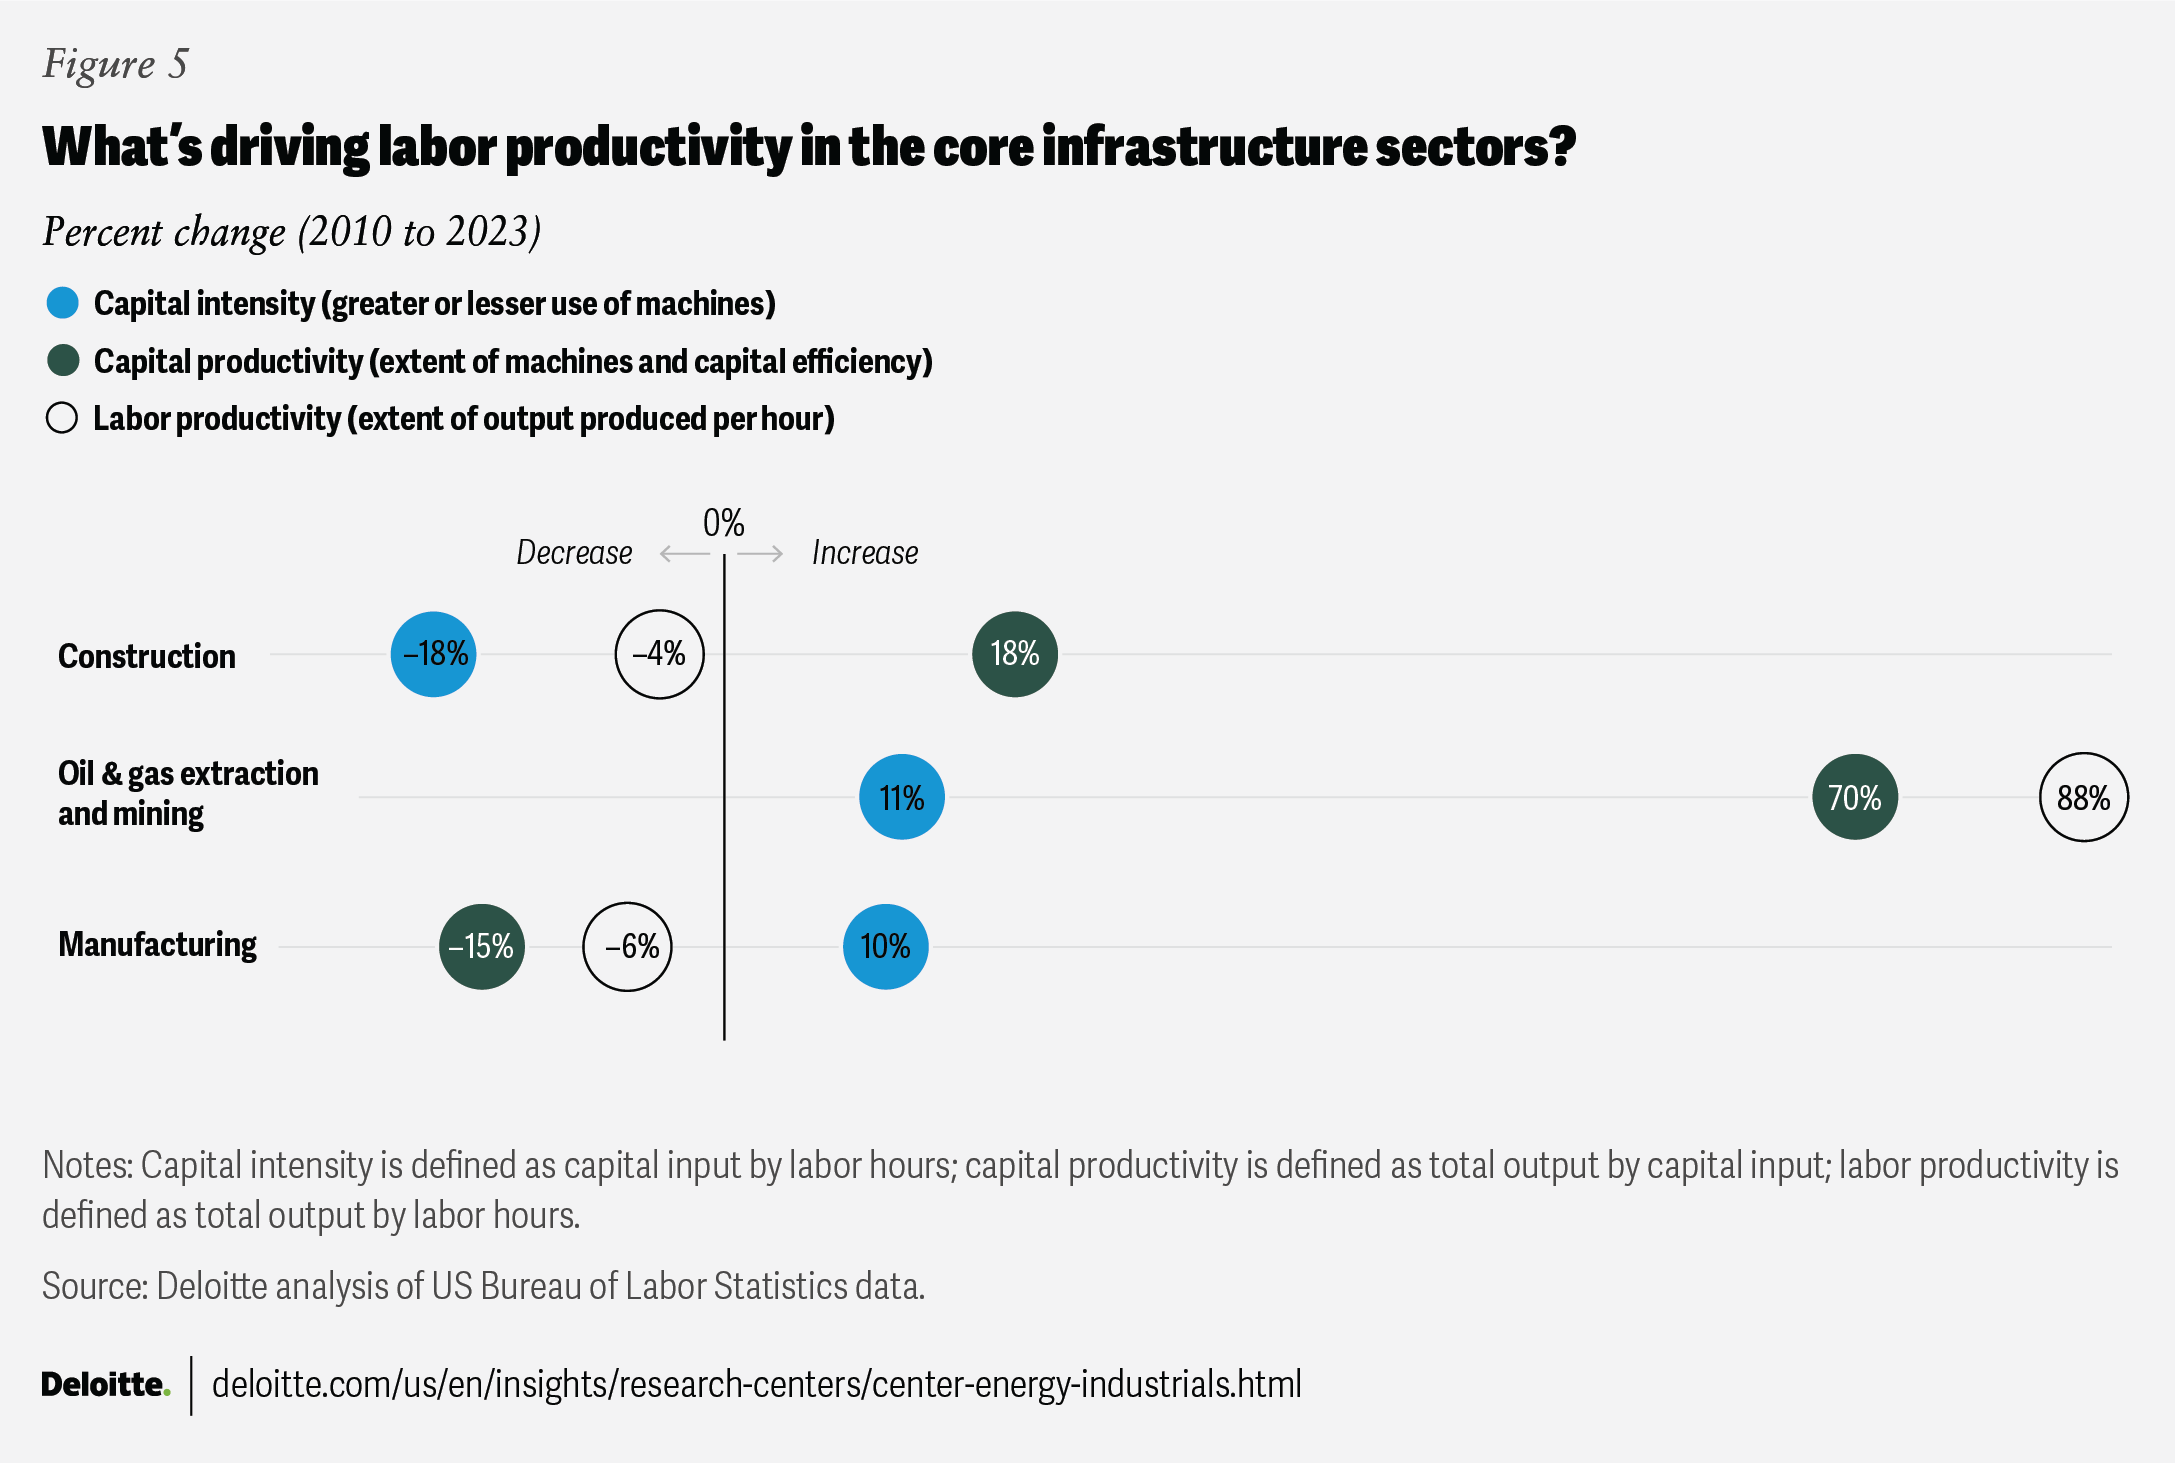
4. Powering productivity: Blending advanced machines, smarter capital, and skilled talent for lasting gains
Integrating capital decision-making with labor impact is likely vital for sustaining higher productivity at an enterprise level, especially given the challenges of backfilling positions, rising competition for talent across sectors, and supply chain delays affecting project timelines. Amid these trends, three factors are key to driving productivity:
1. Changes in capital intensity (using more or fewer new machines)
2. Changes in capital productivity (how efficiently technology or capital is used)
3. The result of hiring a more skilled or unskilled workforce
Over the last 15 years, automation and digitalization have transformed essential jobs, although the impact has varied across core infrastructure sectors. This variation is believed to be influenced by decisions on capital intensity, capital productivity, and employee training or upskilling (figure 5).27 The US oil and gas extraction and mining sector, led by shale, experienced the greatest disruption from advances like multi-pad drilling, halving talent needs for essential jobs. Yet, the sector increased its real output by over 75% and reduced fatal occupational injuries by about 30%.28 In this way, some extractive industries have performed relatively strongly, benefiting from disciplined capital management, technological investment, and workforce upskilling.
In the industrial manufacturing sector, capital intensity has increased by 10%, while capital productivity has declined by 15% and labor productivity by 6% since 2010.29 After strong gains between 2010 and 2019, real sectoral output in dollar terms has declined to 2010 levels.30 This moderation suggests that external factors such as low demand and supply chain issues may have offset productivity and efficiency gains. Rising cost pressures and higher offshoring alternatives—driven by both applicant shortages and skills gaps—are also likely contributing factors.
In the US construction sector, higher capital productivity has been the main driver of productivity change, increasing by 18% since 2010.31 However, capital intensity declined by a similar margin. While rising capital productivity with reduced capital intensity is typically positive, labor productivity in the sector fell by 4% over the same period.32 This suggests that recent hires may have lacked adequate training, possibly due to a shortage of qualified applicants. The skills gap is further exacerbated by the outflow of skilled engineering talent from the construction sector. As engineering becomes more tech-enabled, traditional engineering and construction firms struggle to compete with large technology companies.33 Each year, around 12,000 professionals transition from the construction sector to technology-related jobs—a trend that appears to be accelerating.34
5. Redefining skilled labor: The dual imperative of mechanical and digital proficiency
Organizations should consider redefining skills, updating job descriptions, and focusing on training where upskilling is most needed. In the core infrastructure sectors, being “skilled” now requires both mechanical and digital abilities. Mechanical proficiency is the hands-on ability to operate, maintain, and repair complex machinery and tools, while digital fluency refers to the capability to use computers and digital platforms to document, analyze, and integrate technology into daily work.
Mapping the top 25 essential occupations across both mechanical and digital fronts reveals just how distinct these skill sets can be (figure 6). Nearly 50% of the workforce in these occupations—such as welders and fabricators—possess traditional skills, where a smaller proportion of the work may be automated.35 However, as occupations like electricians (projected employment growth of 10.8% by 2033) and roofers (5.8%)—shown in green bubbles in the graph—are set to expand, they need to be skilled on both fronts to meet the industry’s evolving demands.36
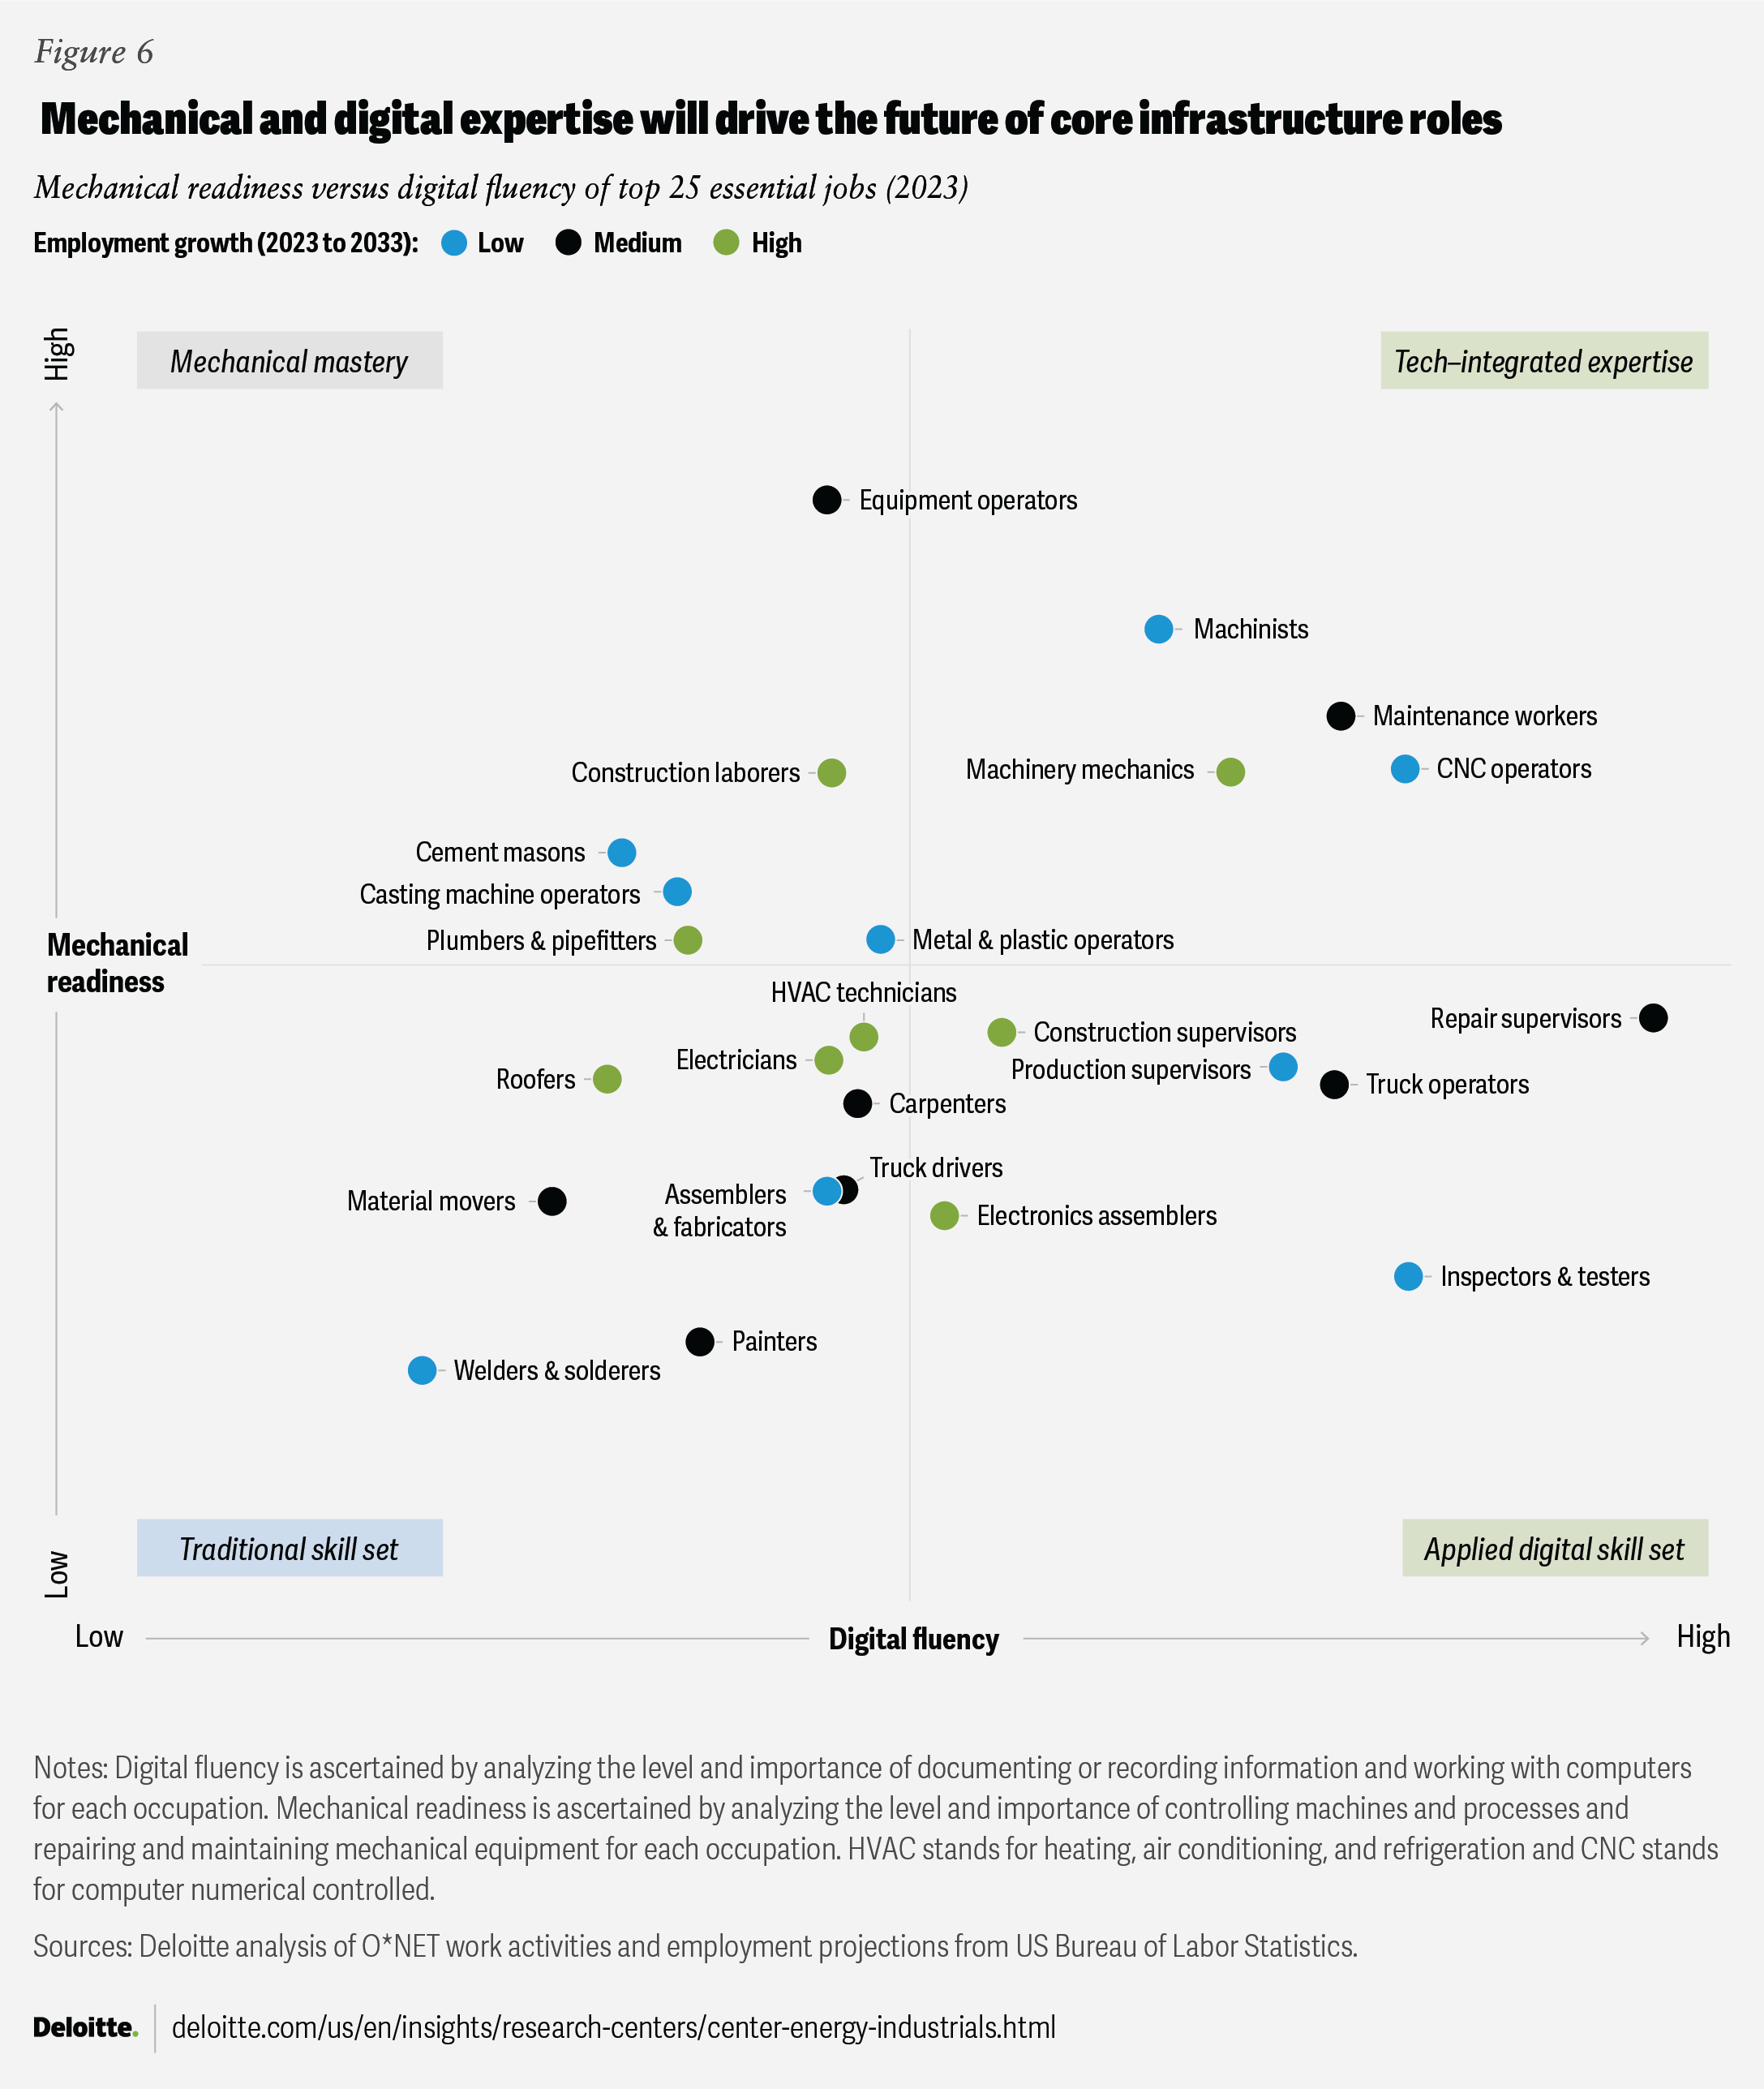
In contrast, about 10% of essential jobs require tech-integrated expertise—a relatively higher skill level in both mechanical and digital domains—although job growth varies by role.37 For example, industry machinery mechanics are projected to grow significantly (17.2% by 2033) due to the rising adoption of automated manufacturing and the ongoing need for equipment maintenance, highlighting the importance of continued upskilling.38
These roles are also evolving digitally, requiring proficiency with maintenance management platforms, virtual equipment models, augmented reality, and generative artificial intelligence for smarter equipment diagnosis and repair. For example, some roles in the oil and gas industry, such as offshore platform inspection, have moved from manual work to drone-based operations. Conversely, computer numerical control operators and machinists are expected to experience slower growth as automation and advanced software reduce demand.39
It is widely recognized that as mechanical proficiency among workers rises, sector output tends to increase accordingly. However, digital upskilling has been found to have two to four times the impact on the core infrastructure sector’s output compared to mechanical skills.40
Building the backbone
Over the next decade, core infrastructure sectors may need 6.1 million new essential workers.41 With over US$650 billion in new projects announced or proposed, competition for skilled talent in the United States will likely intensify.42 Historically, hiring for essential jobs has been on an as-needed basis, with retention and upskilling left to contractors, unions, or rendered unnecessary by technologies. Today, leaders across sectors should account for deep structural shifts and consider evolving their workforce strategies to address growing labor challenges.
- Attract younger, tech-minded workers by offering job stability and long-term opportunities, highlighting the digital evolution of roles and access to upskilling in emerging technologies, modernizing recruitment narratives, and showcasing clear pathways for career growth.
- Reincentivize core roles by implementing targeted incentives, offering apprenticeship programs (“earn as you learn”), and addressing key barriers to participation—such as housing and transportation—to attract and retain workers in high-need roles.
- Refresh location strategy and localize where needed by creating satellite sites (even temporary) for recruiting and mobilizing the workforce, leveraging workforce analytics at both the role and site levels, and tapping into underutilized labor pools in slower-growth states.
- Prioritize tech modernization to improve efficiency in high-turnover and safety-critical areas, align capital decision-making with labor impact, adopt modular construction methods to bring jobs closer to where people reside, and apply scenario-based planning to forecast automation’s impact on overall workforce composition.
- Engage stakeholders across functions (human resources, finance, operations, and technology) to ensure workforce planning is integrated, and refresh job definitions and learning programs to reflect evolving job and technology requirements.
Continue the conversation
Meet the industry leaders
Zillah Austin
Nichelle McLemore
David Yankovitz
Michelle Meisels
Stephanie Stachura
BY
Zillah Austin
Michelle Meisels
Stephanie Stachura
Kate Hardin
Anshu Mittal
The authors would like to thank Abhinav Purohit, Ankhi Biswas, Vamshi Guguloth, and Rajest Medisetti for their extensive contributions to this report, including extensive research, in-depth analysis, visualization, and narrative development. Additionally, the authors would like to thank John Morehouse, Scott Welch, Carolyn Amon, Ashlee Christian, Kruttika Dwivedi, and Anuradha Joshi for their cross-sector review and inputs.
The authors would also like to thank Nichelle McLemore, Dave Yankovitz, Peter Buettgen, Chris Murphy, Anne-Claire Roesch, Britni Saunders, Leigh Otey, Rana Sen, Victor Reyes, Sami Alami, and Missy Henriksen for their extensive subject matter input and review.
Finally, the authors would like to acknowledge the support of Clayton Wilkerson for orchestrating resources related to the report; Teresa Thomas, Randy Brodeur, Tara Treado, and Heather Ashton who drove the marketing strategy and related assets to bring the story to life; Kaitlin Pellerin and Courtney Flaherty for their leadership in public relations; Julia Tavlas and Julia Pickle for their policy and risk review; Rithu Mariam and Aparna Prusty from the Deloitte Insights team who edited the report and supported its publication; and Harry Wedel for the visual design.
Cover image by: Pooja LNU