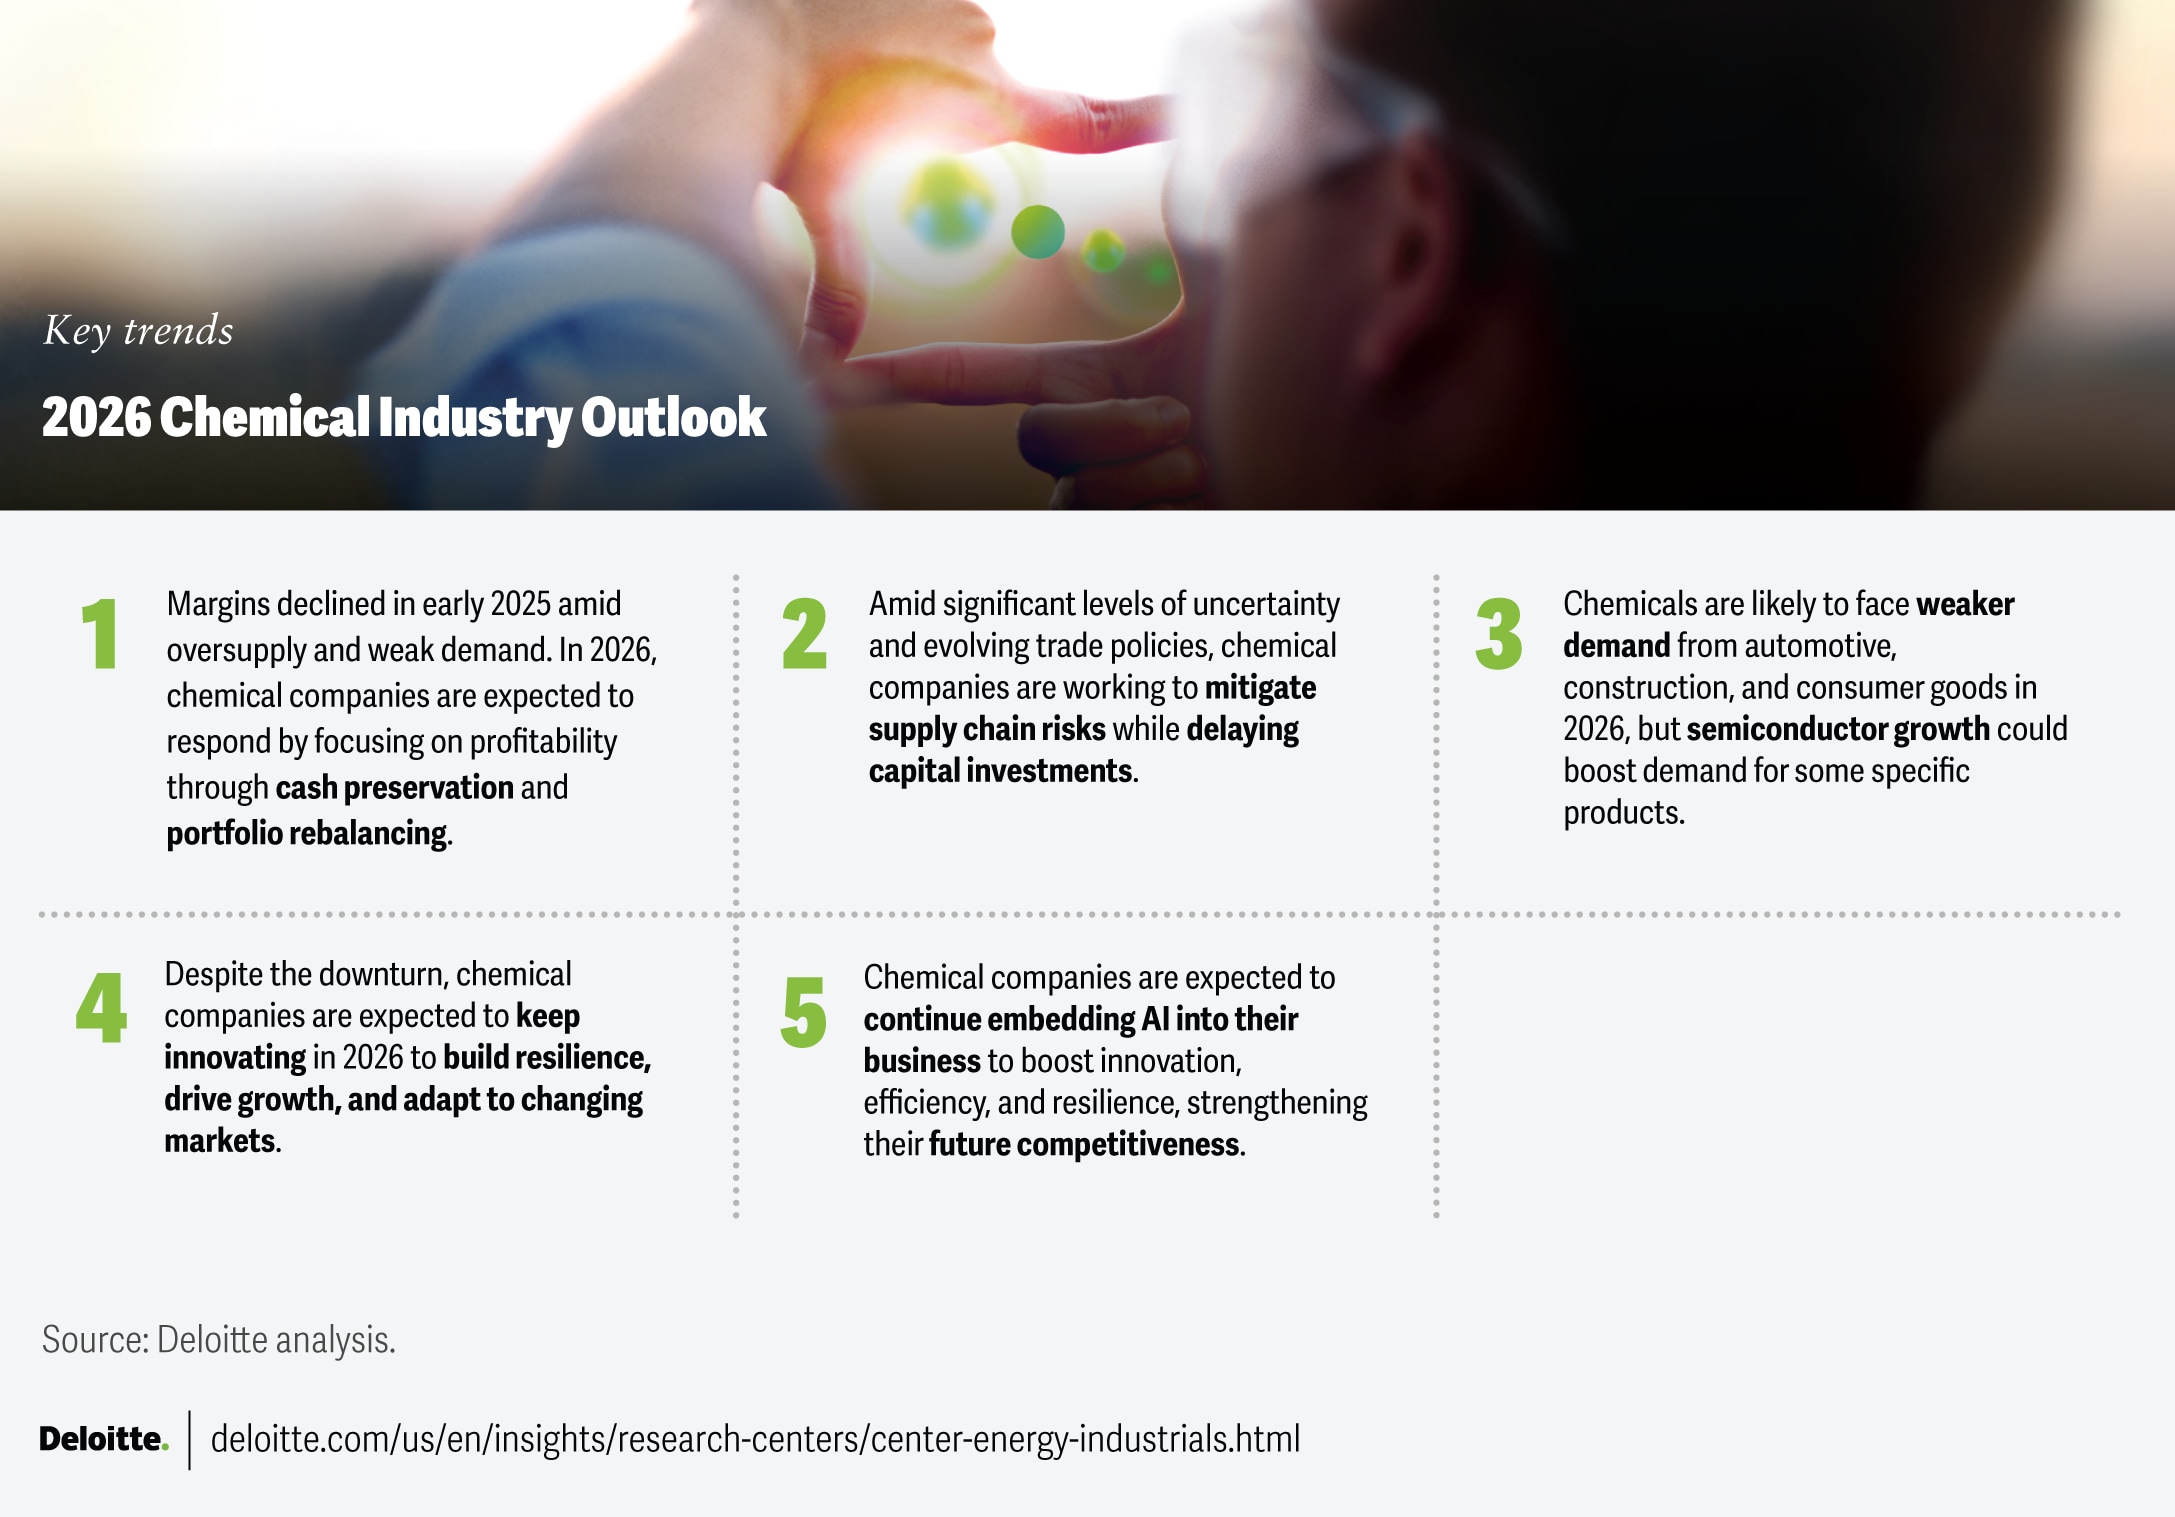
2026 Chemical Industry Outlook
As the chemical industry faces sluggish demand, overcapacity, and heightened uncertainty in 2026, many companies are focusing on profitability, resilience, and long-term transformation
At the beginning of 2025, the chemical industry anticipated a gradual recovery, with global chemical production projected to grow 3.5%.1 Instead, the industry entered a prolonged downcycle, with forecasts dropping to 1.9% for 2025 and 2% for 2026.2
Instead of stability, 2025 ushered in uncertainty and volatility, driven by three key factors.
- Weakened economic growth: Growth forecasts declined due to a combination of factors like elevated uncertainty, the shifting trade landscape, and geopolitical events.3 Global GDP forecasts fell to 3.0% in 2025 and 3.1% in 2026,4 with US growth slowing to 1.8% and 1.4%, respectively.5
- Geopolitical and trade tensions: Geopolitical tensions in Europe and the Middle East and ongoing trade tensions are likely reshaping supply chains, delaying investment decisions, and reducing trade volumes. In 2025, US chemical imports are projected to hit their lowest since 2020 and exports their lowest since 2021.6
- Policy shifts: The regulatory environment has become increasingly fragmented across geographies. In Europe, policymakers have scaled back elements of their sustainability agenda through an omnibus package.7 Meanwhile, in the United States, several key regulations are being altered or rescinded, reducing some regulatory requirements while also changing the economics of some planned projects.8
Table of contents
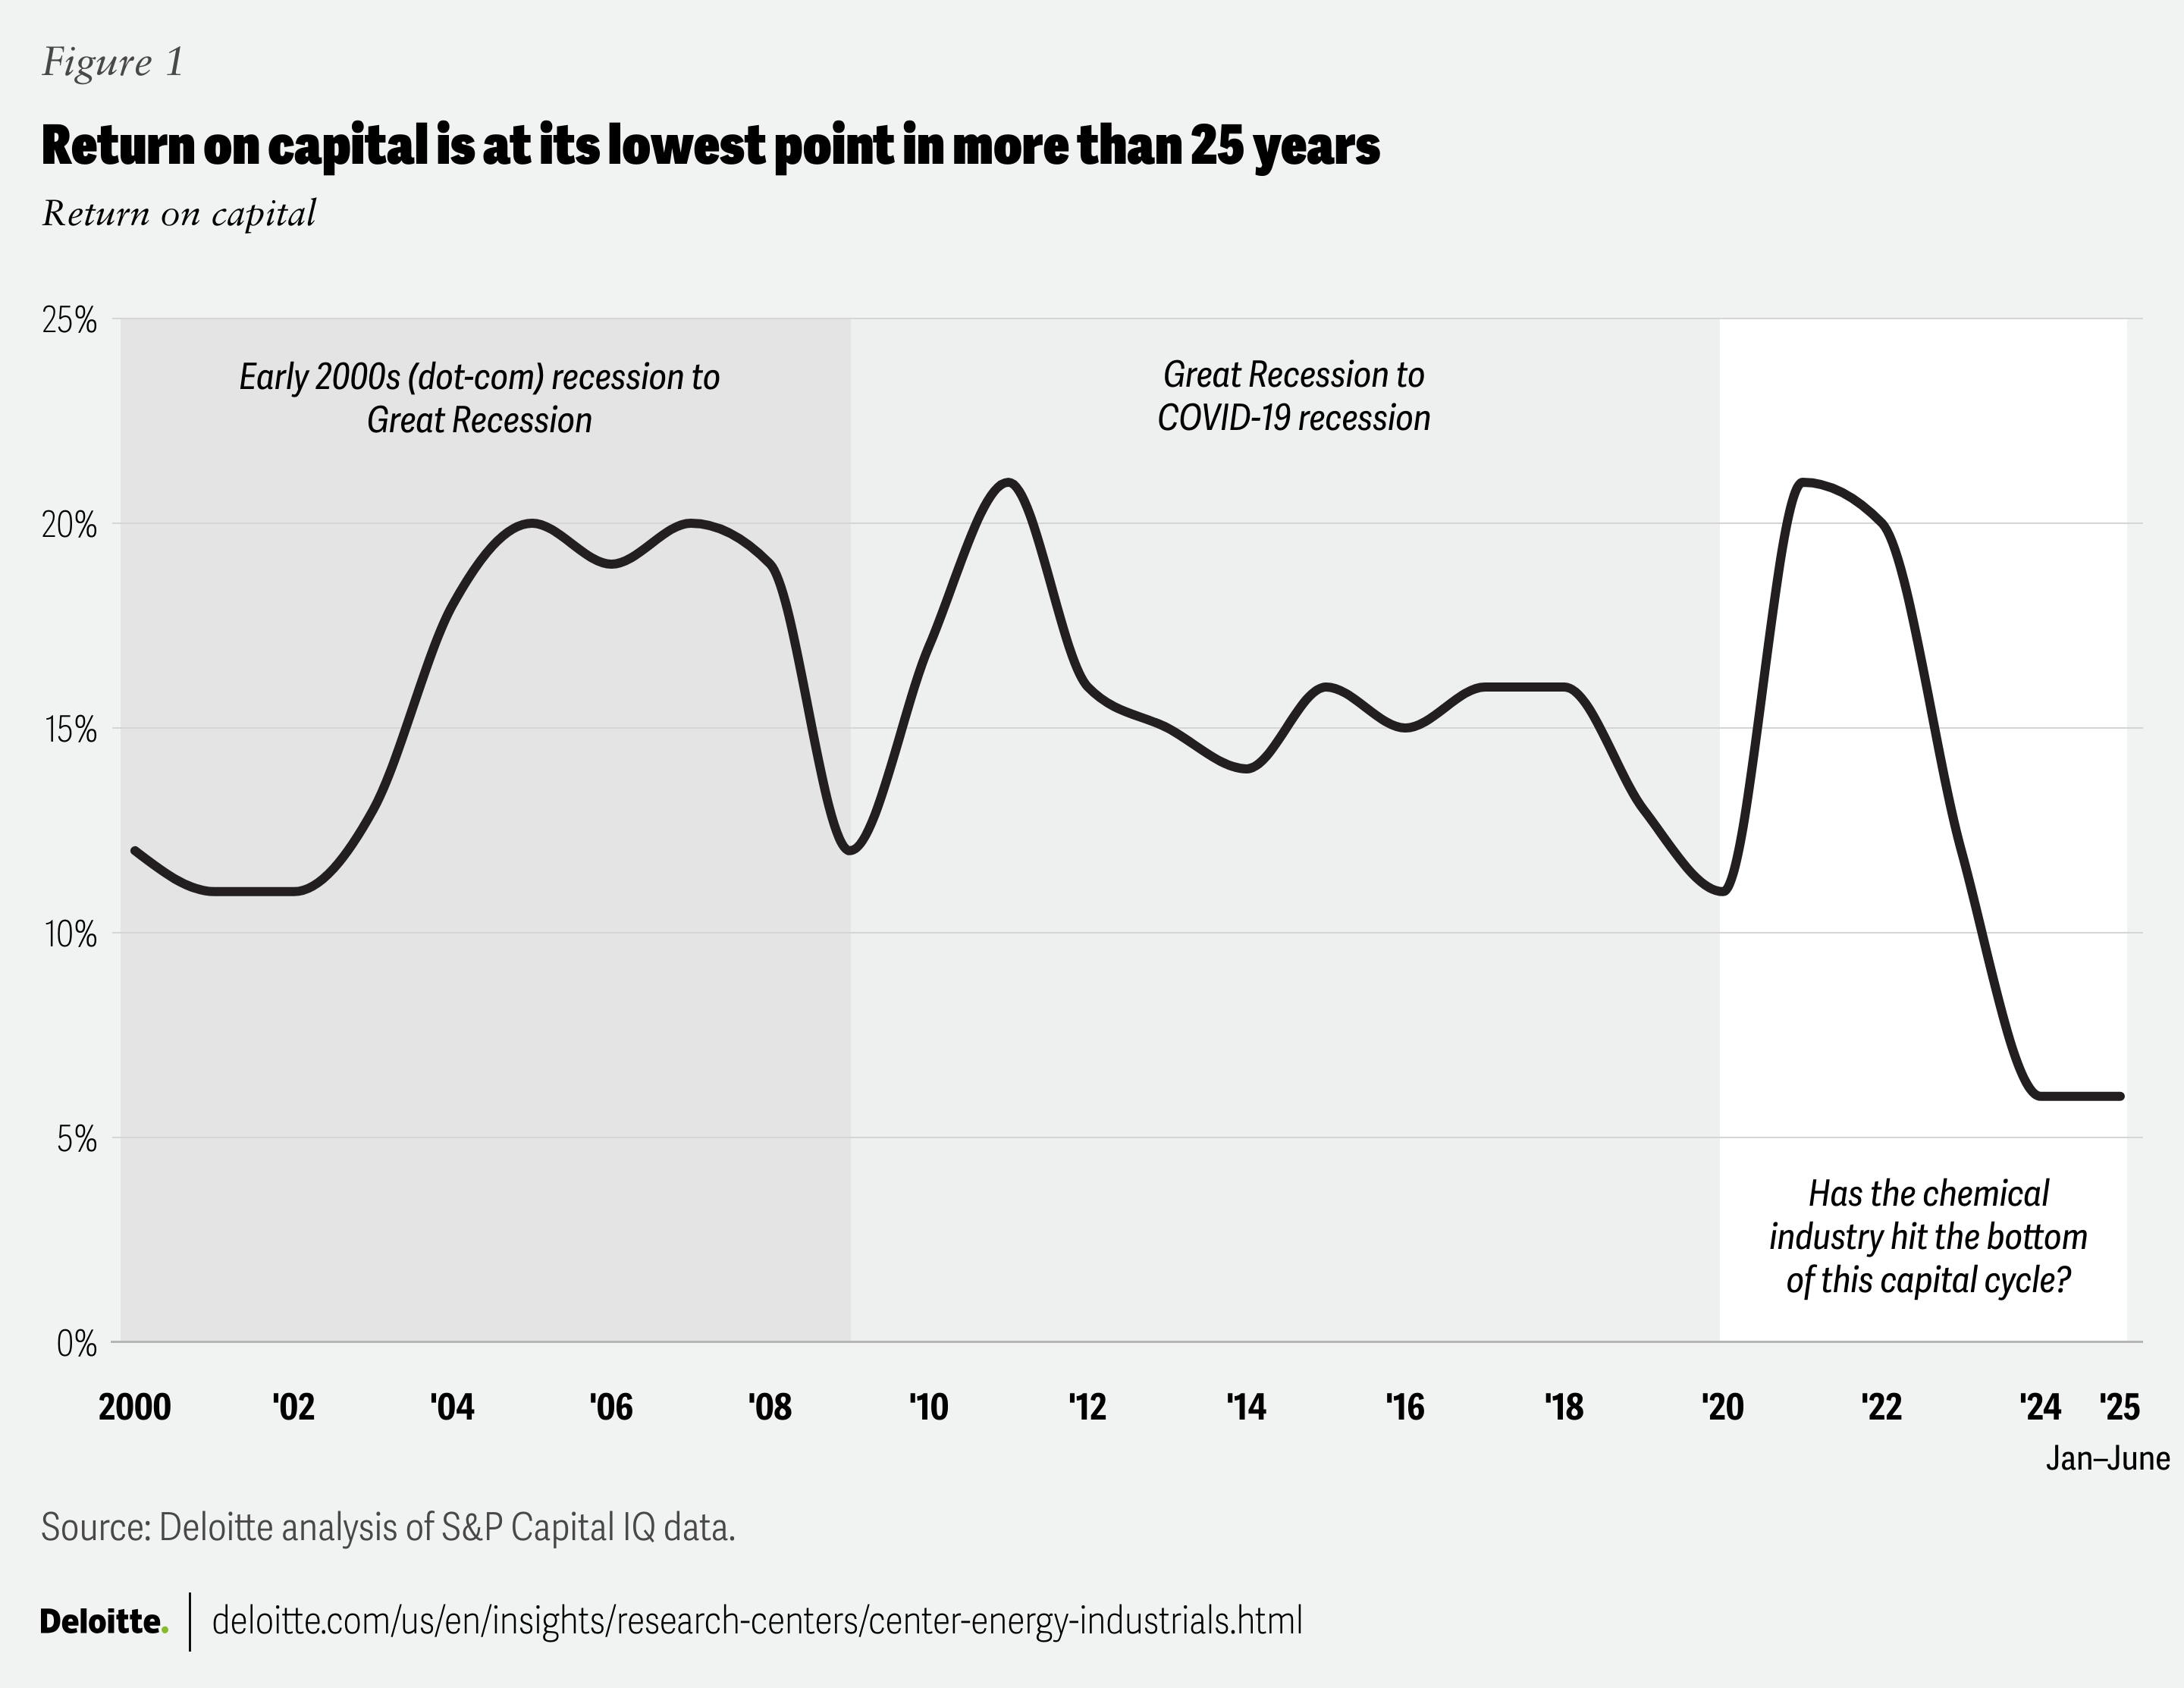
The outlook for 2026 is slightly weakened relative to 2025. US production volumes are expected to contract 0.2% in 2026, following two years of weak growth.9 Demand will likely remain uneven in key end markets, while persistent overcapacity in basic chemicals continues to pressure operating rates and profit margins. To navigate these challenges while positioning for success, chemical companies can consider aligning their strategies around five key trends.
- Profit prioritization: Preserving cash and restructuring portfolios
- Supply chain resilience: Navigating tariff shifts, trade tensions, and investment uncertainty
- End-market demand: Weathering cyclical declines with some bright spots
- Innovation: Leveraging R&D and digital models to maintain competitive advantage
- AI adoption: Scaling intelligent applications to boost efficiency and transform operations
1. Profit Prioritization: Preserving cash and restructuring portfolios
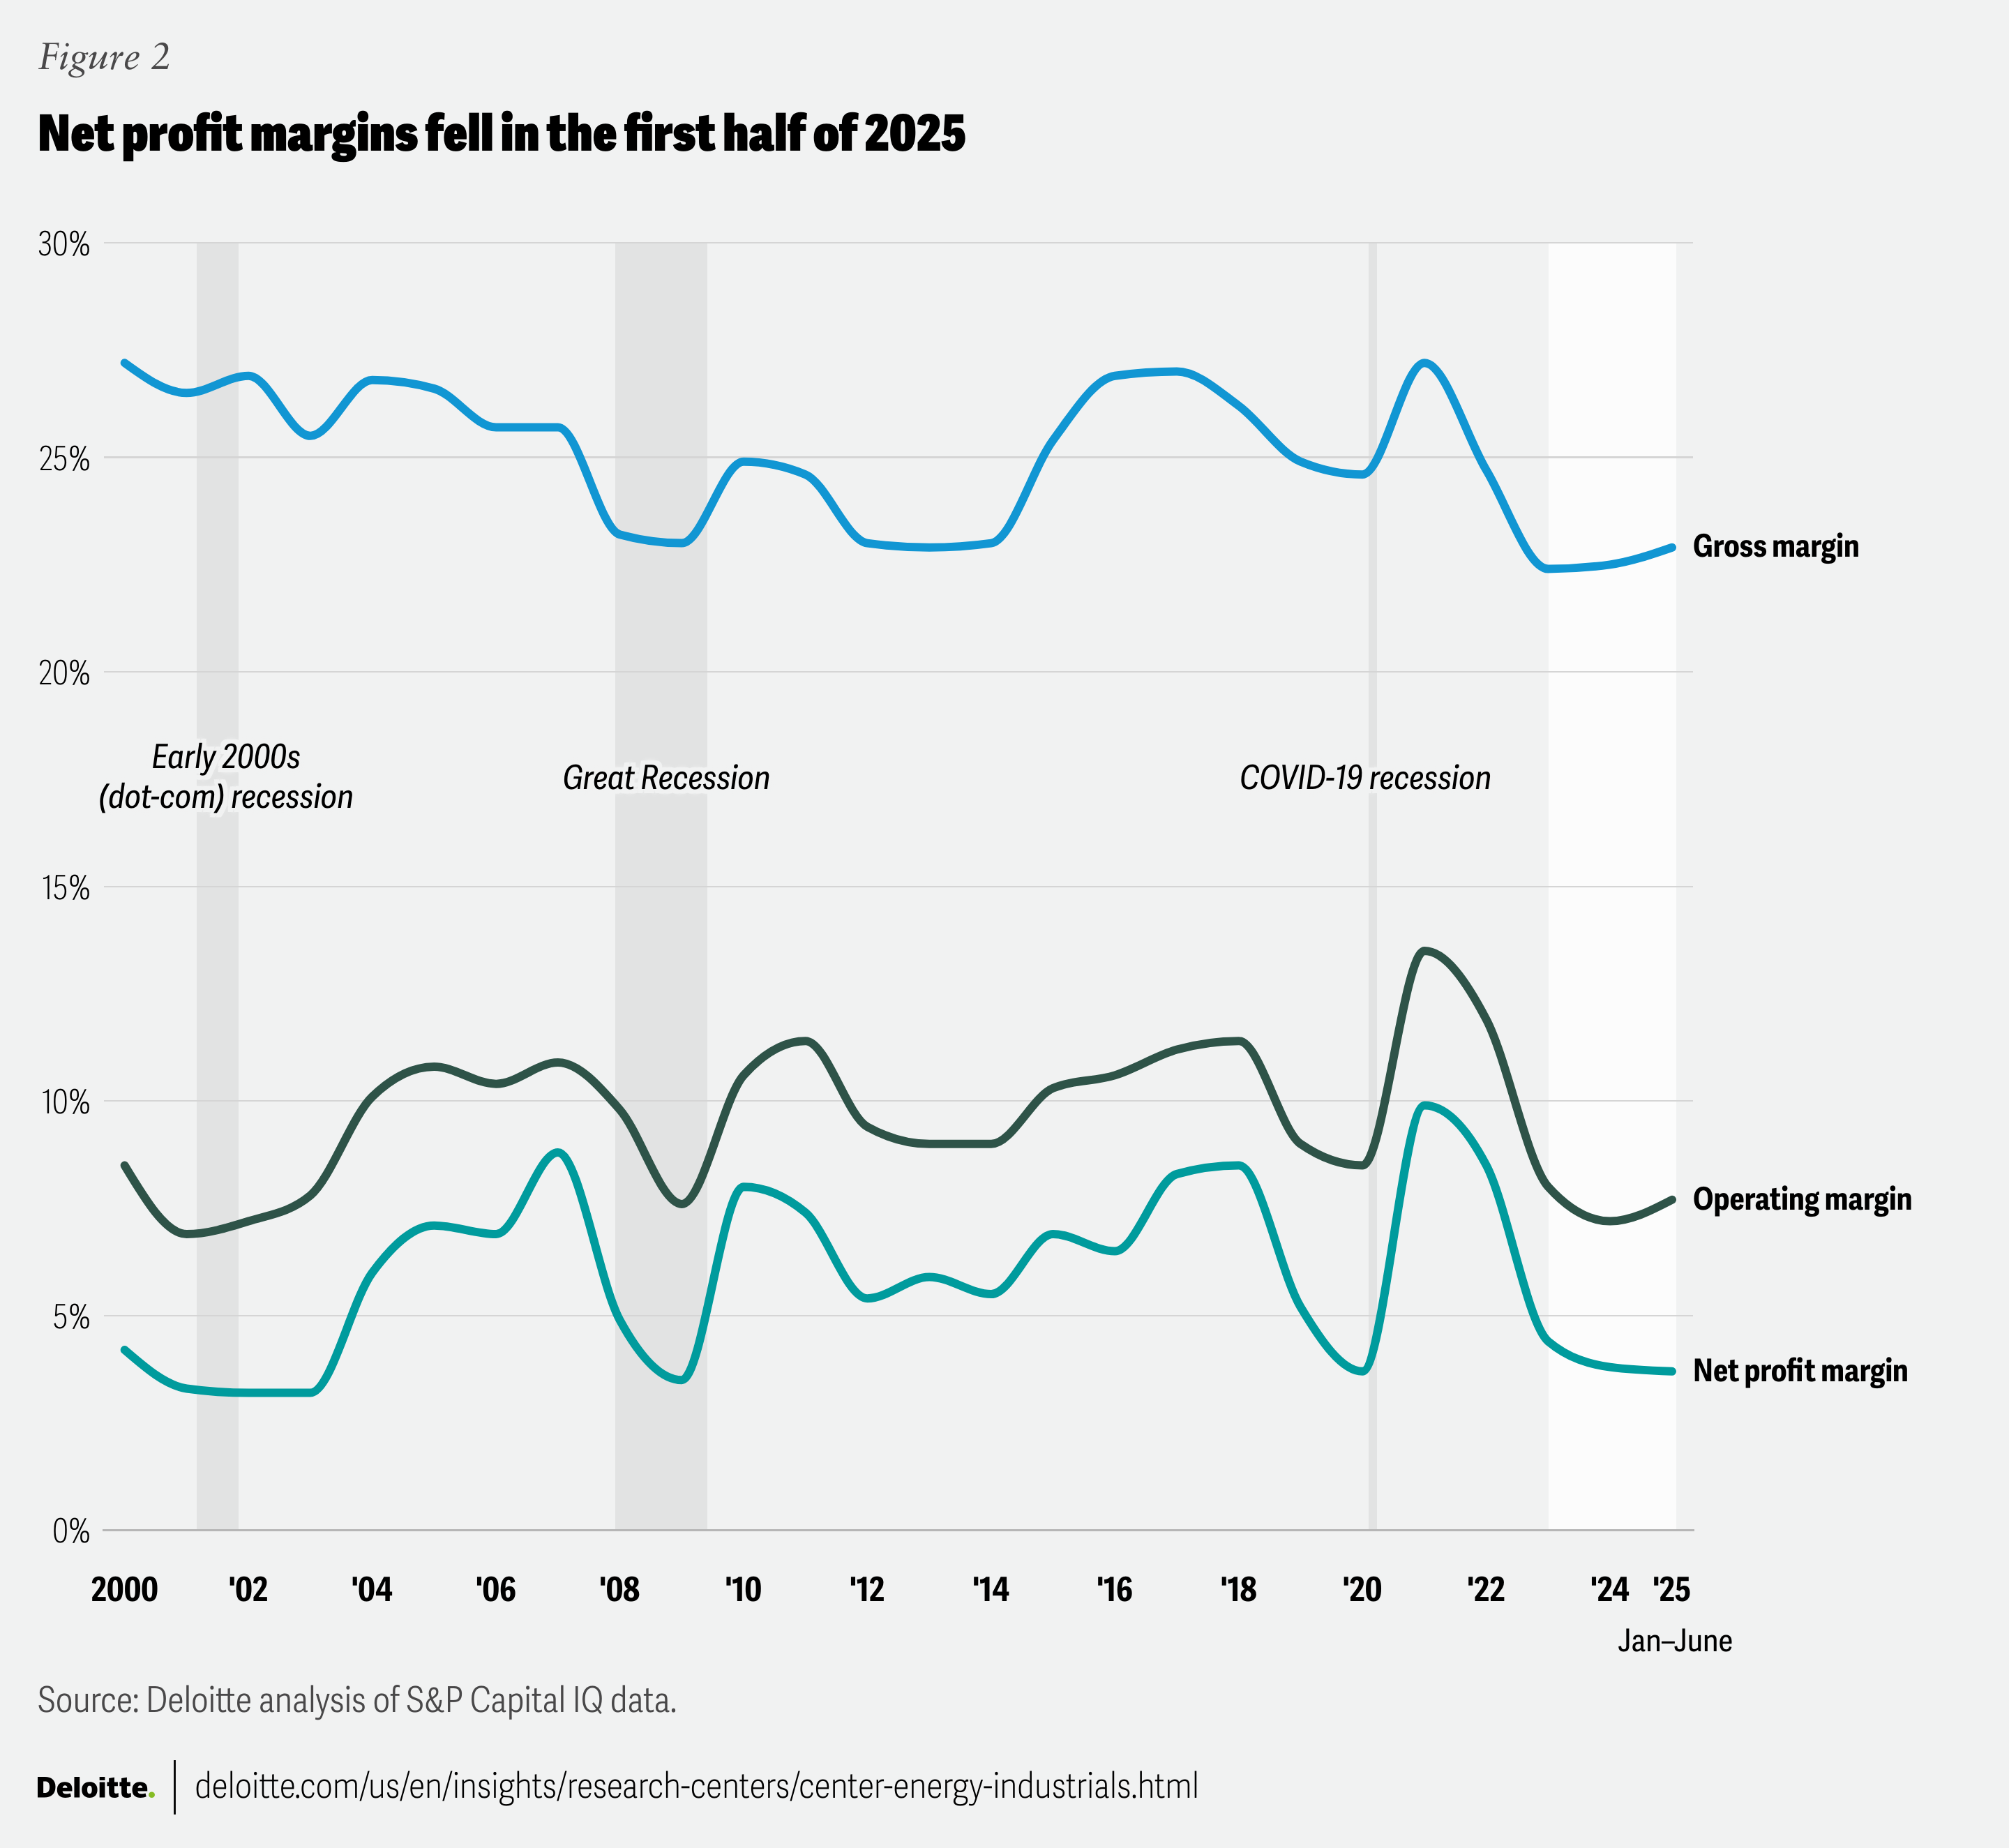
After averaging 5.8% between 2000 and 2020, net profit margins dropped sharply in 2023 and remained low in the first half of 2025 (figure 2).10 In response, chemical companies began deploying measures such as cost cuts, restructurings, closures, and divestments in 2023. To continue navigating these challenges in 2026, companies are expected to intensify their focus on cash generation and portfolio rebalancing in a more strategic and data-driven manner.
Preserving cash
In a downcycle, cash preservation can help companies maintain liquidity, ensure operational continuity, and instill confidence in investors. Free cash flow (FCF) rose slightly in 2024 but declined in the first half of 2025. We expect this figure to improve in 2026 as companies leverage technology and data to drive cash management measures.
For instance, operational expenditures remained flat in the first half of 2025 compared to 2024, but SG&A fell 2.3% amid cost-cutting measures, such as layoffs and delayed maintenance.11 Similarly, capital expenditures fell 8.4% year on year in 2024 and early earnings results indicate another drop in 2025.12 Continued efforts to improve operational efficiency, capex, and net working capital could lead to higher FCF in 2026.
Transforming portfolios
Companies are reassessing portfolios across assets, products, and geographies, rationalizing underperforming assets, and prioritizing high-cash-flow businesses.
Rationalizing commodity chemical assets: Global overcapacity in basic chemicals is growing. New ethylene and polyethylene plants are expected to start in 2026 in the United States and Qatar, where low-cost feedstocks are usually available. Similarly, China continues building polypropylene capacity, driven by self-sufficiency policies.13 Conversely, Europe and parts of Asia face cost disadvantages, resulting in lower plant utilizations and several announcements of plant closures and divestments.14 Some newer plants are being designed to rely on US ethane rather than naphtha to stay competitive.15 However, with weak demand recovery and new capacity coming online, further shutdowns are likely.
Focus on specialty chemicals: Many specialty chemicals, however, are demonstrating higher margins for their tailored products. Specialty chemicals tend to be less commoditized and avoid the hyper-competitiveness of the commodity chemicals markets. As a result, several companies have announced intentions to shift their portfolios from basic petrochemicals to specialty chemicals or expand into adjacent specialty chemicals to capture higher margins.16
Preparing for mergers and acquisitions: With thin margins and oversupply, the current market lacks both buyers and attractive assets. Only 243 deals were made in the first half of 2025, the lowest for any half since pre-COVID.17 While significant growth through M&A is unlikely until stability returns, portfolio reevaluations could drive a wave of consolidation after 2026.
2. Supply chain resilience: Navigating tariff shifts, trade tensions, and investment uncertainty
The chemical industry has long adapted its supply chains to demand fluctuations, regulatory changes, and energy price volatility by managing risks, building in flexibility, and enhancing resilience. Companies are expected to continue implementing these measures to respond to current uncertainties.
In April 2025, the Global Economic Policy Uncertainty Index reached a record high, following the April 2 reciprocal tariffs announcement,18 leaving companies uncertain about supply chain impacts. While new trade agreements and related trade announcements have since provided some clarity, ongoing uncertainty could stall some investment in 2026.
Adjusting to new tariffs
The United States is both a major importer and exporter of chemicals, leaving the sector highly sensitive to tariff shifts. However, the level of exposure varies widely by supply chain structure, prompting companies to respond in different ways.
- Operational adjustments: Tax and supply chain teams are managing tariff shifts by rerouting product flows, adjusting transfer pricing, and pursuing duty-drawback credits. Companies are expected to augment these strategies through 2026 with digital tools to optimize supply chains in line with the latest trade policies.
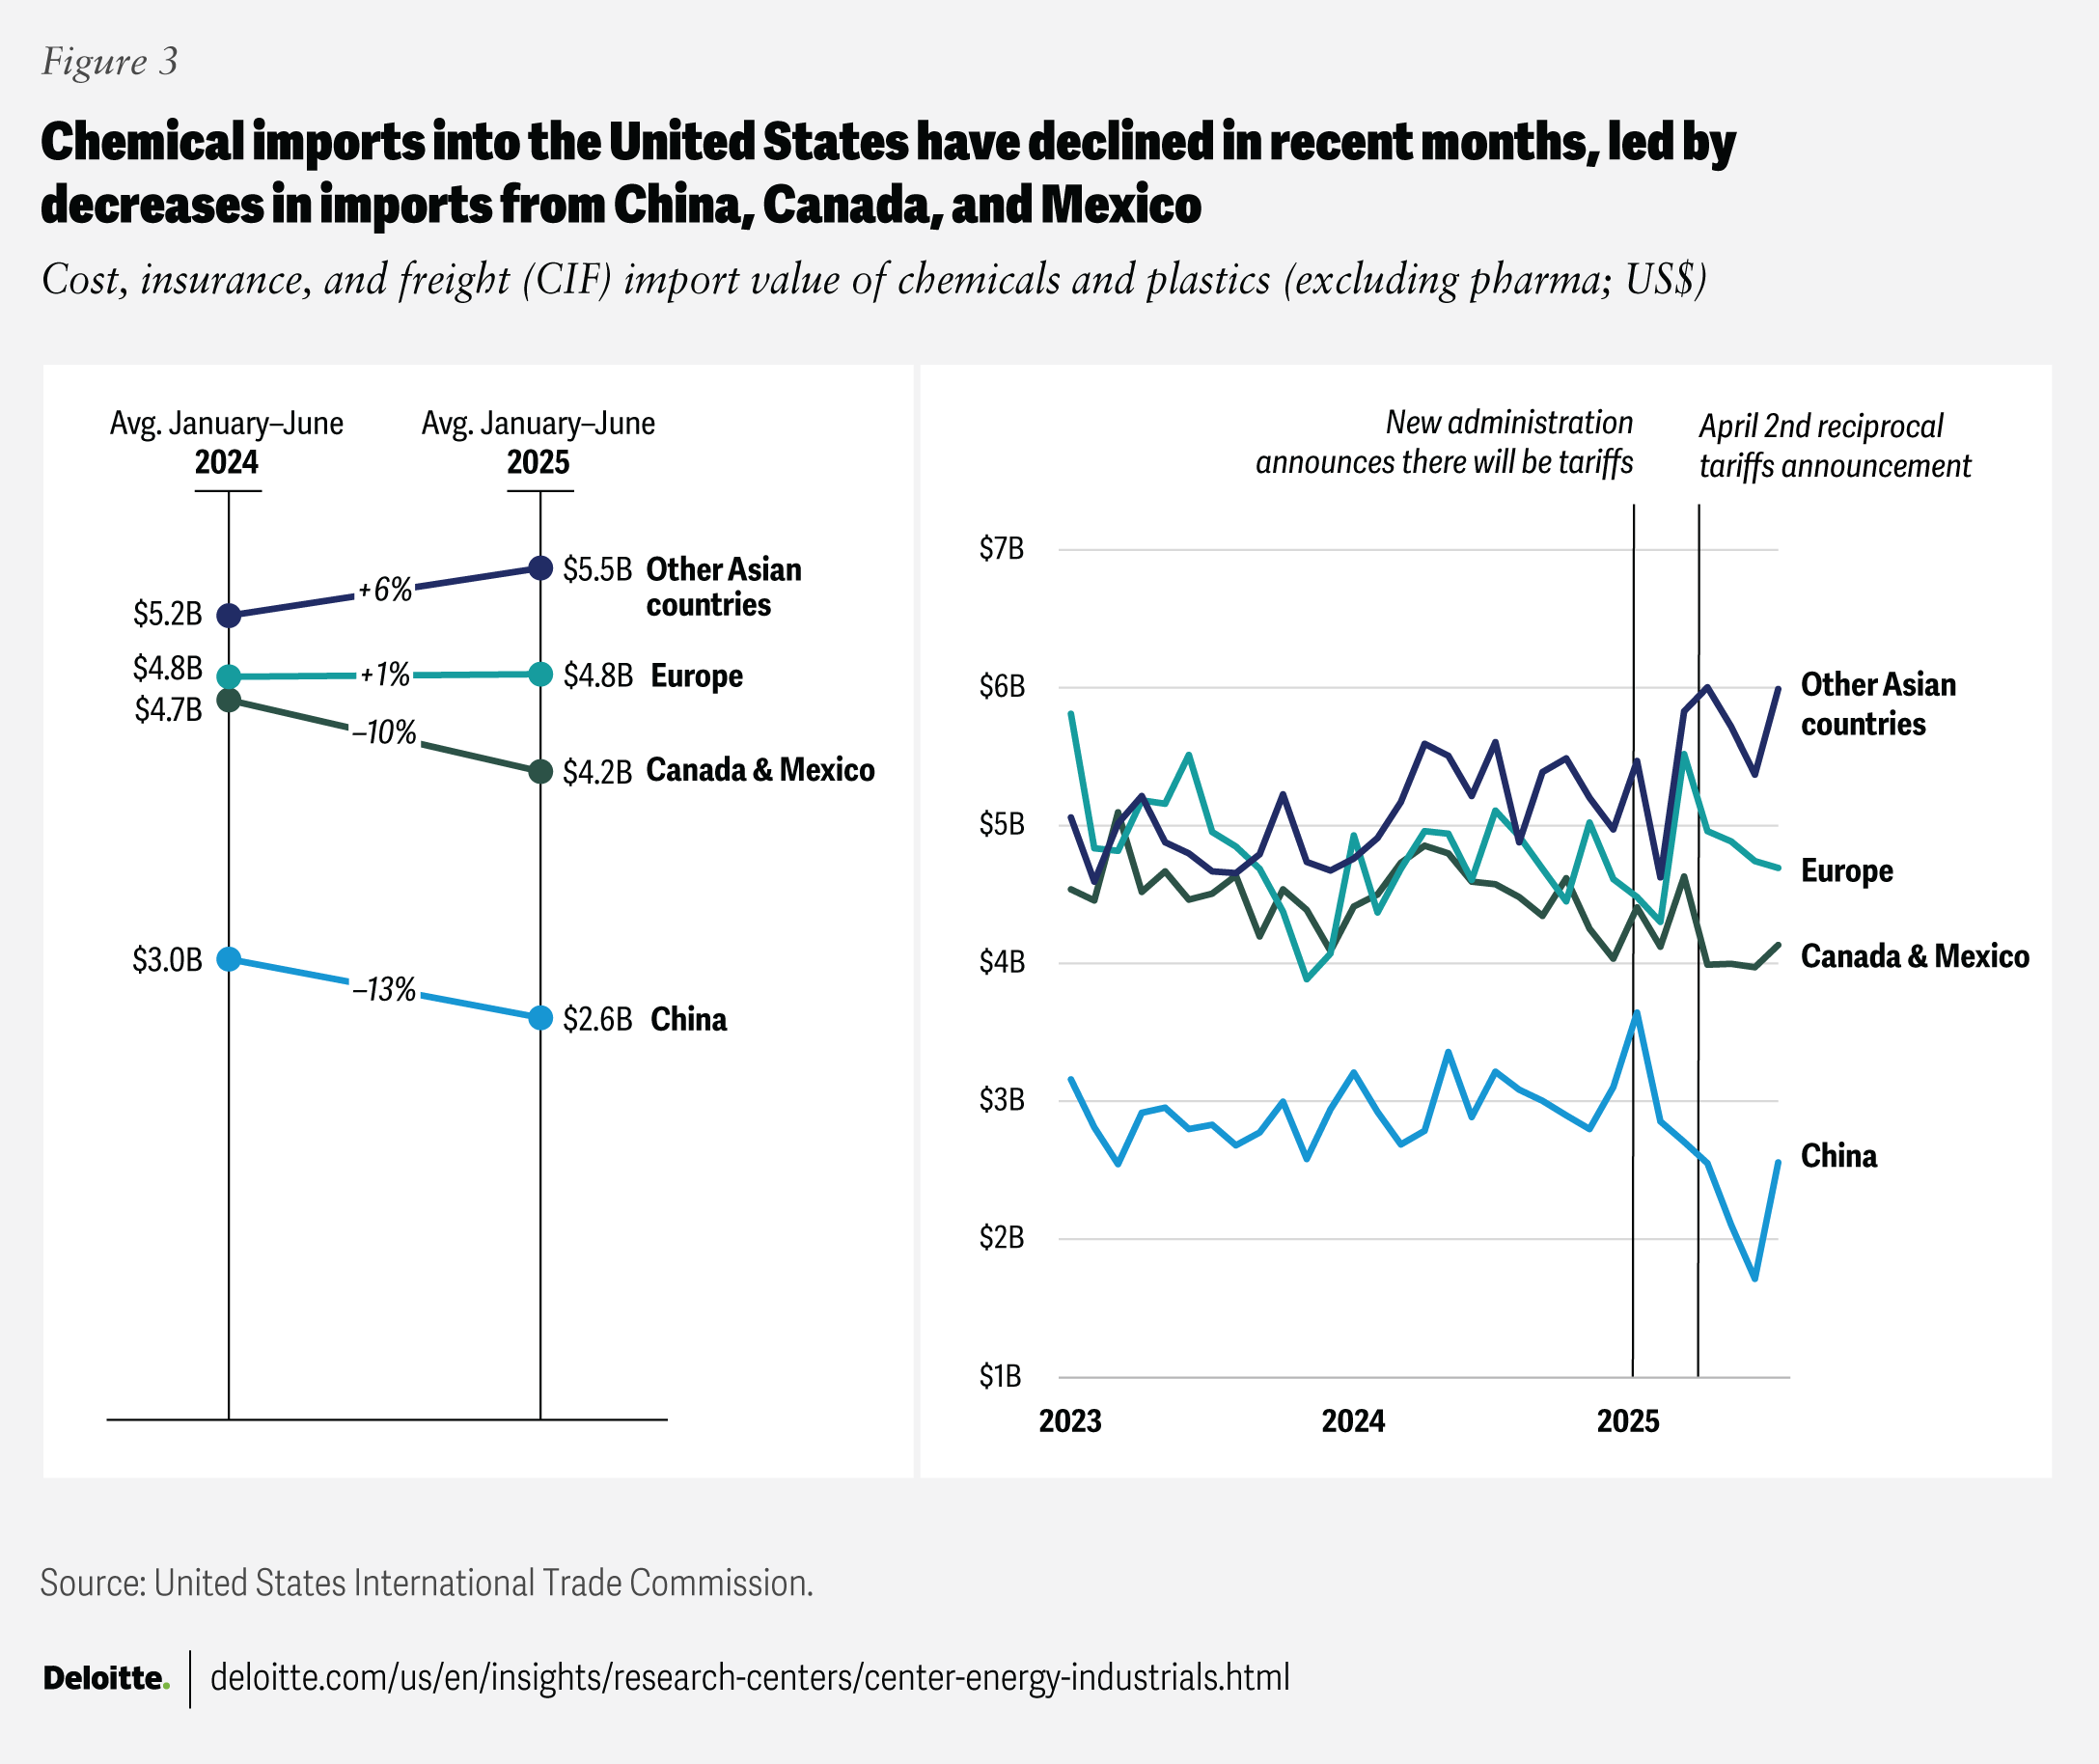
- Inventory boost: In early 2025, many importers front-loaded orders, resulting in higher inventories and reduced demand in subsequent months (figure 3). US chemical imports spiked to over US$20 billion in March 2025, the highest in over three years, before dropping to US$17 billion in April.19 Similar inventory strategies may be implemented again if new tariffs are announced.
- Supply chain reshuffling: US chemical imports fell 8% year on year in the second quarter of 2025, with those from China dropping nearly 30% (figure 3).20 For certain products, such as resins, fibers, and basic chemicals, some Southeast Asian countries emerged to fill the gap. However, as tariff policies continue to evolve, supply chains are expected to continue being reshuffled in 2026.
Besides tariffs, other factors impacting supply chains and regional competitiveness include:
- Regional regulations: The European Union’s Corporate Sustainability Reporting Directive and the Carbon Border Adjustment Mechanism would require more companies to disclose sustainability risks and opportunities and pay a carbon price on high-emission imports, respectively. These regulations have been simplified and eased from their original form and, while not yet final, are expected to affect chemical company portfolios and supply chains.
- External pressures: Geopolitical tensions, climate-related disruptions, and energy and feedstock price volatility continue to impact supply chains. For example, Red Sea tensions have led to rerouting, adding 8 to 12 days to Gulf-Asia voyages.21 Similarly, higher natural gas prices in Europe and lower ethane prices in the United States are influencing regional investment decisions.
3. End-market demand: Weathering cyclical declines with some bright spots
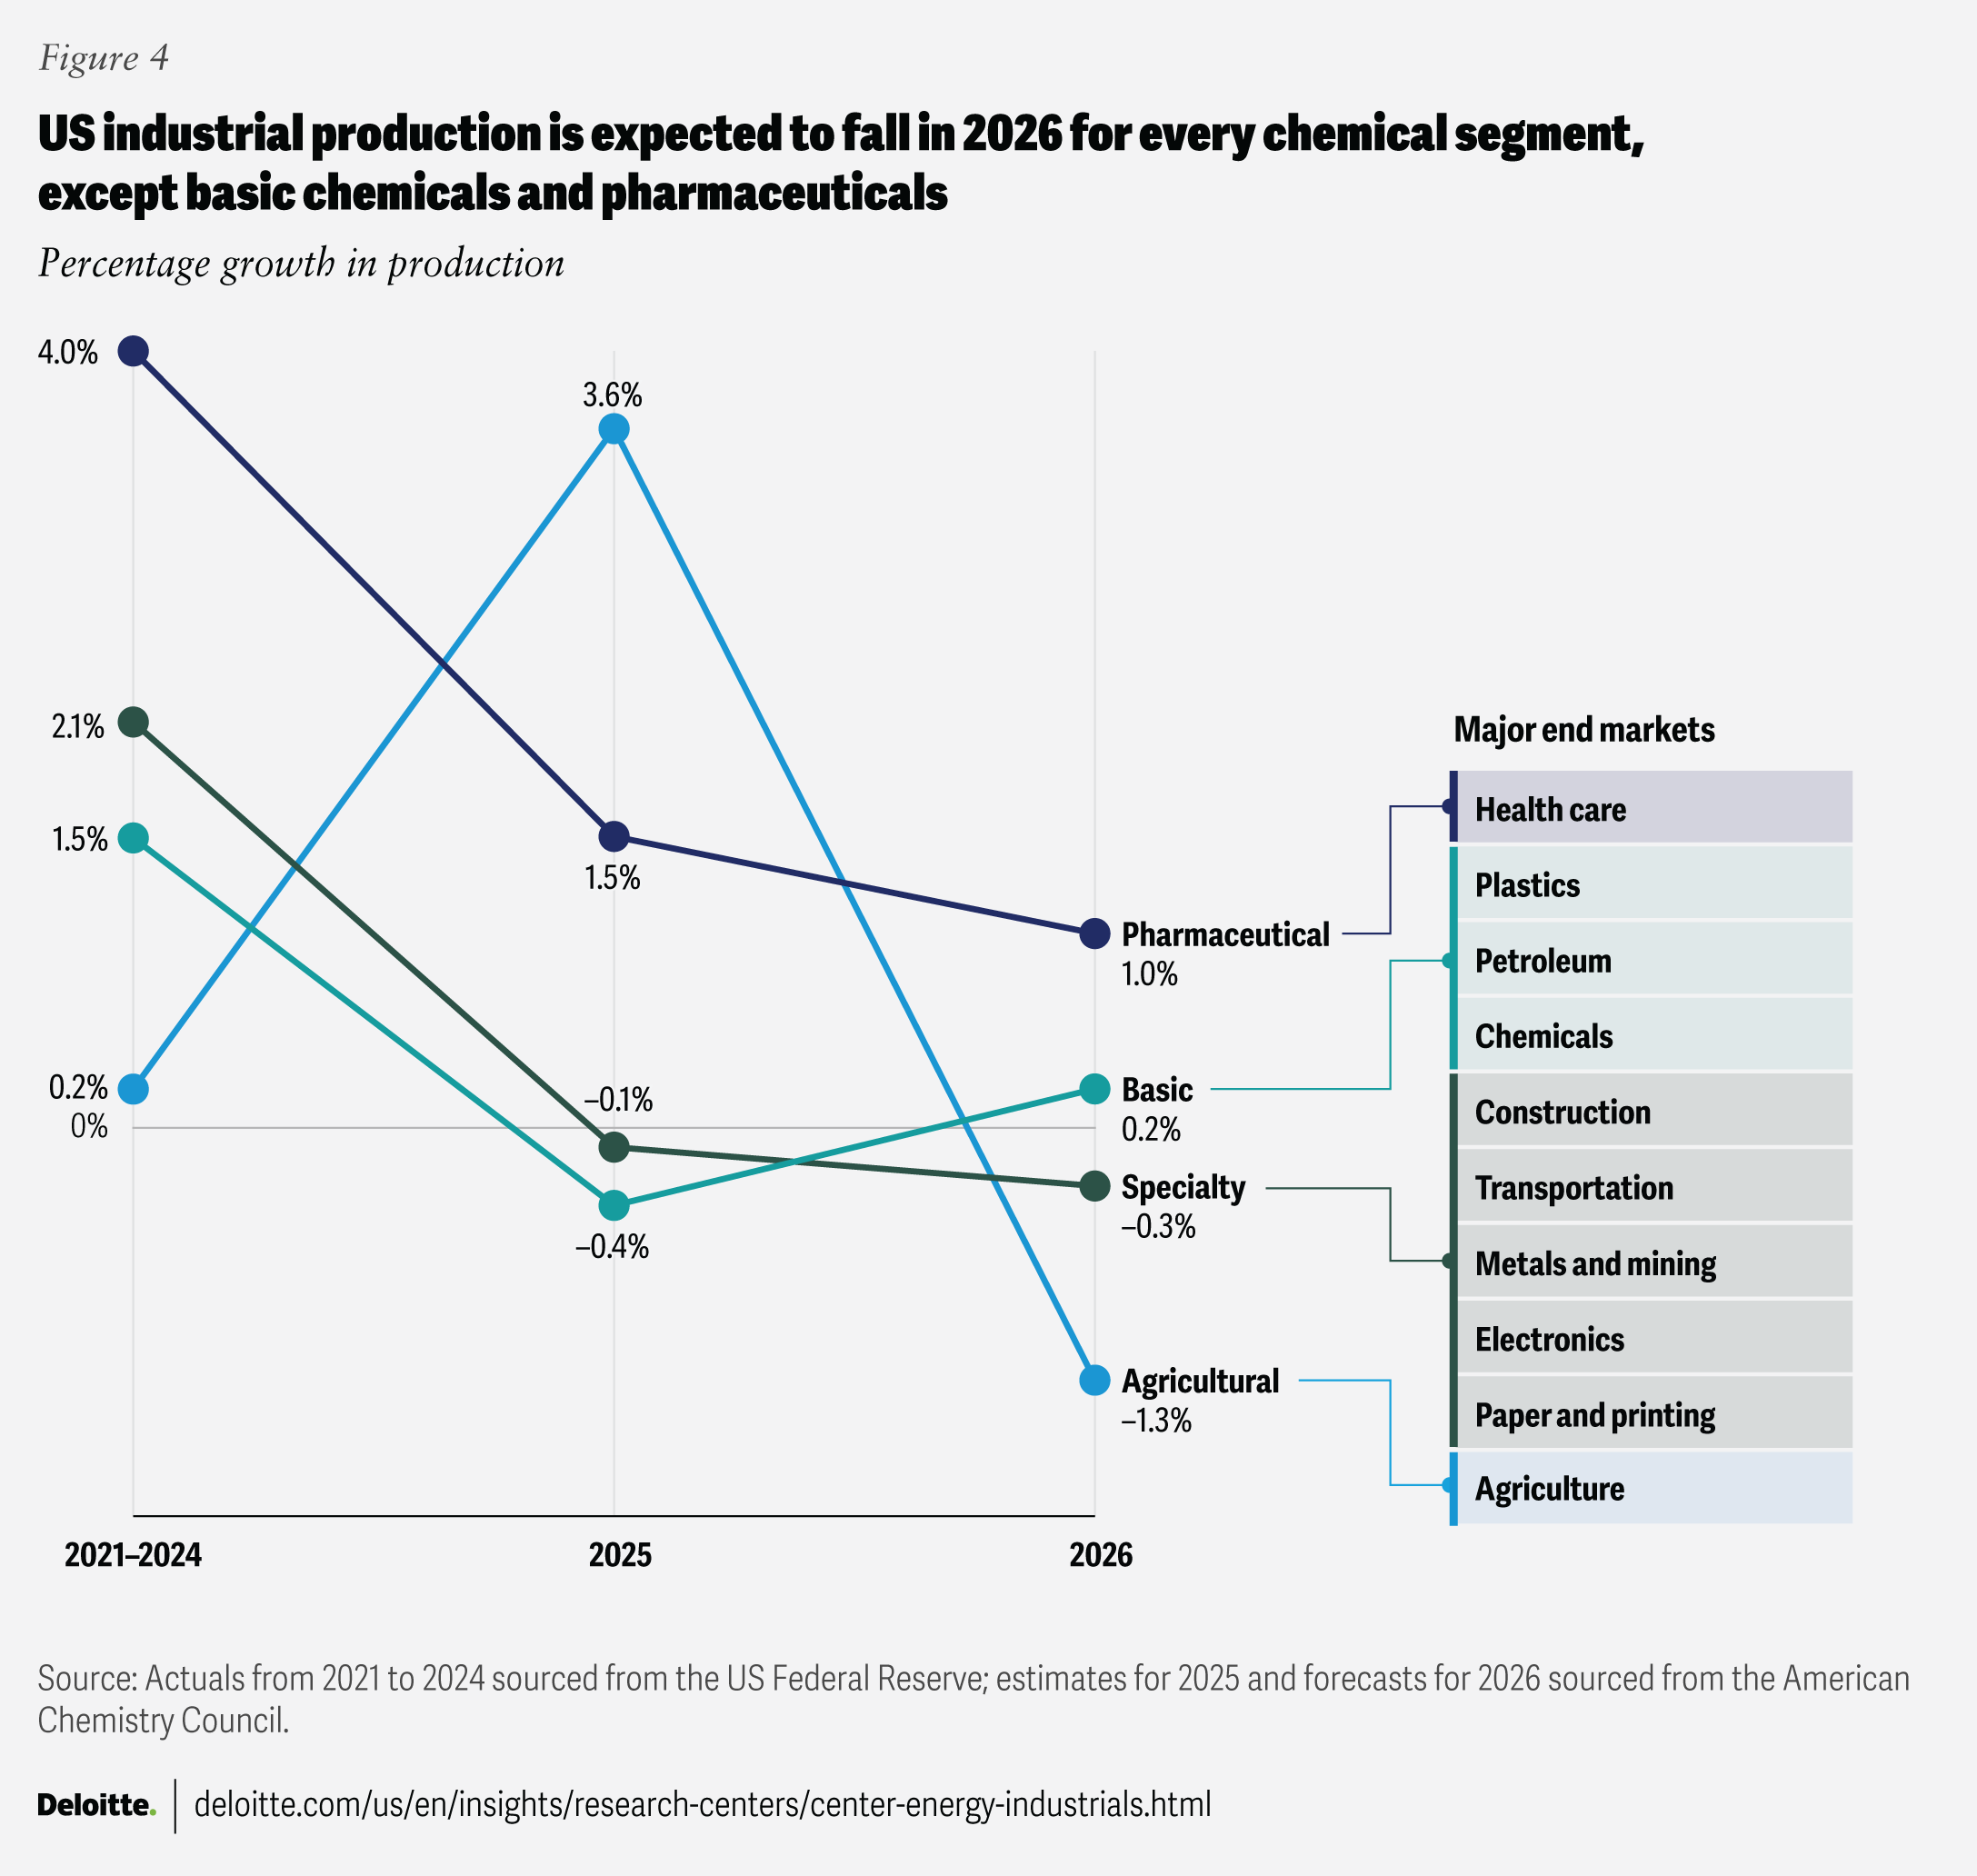
The chemical industry is diverse, with each company offering a unique product portfolio with various applications that serve multiple end markets. Thus, some companies are more exposed than others to the current weak-demand environment (figure 4). In 2026, chemical demand is expected to remain soft because of potential downcycles in several key end markets, including construction, automotive, and consumer goods. But semiconductor markets could provide opportunities for growth.
Cyclical industries are downcycling
More than 80% of basic and specialty chemical demand comes from the industrial sector.22 While US industrial production is up year on year in 2025, consumer sentiment remains weak. The Institute of Supply Management Manufacturing Purchasing Managers Index has fluctuated between 45 and 51 between January 2023 and August 2025, with values below 50 indicating contraction.23
- Consumer spending: Consumer spending is projected to grow just 1.4% in 2026, down from an anticipated 2.1% in 2025, driving more value-conscious shopping.24 This could affect demand for chemicals such as surfactants (personal care items), plastics and other polymers (packaging), and preservatives (food and cosmetics).
- Automotive: Light-vehicle sales are projected to remain relatively flat, with forecasts ranging from slight growth to slight contraction, as the impacts of tariffs remain uncertain.25 A dip in sales could impact chemicals like polyurethane, polypropylene, ethylene glycol, and epoxy resins. The expiration of federal electric vehicle incentives in September 2025 could further reduce chemical demand as EVs use more chemicals than traditional internal combustion engine vehicles.26
- Construction: After four consecutive years of decline, housing starts are forecasted to rise by just 0.3% in 2026.27 High interest rates and building costs continue to pressure demand, which has knock-on effects for concrete admixtures, sealants, epoxy resins, and other protective coatings.28
Semiconductors may expand as data center demand grows
While growth in some sectors is softening, the semiconductor industry remains a bright spot, fueled by AI-driven data center growth. The global semiconductor market is projected to grow 11.2% in 2025 and 8.5% in 2026, surpassing US$760 billion,29 and is on track to reach US$1 trillion by 2030, with artificial intelligence chips making up almost half the market by 2028.30
Chemicals make up 9% to 14% of the bill of materials for electronic devices, prompting chemical companies to invest in production capacity.31 Since March 2025, several global suppliers have announced multimillion-dollar greenfield investments in products such as ultra-pure gases and solvents to support next-gen chip fabs in the United States and Europe, support reshoring of chip manufacturing, and diversify supply chains.32
4. Innovation: Leveraging R&D and digital models to maintain competitive advantage
Despite the downcycle, chemical companies are expected to continue innovating products, processes, and business models. Innovation is vital during such periods to drive growth, build resilience, and gain a competitive edge. It enables differentiation, entry into new markets, and responsiveness to evolving customer needs.
Areas of innovation
- Operating model: As end markets and digital technologies evolve, some companies may benefit from redesigning how they deliver value. This requires reassessing how the company organizes talent, processes, technology, governance, and partnerships.
- Product: Commoditization has reduced margins for many chemicals, but specialized products can offer opportunities for tailored solutions. Companies can look beyond incremental changes and develop transformative products that address unmet needs.
- Process: Reevaluating commercial and operational processes allows companies to maximize resources and improve efficiency. Technology advancements can improve efficiency, reduce waste, and lower energy consumption.
- Sales and marketing: Customers increasingly expect advanced, value-driven experiences. Companies can leverage data-driven insights and AI to enhance sales strategies and deliver more personalized solutions.
5. AI adoption: Scaling intelligent applications to boost efficiency and transform operations
AI adoption is accelerating and is expected to continue through 2026, despite budget constraints. Already, 51% of US manufacturers use AI in daily operations, and 80% say it’s essential to grow or maintain their business by 2030.33 Today, AI applications are being adopted to increase efficiency and reduce costs, but over time, they could transform the industry.
AI adoption approaches
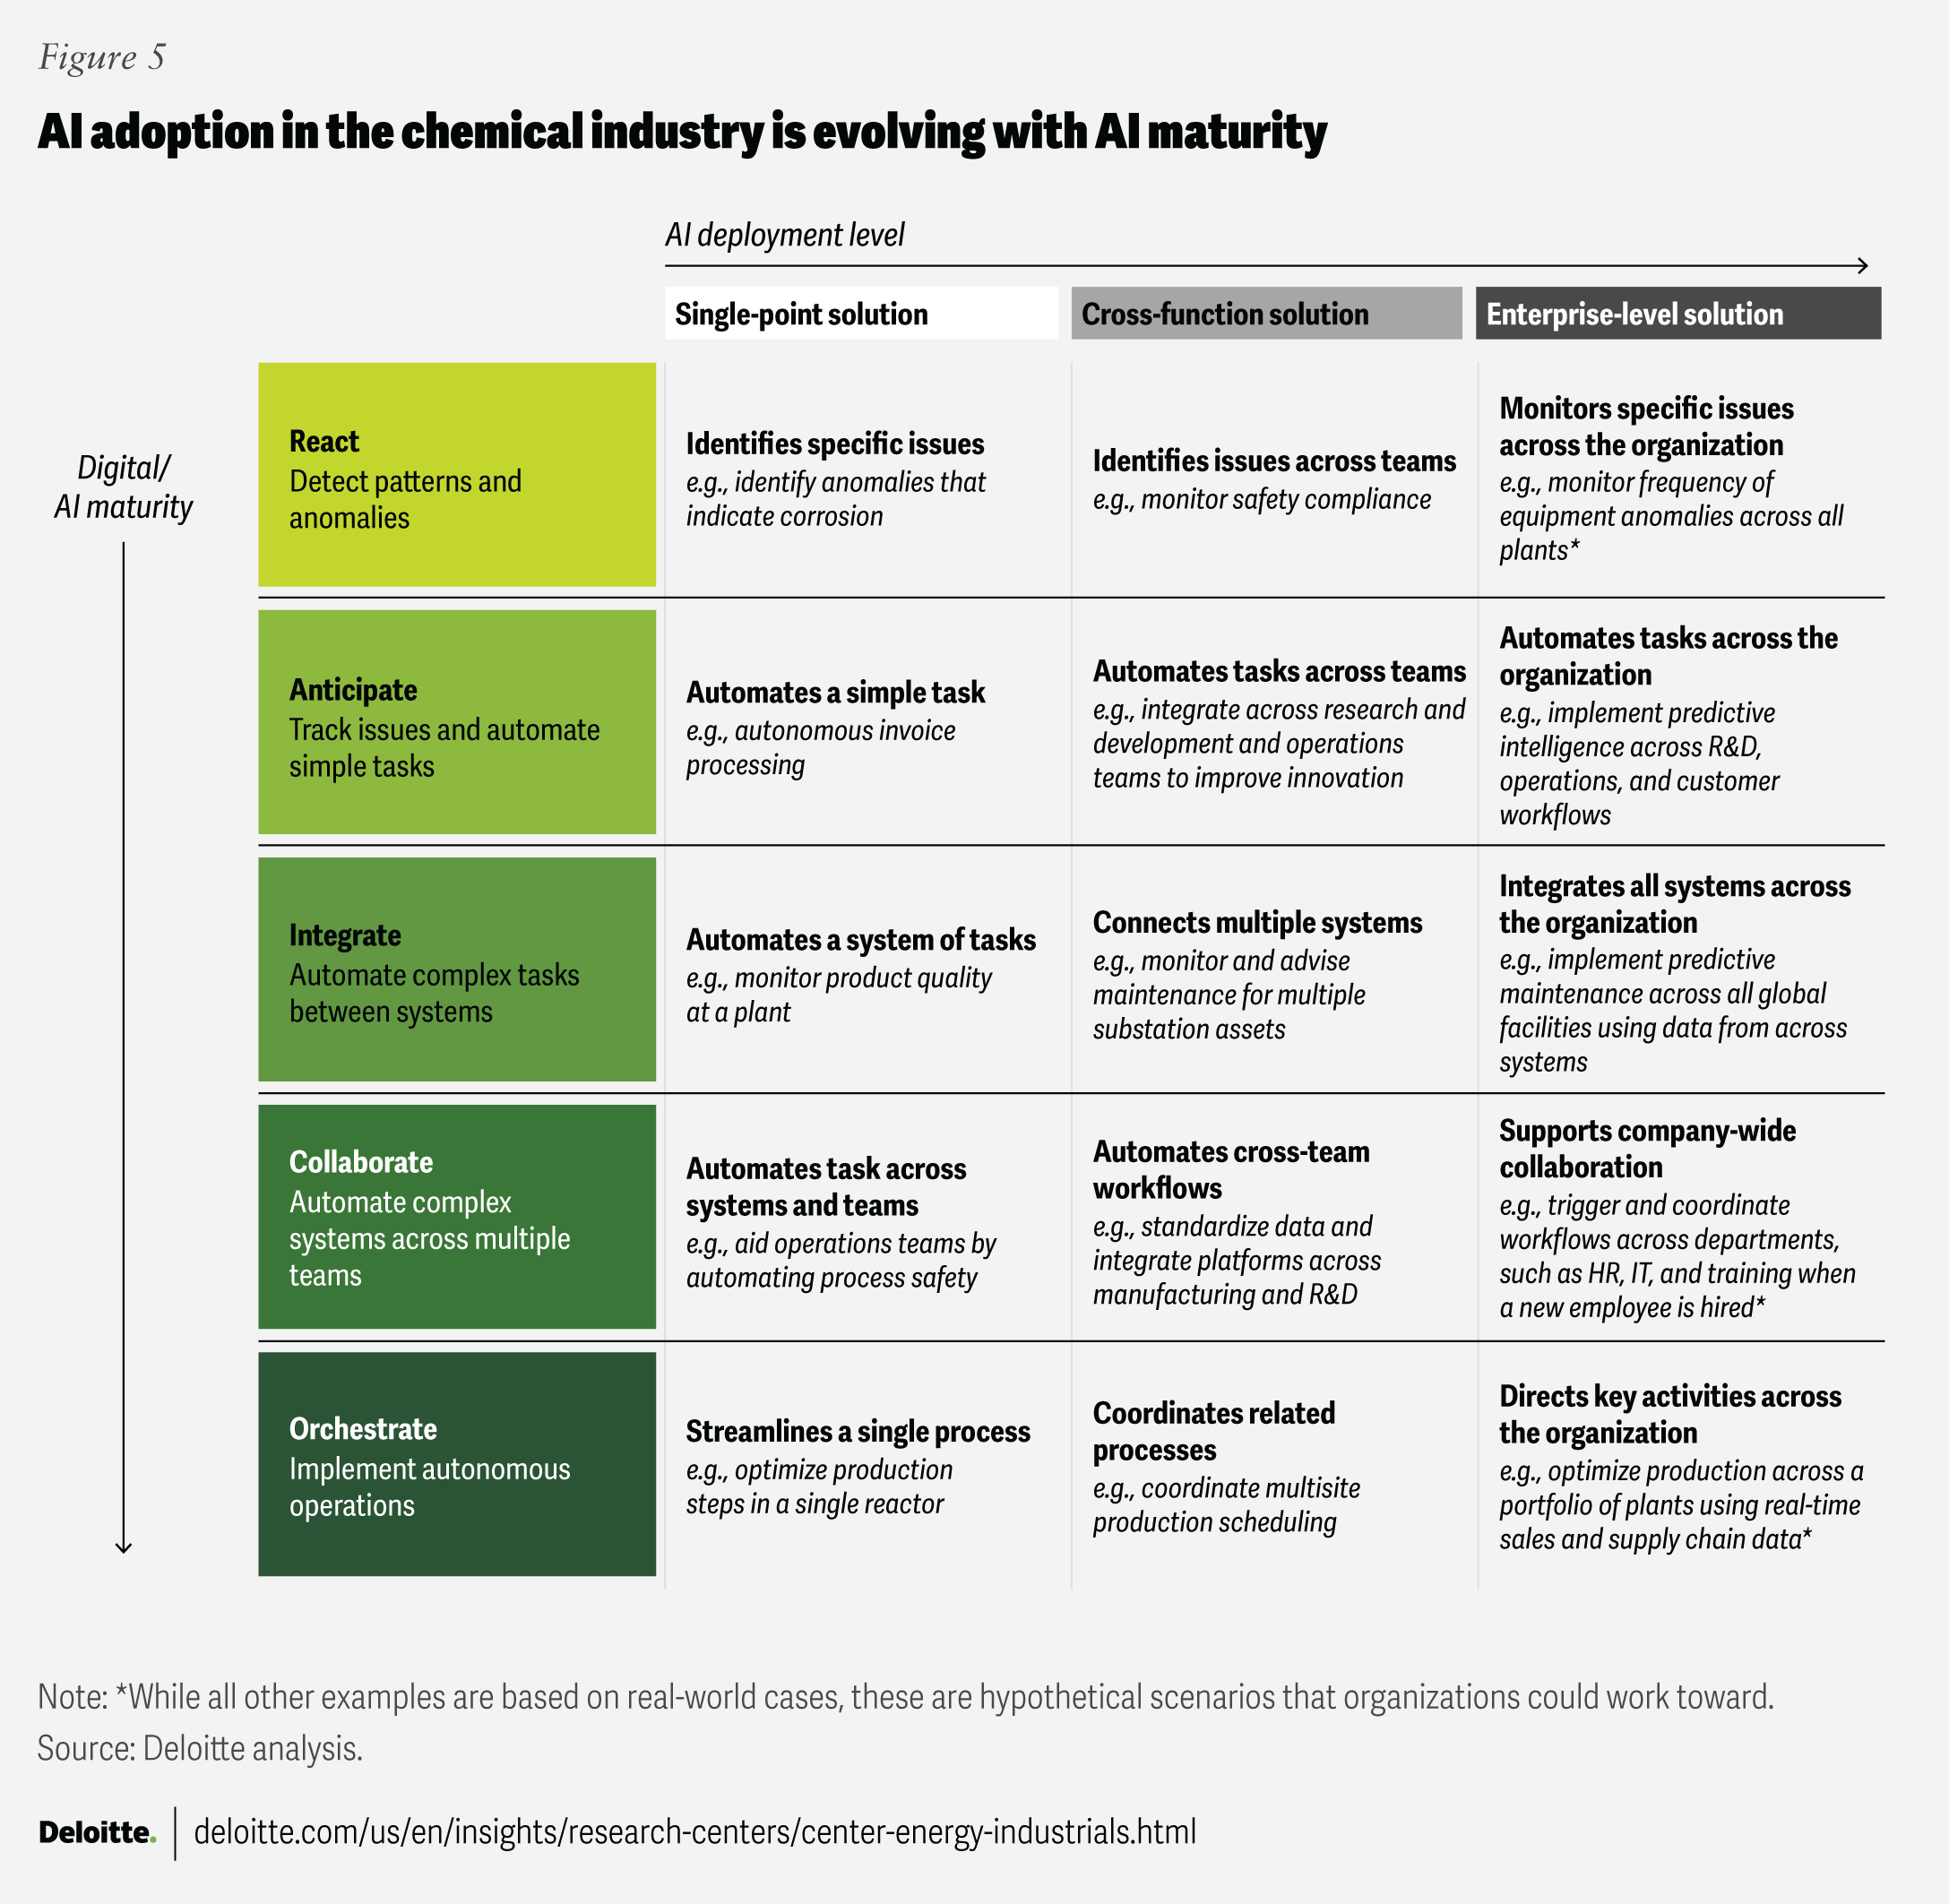
AI has been evolving (from large language models to agentic agents and beyond) and so has AI adoption across companies. Adoption can be viewed in two dimensions: the complexity of the use case and the breadth of its deployment (figure 5). The pace at which companies move from reactive, single-point solutions to autonomous operations across the enterprise will depend on several factors, including business strategy, organizational readiness, resource availability, risk appetite, and expected ROI.
Early adopters are benefiting
While initial efforts focused on back-office applications, optimal efficiency gains and ROI are now emerging in operations and front-office functions. A couple of important AI use cases include:
- Operational performance and safety
- Problem: A diversified chemicals producer sought to improve safety, reduce energy consumption, and boost operational performance across its facilities.34
- Solution: It implemented nearly 500 AI models across operations, with over 40% of facilities using AI-powered tools for real-time insights and automated control.35 Recent deployments include optimizing ethylene distribution and improving asset utilization.
- Impact: The solution improved safety compliance, reduced energy consumption, and improved operational excellence.
- R&D
- Problem: Traditional chemical R&D can be costly and slow, relying heavily on trial-and-error experimentation, which limits speed to market for new materials.36
- Solution: AI techniques such as supervised machine learning and molecular structure-based diffusion models were implemented to accelerate discovery, screen candidate molecules, and predict material properties for emerging applications.37
- Impact: This led to reduced R&D cycle time and expense, expanded pipeline of viable material candidates, and faster commercialization of innovative products.38
Moving into 2026: Chemical industry to emerge from the downturn
2026 is expected to remain challenging for the chemical industry. Overcapacity in polyethylene, polypropylene, and other olefins and aromatics will likely persist. Without renewed market certainty and stability, end-market demand will likely remain subdued, and complex market conditions will continue to strain the industry.39
As in previous downcycles, the industry is expected to prioritize cash flow, restructure portfolios, and focus on growth and innovation where possible. Companies are expected to base decisions on data and fundamentals, rather than short-term noise, while considering how the downcycle may accelerate industry transformation.
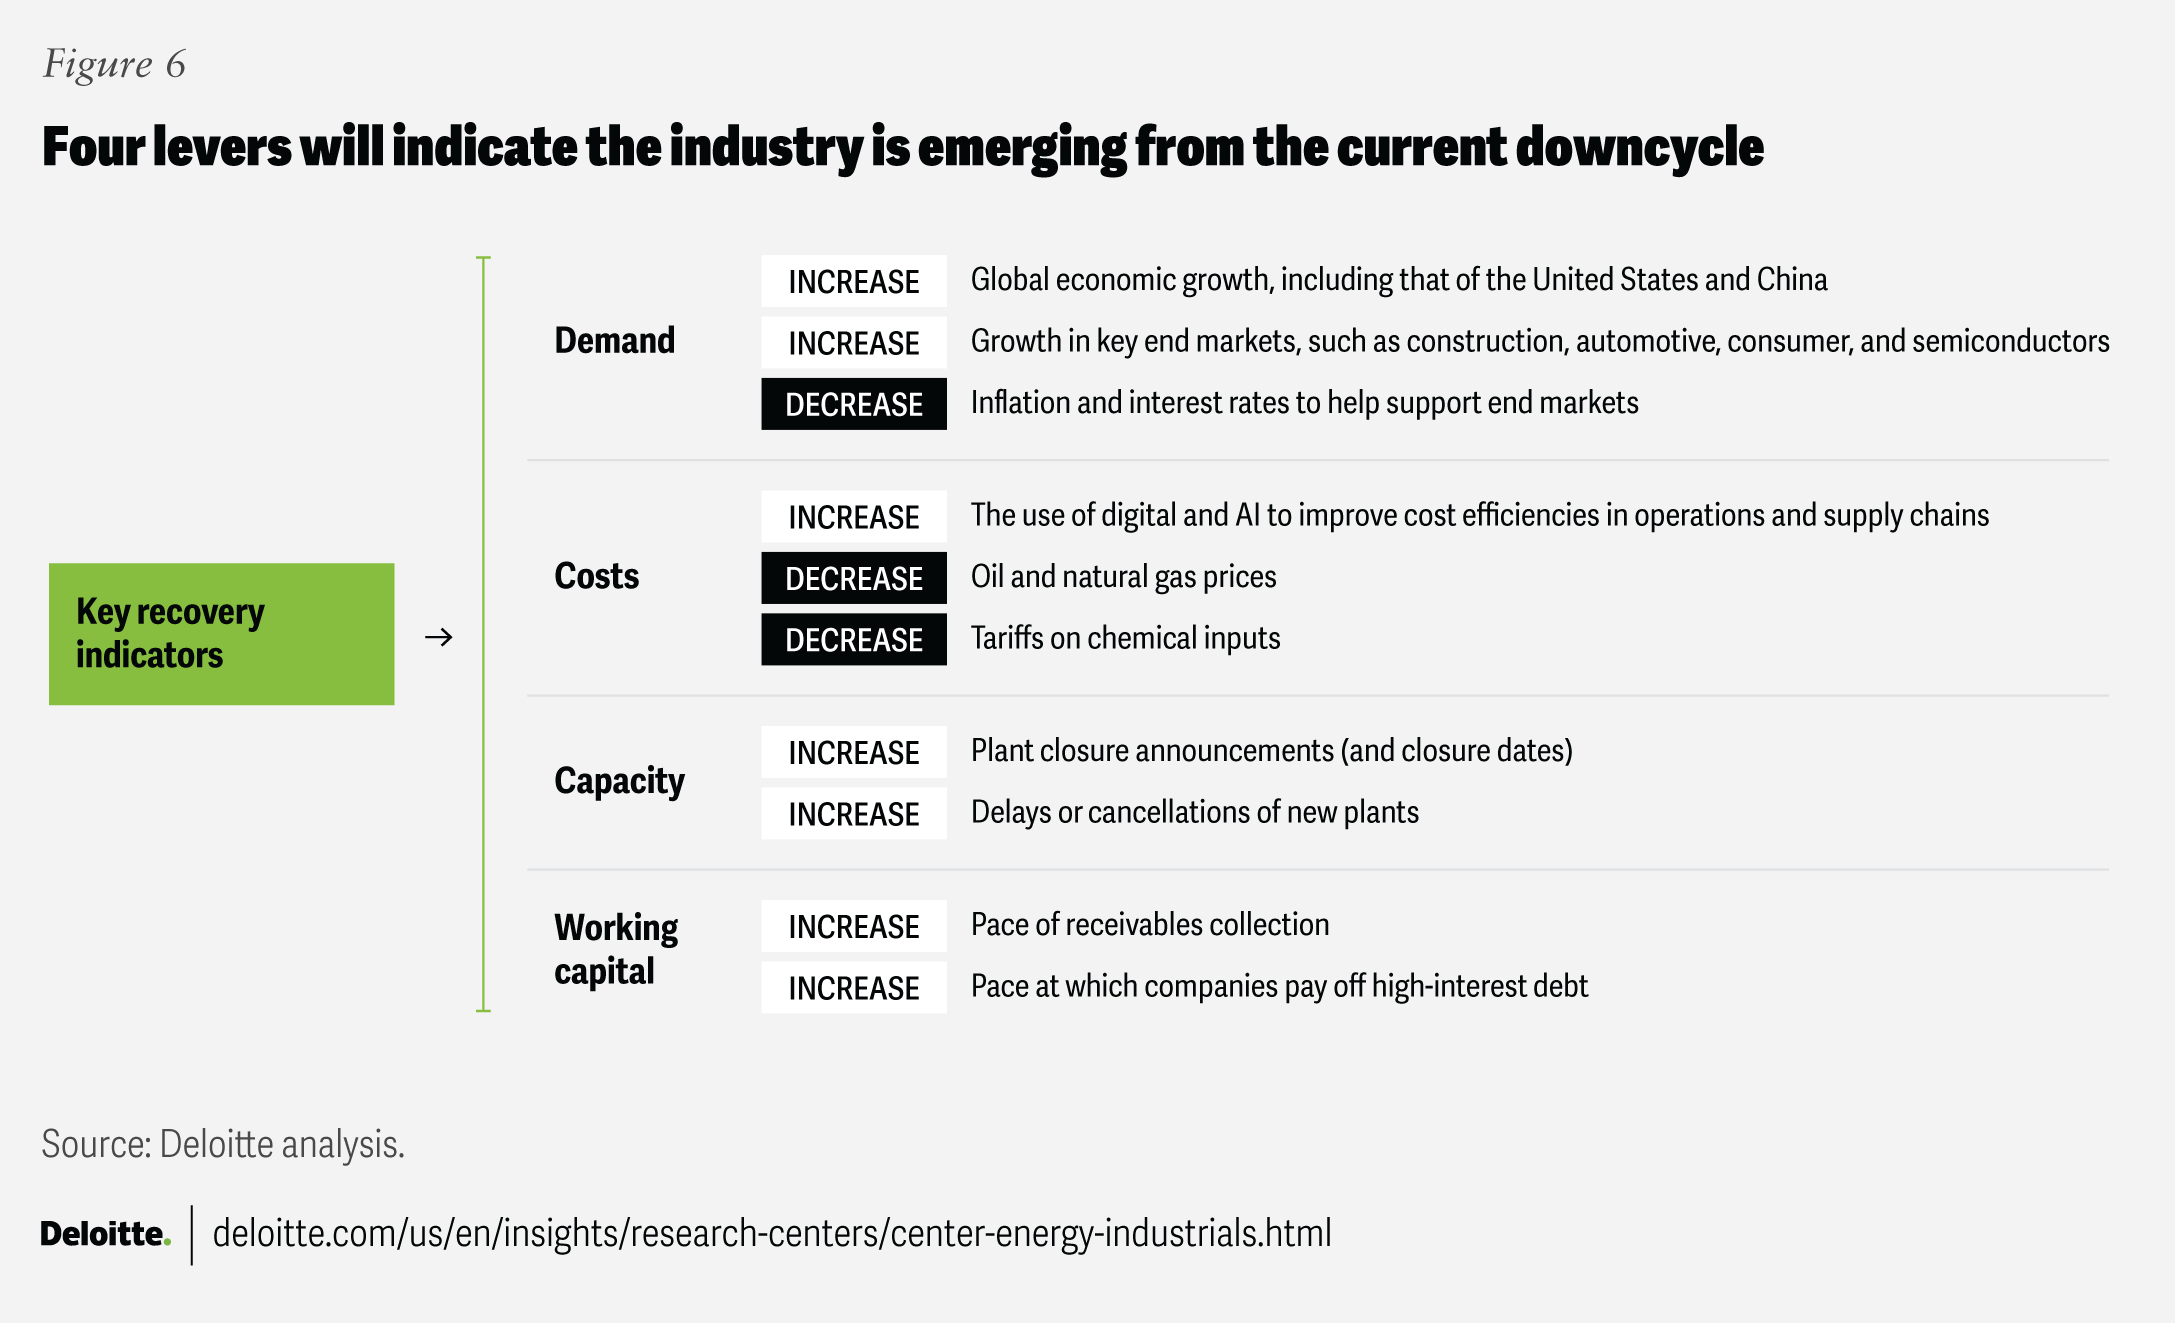
As 2026 unfolds, the industry will be watching for signs that this downcycle is coming to an end. Four main levers could signal that end (figure 6), with several factors influencing those levers. In today’s uncertain environment, predicting the end of the downcycle is challenging; companies that stay flexible and adaptable may emerge stronger.
Future in focus: Sustainability to contribute
Sustainability is poised to be an important driver of capital investment in the chemical industry’s next upcycle, as demand for chemical building blocks is expected to double over the next 30 years. A recent study found that the industry could require an estimated US$1 trillion in capital by 2080 to meet sustainability needs, depending on the scenario.40 Despite current delays and cautious spending, investment in low-carbon solutions and proven technologies—such as carbon capture, clean hydrogen, and electrification—will remain essential. Some regulatory frameworks are intended to increase transparency and encourage lower-carbon production, while many businesses find the economic benefit of sustainable products continues to grow for some applications. However, sustainability priorities will likely vary by region, shaped by local regulations and market needs. Companies that align their portfolios and innovation strategies with these shifts may be more competitively positioned in the future.
Continue the conversation
Meet the industry leaders
Zillah Austin
David Yankovitz
Kate Hardin
By
David Yankovitz
Kate Hardin
Robert Kumpf
Ashlee Christian
The authors would like to thank Ankhi Biswas for her key contributions to this report, including research, analysis, and writing.
The authors would also like to thank Tom Aldred, Matt Burley, Trey Cornelius, Jeremy DeMuth, Kevin Gregory, Phil Hueber, Maria Kipreos, Krishna Raghavan, Julia Tavlas, Damon Vaccaro, Rupesh Vadapalli, John Vickers, and Colleen Whitmore for their subject matter input and review.
Finally, the authors would like to acknowledge the support of Clayton Wilkerson for orchestrating resources related to the report; Randy Brodeur, Katrina Drake Hudson, Dario Failla, and Tara Treado who drove the marketing strategy and related assets to bring the story to life; Kaitlin Pellerin for her leadership in public relations; Aparna Prusty and Pubali Dey from the Deloitte Insights team who edited the report and supported its publication; and Harry Wedel for the visual design.
Cover image by: Pooja Lnu
Visit the Deloitte Center for Energy & Industrials
Access more insights for the aerospace and defense, chemicals and specialty materials, engineering and construction, industrial manufacturing, mining and metals, oil and gas, power and utilities, and renewable energy sectors.