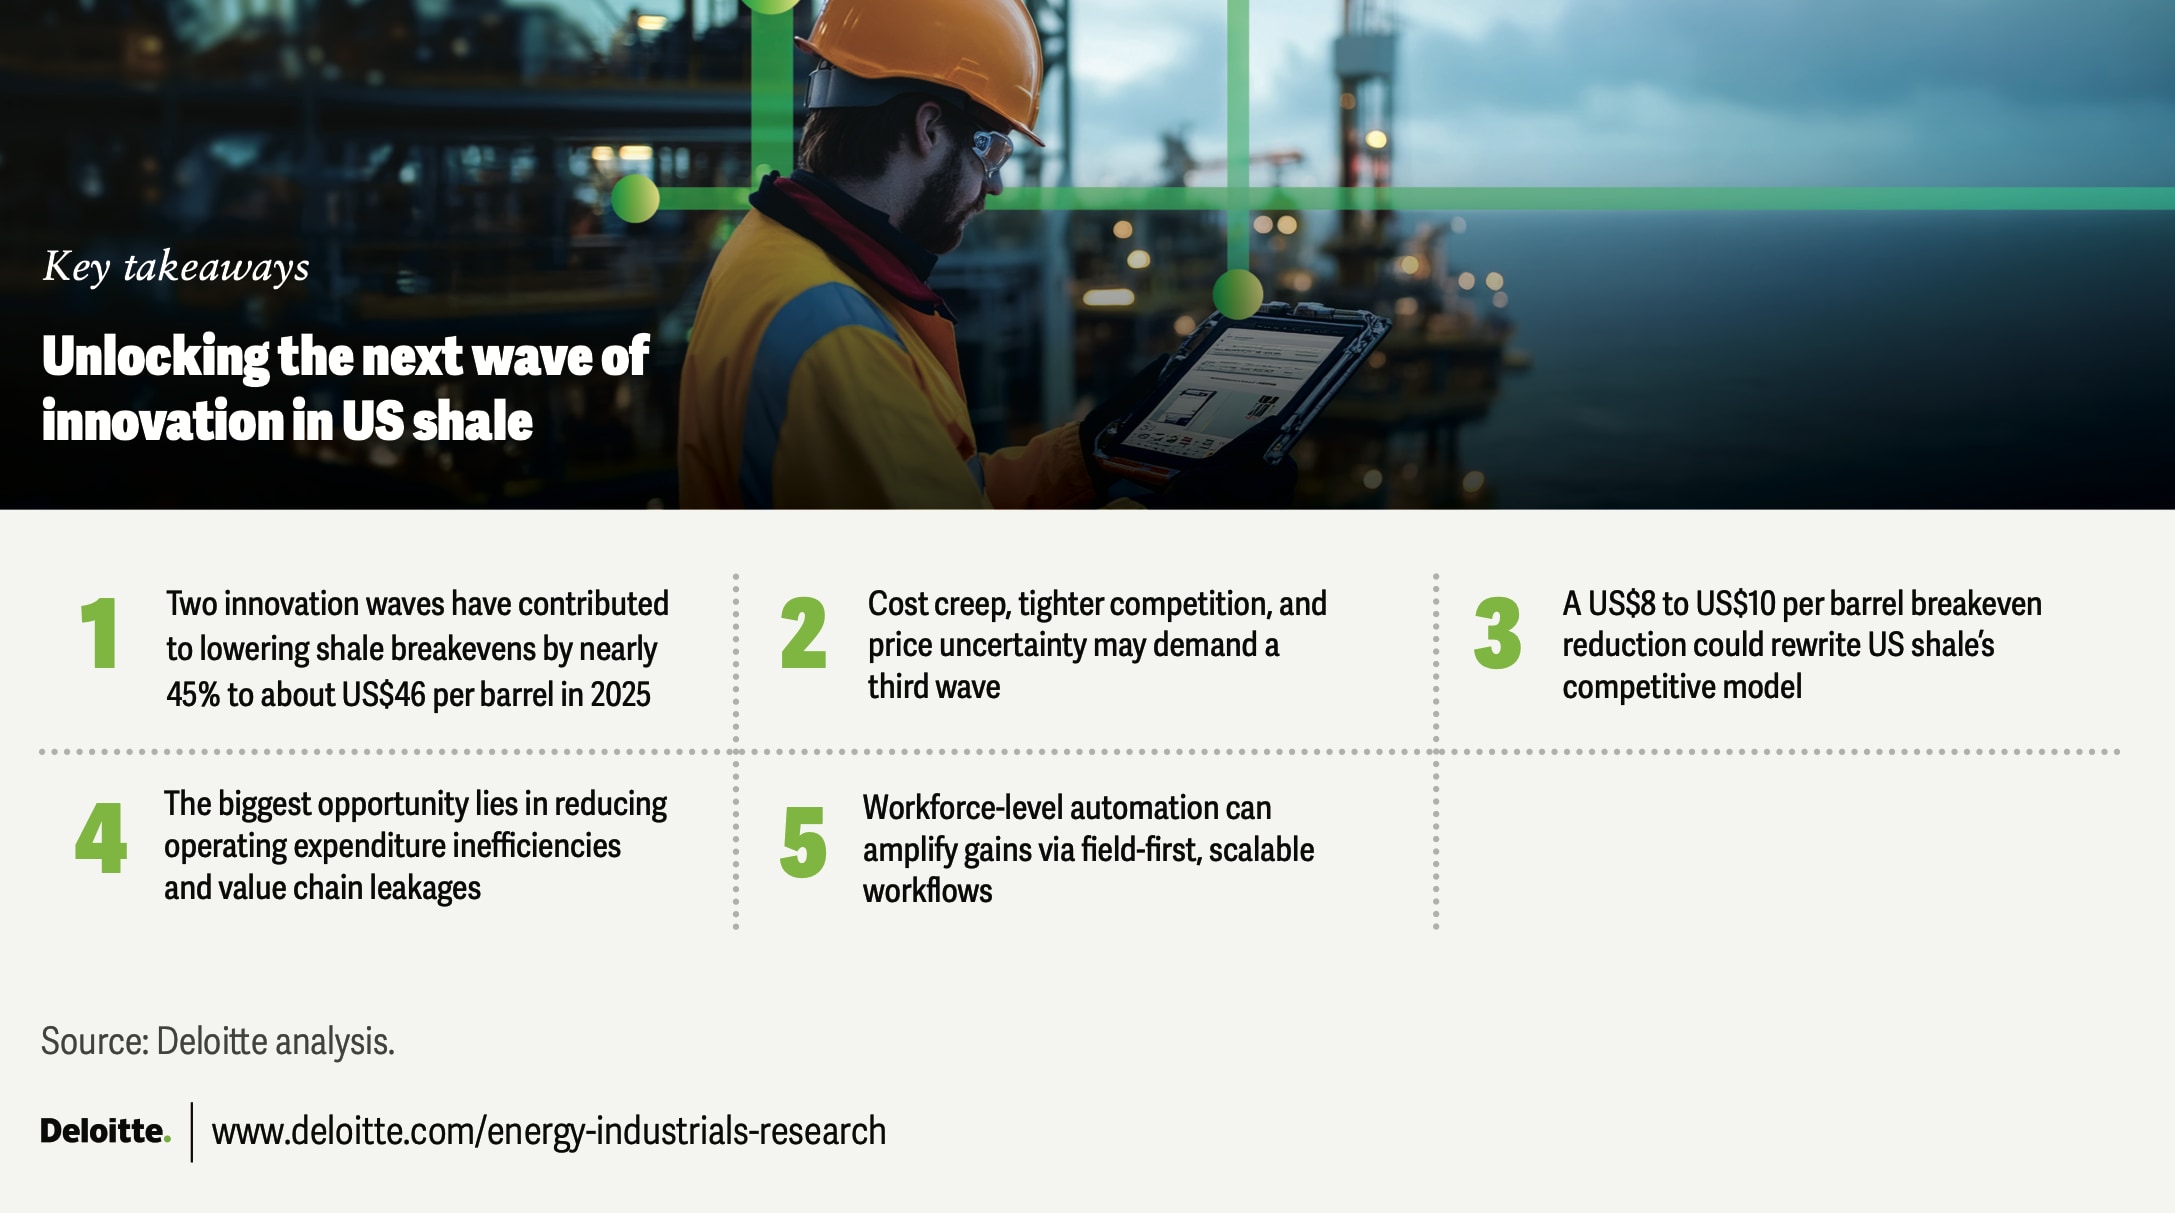
Unlocking the next wave of innovation in US shale
Breakeven costs in US shale have dropped by nearly 50% since 2015, and a new wave of innovation could make shale even more competitive
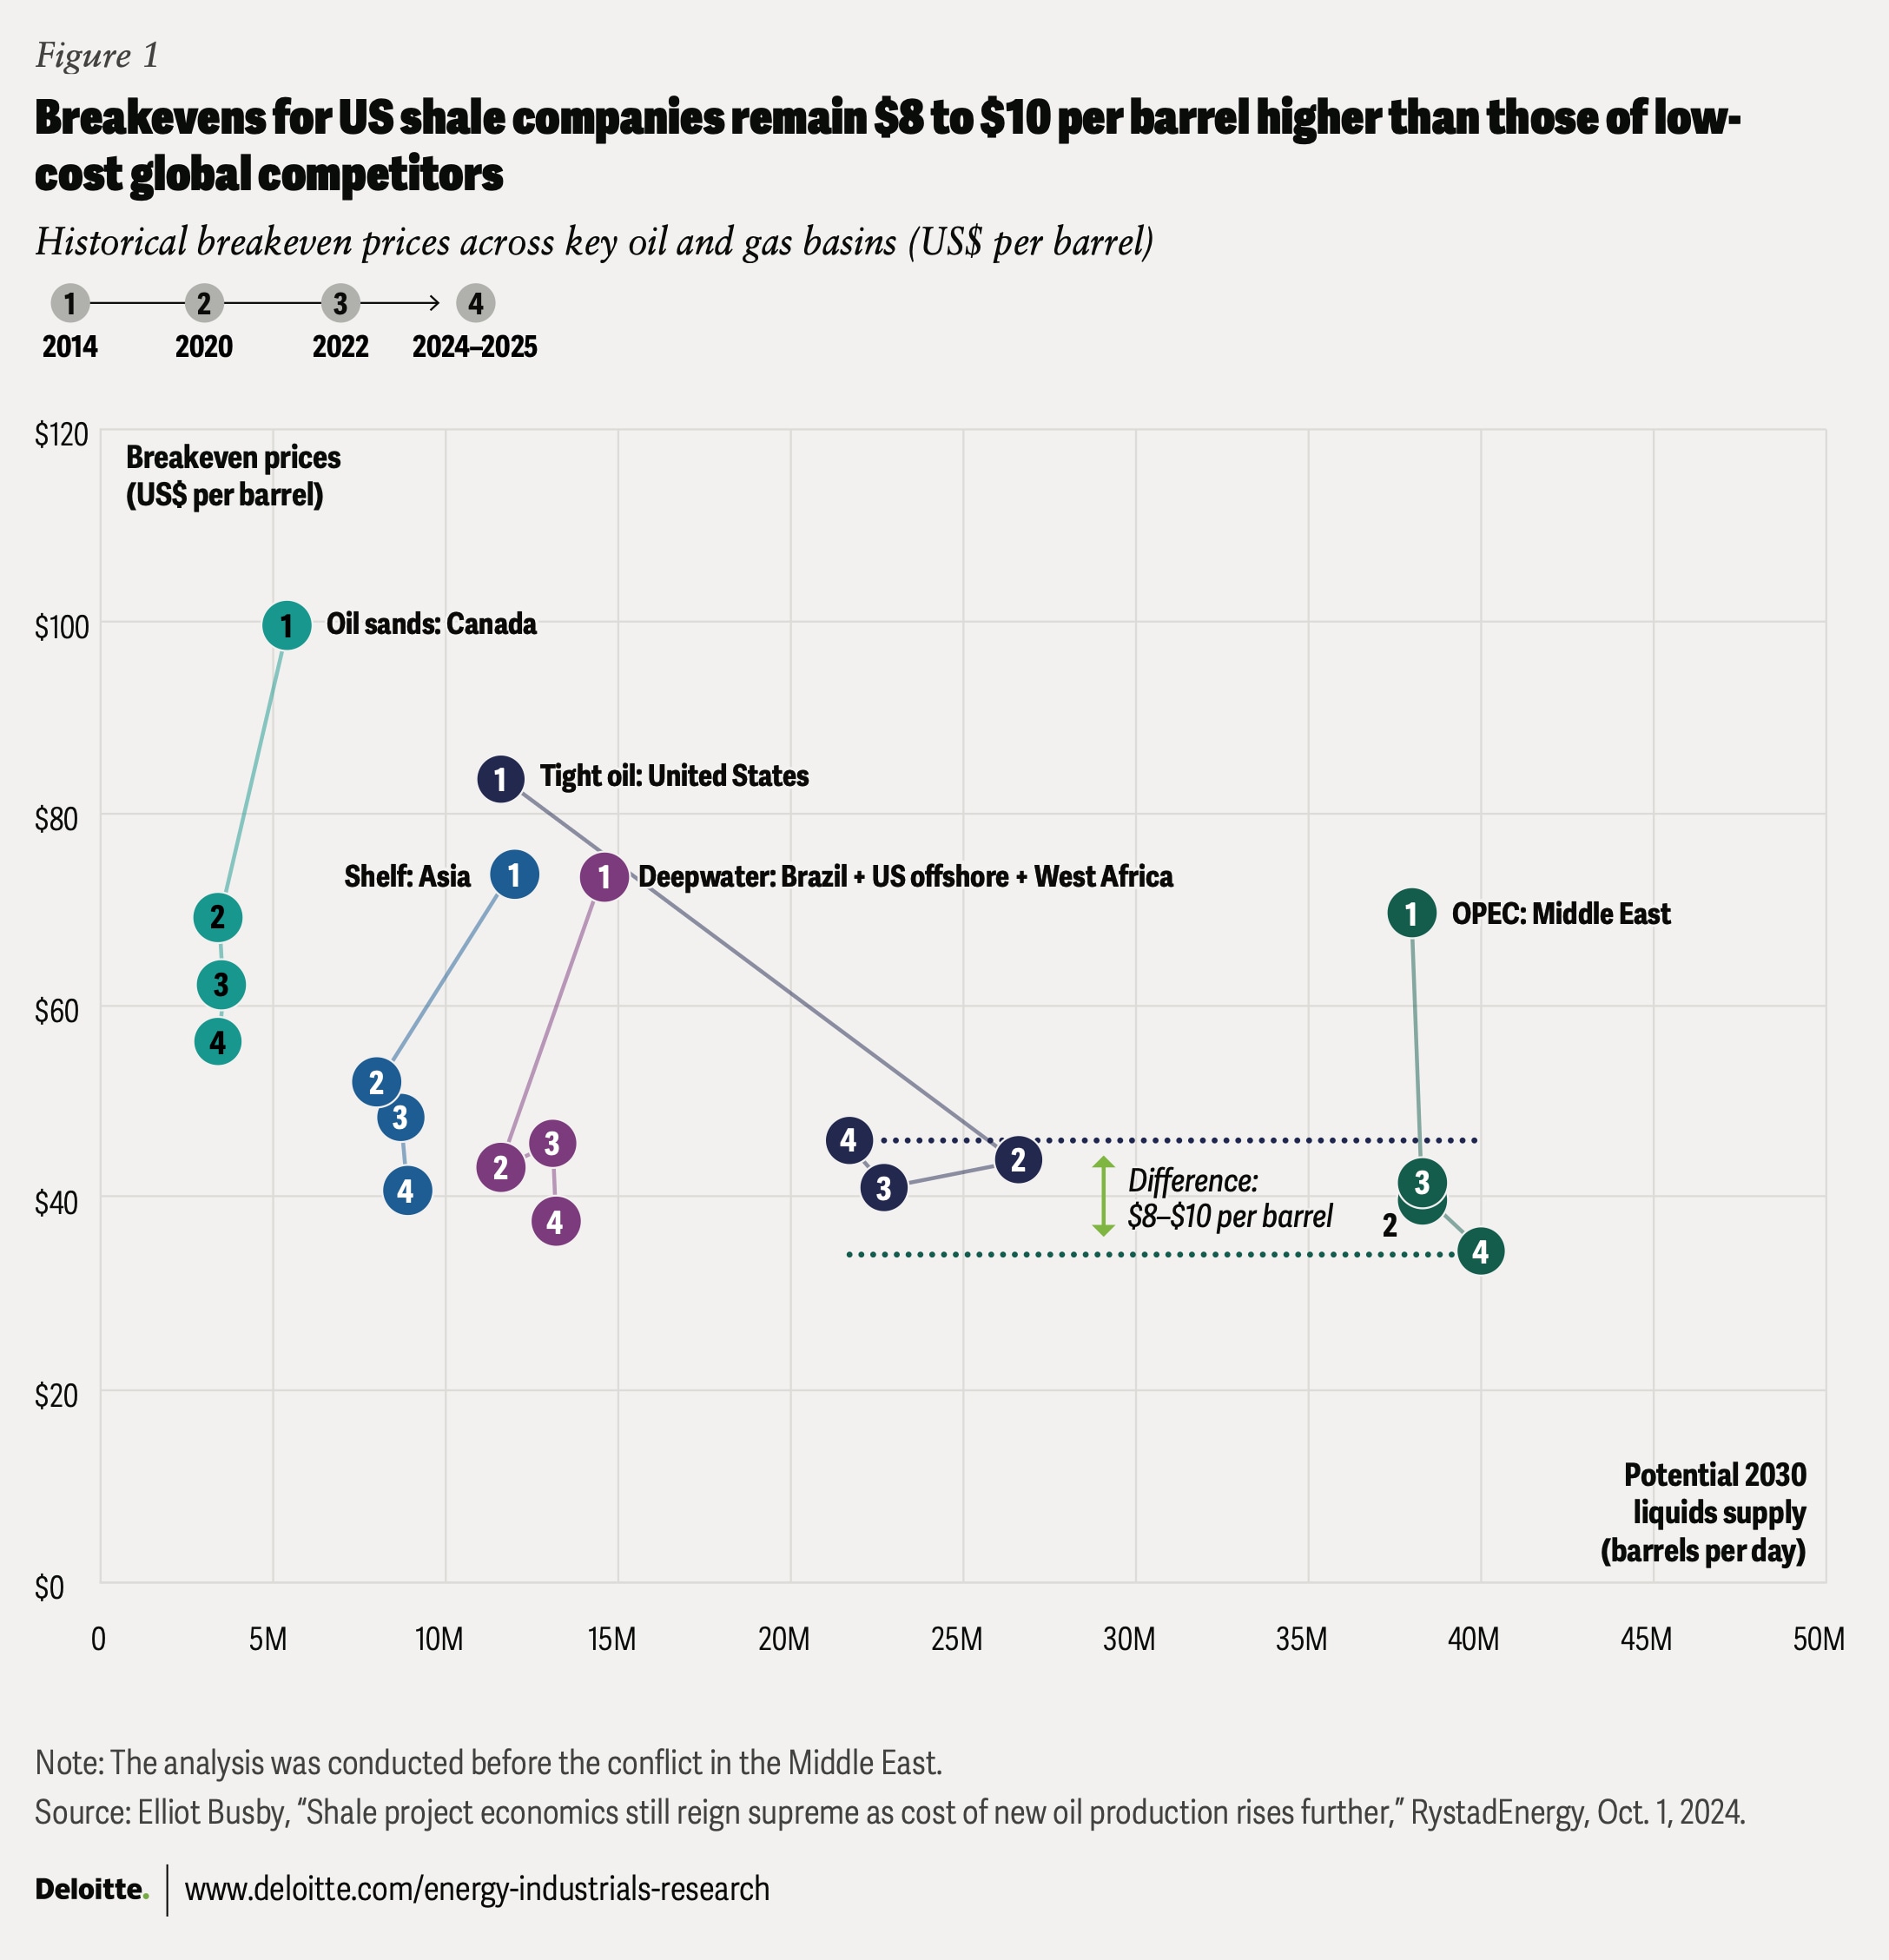
This analysis was conducted before the conflict in the Middle East.
US shale breakevens—which include lifting costs from existing wells, incremental drilling and completion expenses, corporate overheads, and shareholder returns—have fallen by about 45% since 2015, to roughly US$46 per barrel in 2025.1 While crude prices remain inherently volatile, that lower cost base has likely contributed to US shale’s resilience across price cycles.
The industry’s “test, learn, iterate, and scale” cycle has helped propel the United States to become the world’s largest producer of oil and natural gas, producing about 50% more than the second-largest player.2 Reinforcing waves of innovation and discipline have likely accelerated this progress.
- First wave: The 2014 to 2016 oil price downturn helped catalyze a wave of innovation in drilling, completion, and acreage management that reshaped shale performance. Average lateral well lengths now exceed 2 miles and can extend up to 5 miles, while improved well spacing and full dual-well stimulation have reduced drilling time and lowered costs per well.3 Additionally, proppant intensity has reached 5,000 pounds per foot for high-specification wells, while lightweight proppants have improved resource recovery by up to 20%.4 A result: US oil and gas (O&G) producers are now pumping 13.8 million barrels per day of oil using less than one-third of the active rigs in 2015, roughly four times the output per rig.5
- Second wave: Progress accelerated as some large O&G companies scaled their shale positions and imposed stricter financial discipline. Since 2020, these companies have acquired US$400 billion in upstream assets, industrialized leading practices, and built integrated capabilities, reducing shale’s supply elasticity to price swings.6 For instance, a US$5-per-barrel monthly change in oil prices corresponded to a roughly 17% change in rig activity in the 2015 to 2017 period; now it is less than 2%.7 “Best-for-capital” decisions to meet their growing shareholder commitments also contributed to the reduction of the industry’s activity in low-quality wells.
Despite this progress, many US O&G companies still compete from a higher cost base. Full-cycle breakevens remain US$8 to US$10 per barrel higher than those of low-cost global competitors (figure 1).8 The time has therefore come for US O&G companies to continue building on the progress so far, especially as market uncertainty is expected to continue with oil prices reaching US$120 per barrel as of early March 2026, and as energy affordability and supplier resilience once again come into focus.9
Igniting a new wave
Upcoming challenge: Risk of breakeven costs rising amid flat-to-lower oil and gas prices, impacting competitiveness
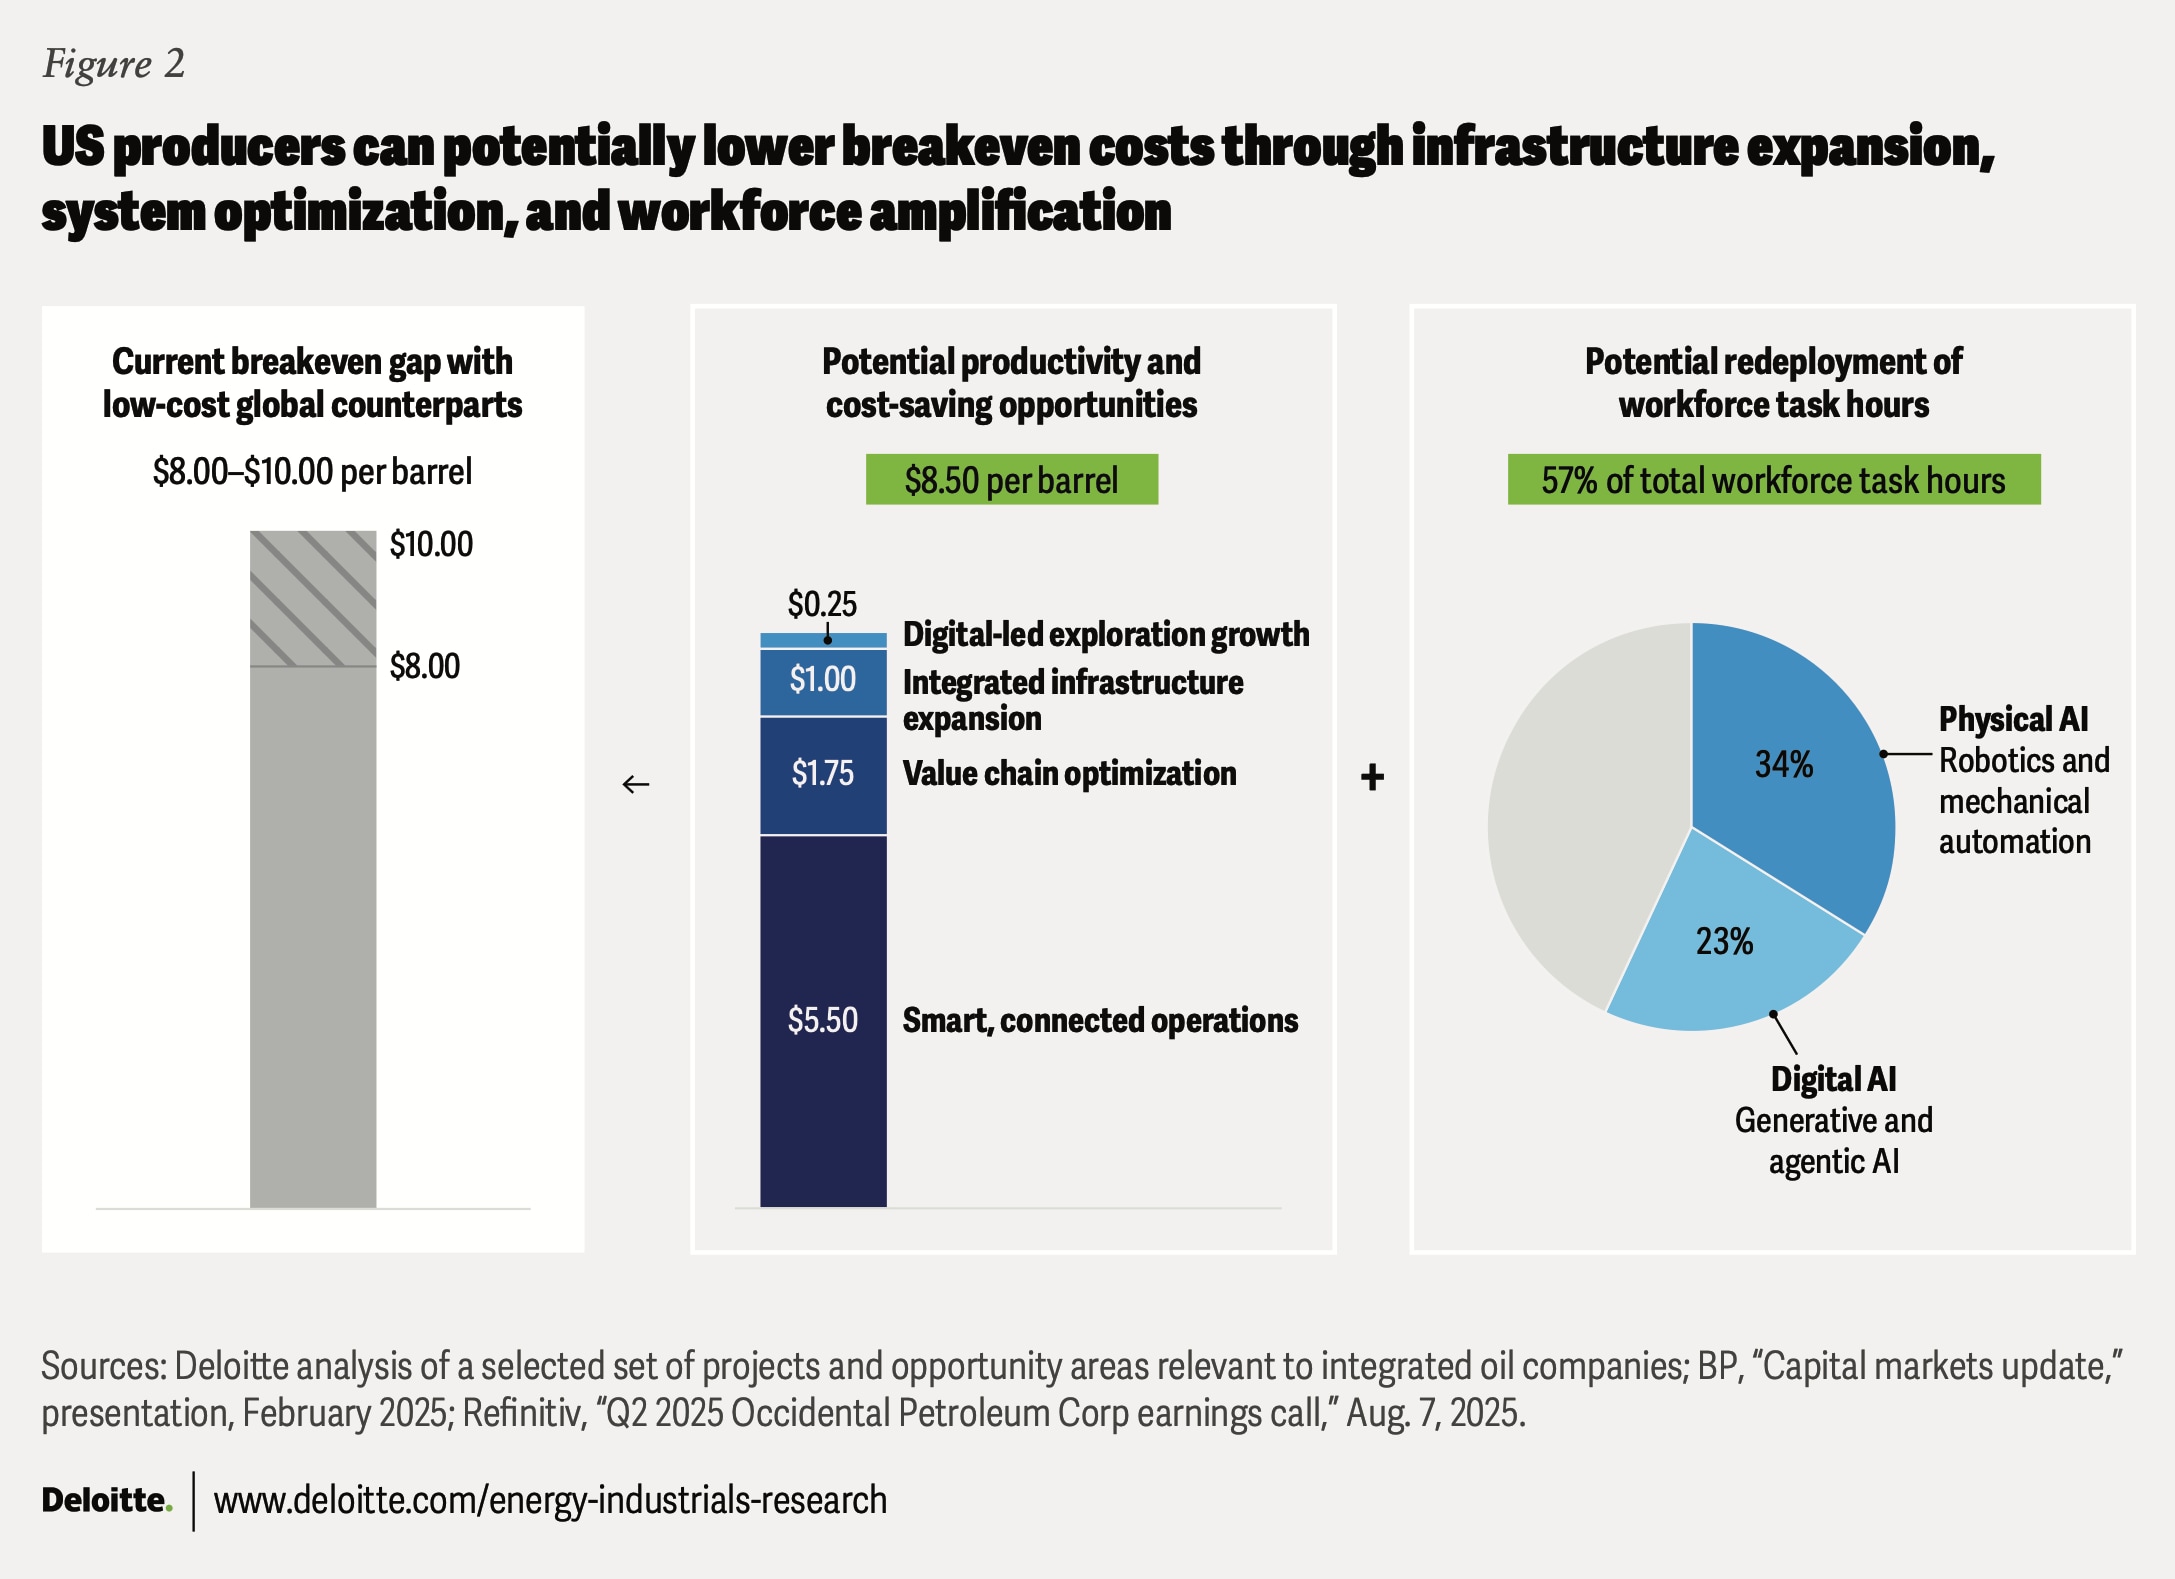
Cost and tariff headwinds are mounting—upstream costs are slated to rise by 4% to 20%10—while the structural weakness in oil markets (absent conflicts and supply disruptions) may persist. Against this backdrop, a third, digital-led innovation cycle could help accelerate performance gains and reduce the breakeven gap with low-cost global counterparts (figure 2). This third wave of innovation should consider three aspects.
- Infrastructure activation: Rebuilding exploration capability and monetizing the broader midstream infrastructure build-out
- System optimization: Leveraging smart, connected operations to reduce operating expenditure (opex) and lift netback
- Workforce amplification: Prioritizing scalable, field-first use cases that can be deployed quickly
Infrastructure activation
Opportunity: Potentially reduce breakeven costs by US$1.5 to US$1.75 per barrel
By enhancing exploration’s digital capability and strengthening end-to-end reliability across the infrastructure buildout, the industry could potentially realize savings of up to US$1.75 per barrel.11 Maintaining a balance between production and midstream takeaway capacity could help keep the system well-supplied and dependable.
- Digital-led exploration growth: Exploration spend as a share of US upstream spend has fallen by 50% to US$10 billion.12 However, rebuilding exploration muscle may not be able to follow older strategies that leaned on classic wildcatting, geoscience-led sweet-spotting, acreage shape and contiguity, and static decline-curve assumptions. Instead, exploration should include a digital backbone as much as geoscience: integrated subsurface-to-surface data for better prospect ranking; analytics and AI to continuously recalibrate decline curves and operational constraints (for example, water, power, and infrastructure); and data-powered workflows that improve capital allocation and repeatability. AI and machine learning can help accelerate seismic analysis from months to weeks, while improving seismic interpretation quality by up to 40%, increasing effectiveness by US$0.15 to US$0.25 per barrel of exploration capex.13
- Capitalizing integrated infrastructure expansion: Midstream capex, which directly supports the growth of upstream operators and downstream refiners, has seen its share of total US O&G capex nearly double since 2015.14 The midstream buildout has enabled a reduction in natural gas flaring and venting, which equates to roughly US$0.4 per barrel on a gross value basis.15 Similarly, an optimal and connected midstream buildout around the Permian Basin, relieving Waha congestion, could bring roughly US$0.9 to US$1 per barrel in value lift when spread across total US crude output.16 Realizing and sustaining this value should include treating the midstream buildout as a flexible, data-enabled platform that can improve flow assurance, monitor and manage key constraints, and enable deeper risk-based inspection and maintenance.
System optimization
Opportunity: Potentially reduce breakeven costs by US$7.25 per barrel
Breakevens can fall when both sides of the financial equation are optimized: value chain optimization improving the “in-between” netbacks from production to sales and smart operations optimizing opex spending across day-to-day operations. Integrated, they can drive a step-change in project economics of nearly US$7.25 per barrel.17
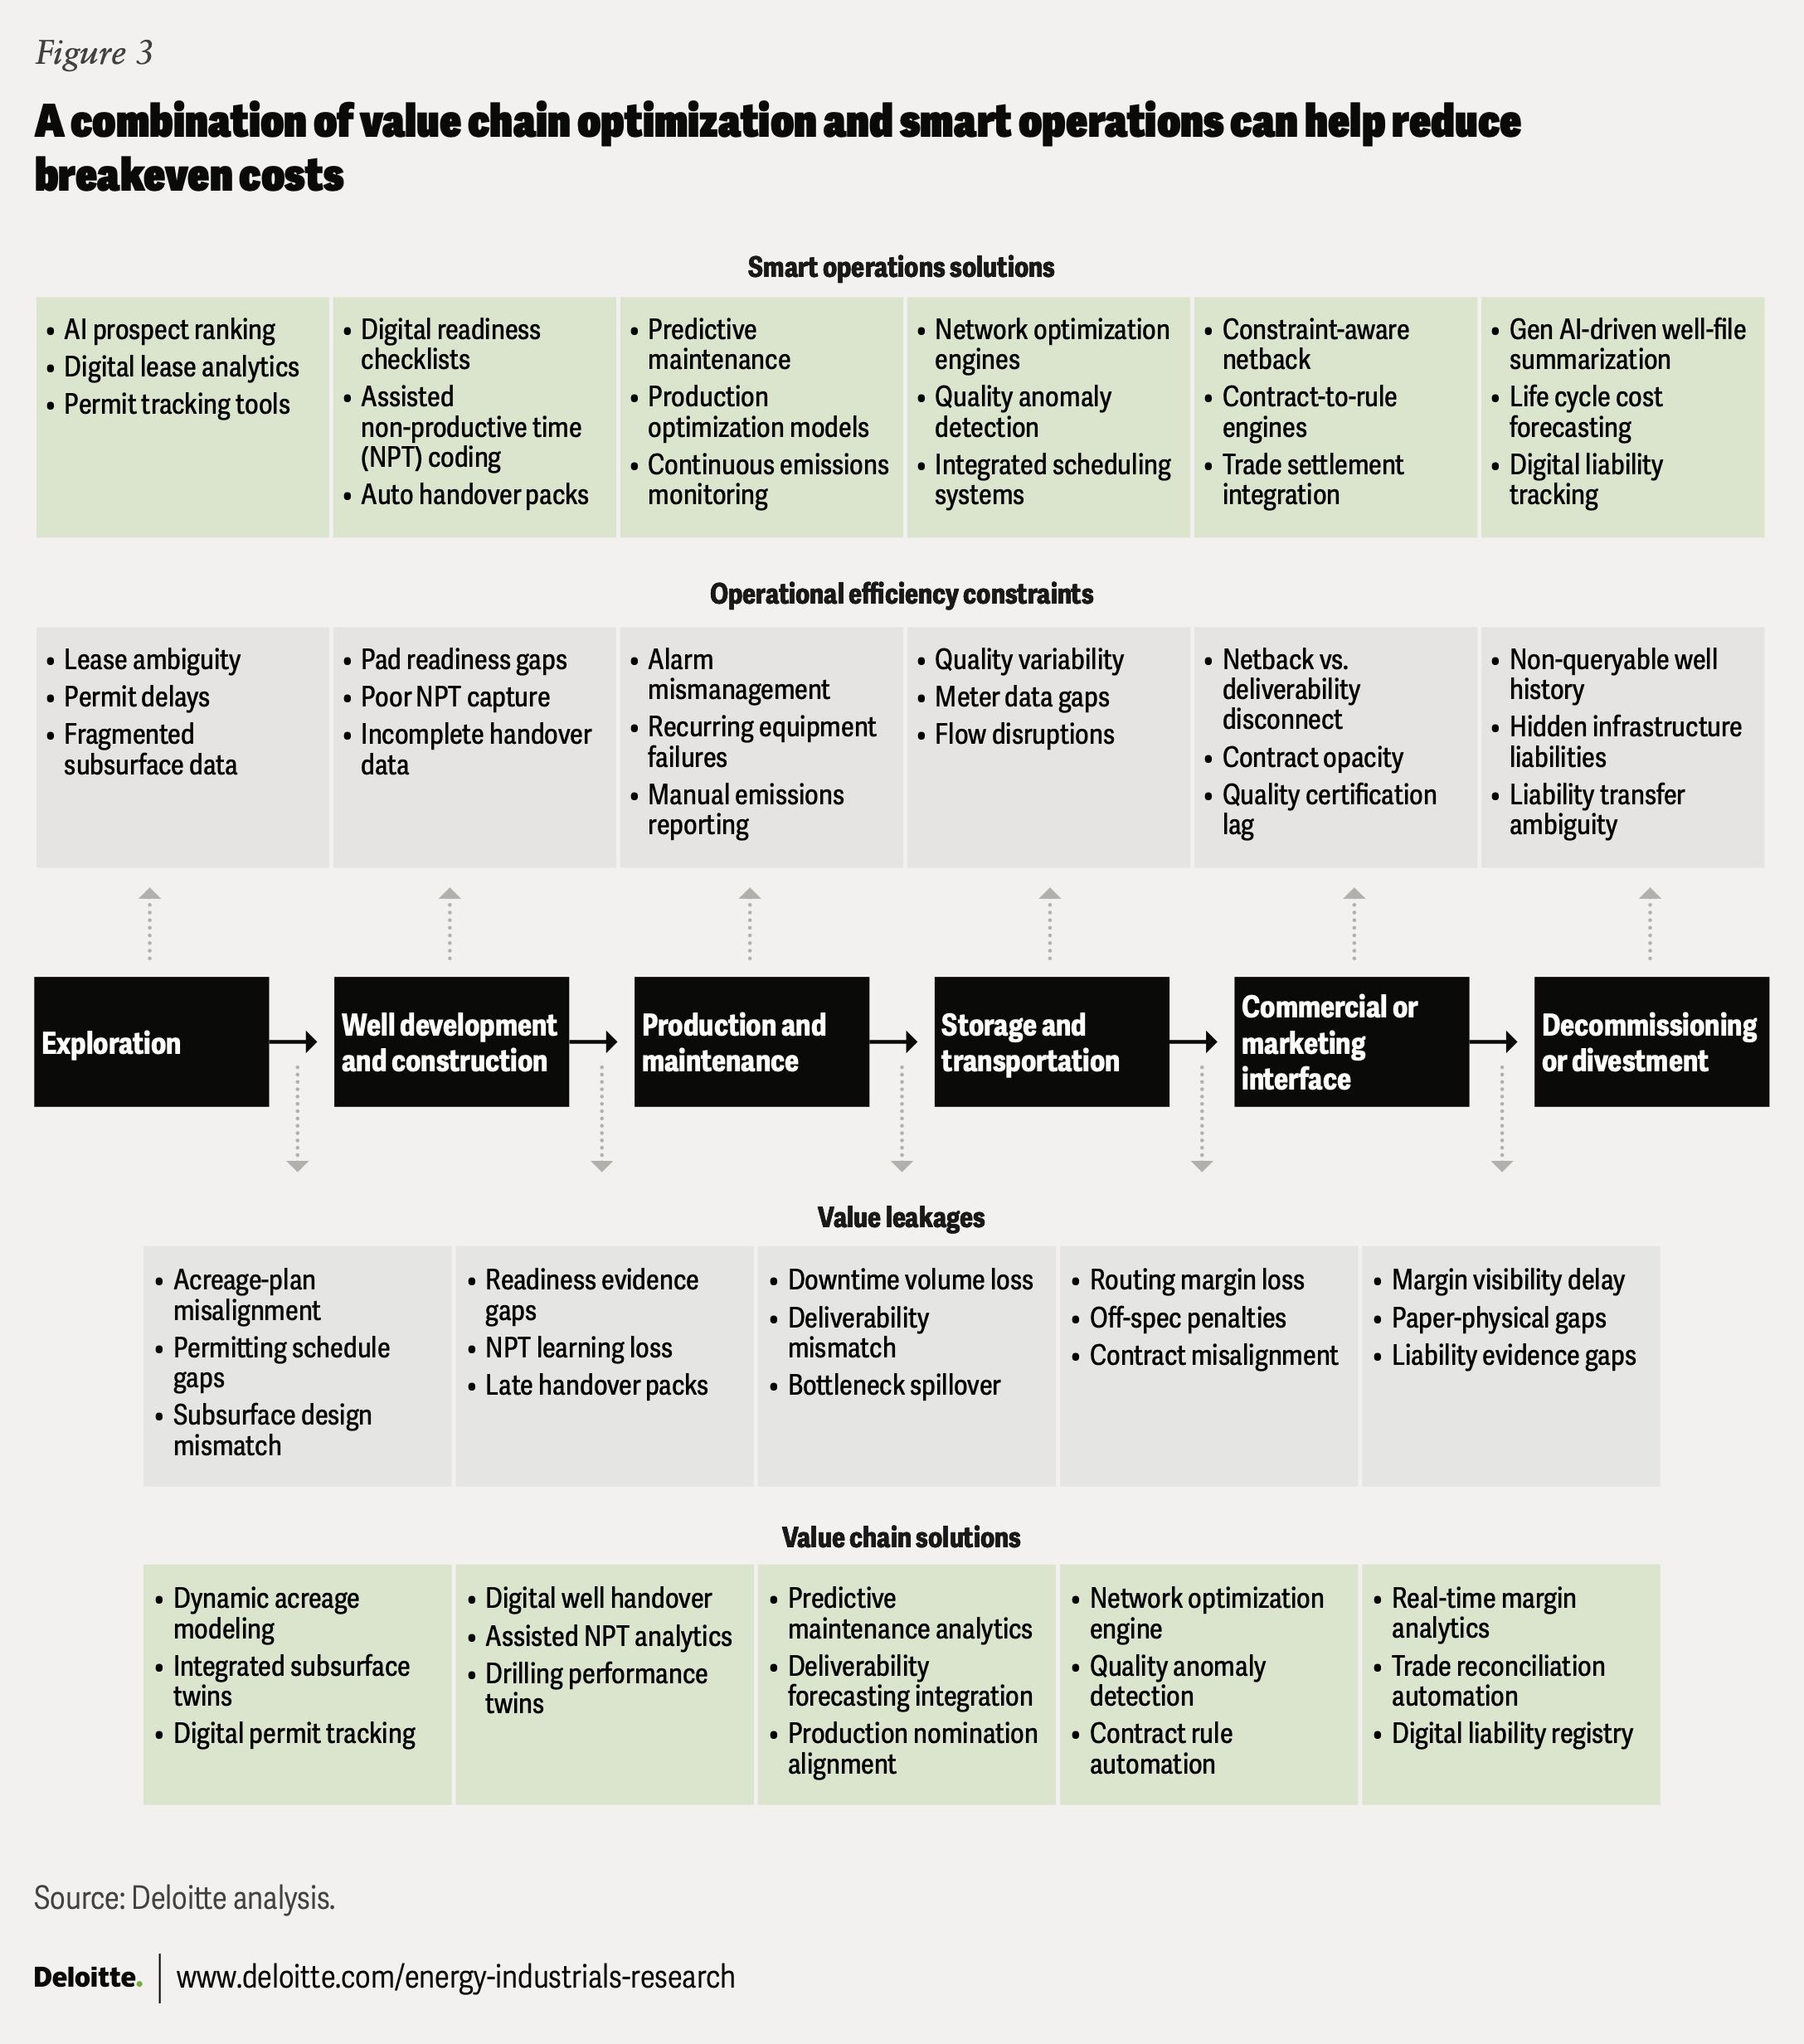
- Value chain optimization: Misaligned handoffs between a company’s assets or business units can reduce total value captured. For example, when upstream oil cargo timing or quality shifts but refinery nominations and tankage cannot adjust fast enough, the refinery may run suboptimally and excess barrels can get pushed into the spot market at a discount, often with added storage and handling costs. Similarly, refiners can lose significant value when their linear programming models rely on weekly or monthly assumptions, while price structures and supply constraints shift daily, and when their trading or hedging strategies rely on generic 3‑2‑1 crack spreads that don’t reflect the refinery’s actual yield slate (figure 3).
A large integrated player in the Permian Basin, for instance, faced fragmented decision-making across its upstream, midstream, and commercial functions. By integrating financial, operational, commercial, and market data, the company enabled dynamic linear programming-based optimization, faster scenario simulation, tighter collaboration between schedulers and traders, and constraint-aware decision-making from production through sales. As a result, netbacks improved by US$1 to US$1.75 per barrel within the first six months, driven by better flow assurance, commercial alignment, and end-to-end profitability.18
However, results may depend not only on operating performance, but also on infrastructure positioning and the decision-making structure.
- Smart, connected operations: A large share of operational expenditure often stems from overmanagement, inefficient execution, and suboptimal allocation of resources across repeatable operational events. These can include late failure signals and avoidable callouts driven by poor-quality alarms and sensors, reactive full-system shutdowns, and manual workarounds such as handwritten logs. Over time, these issues can compound into production deferment, excess field visits, and higher energy and materials consumption (figure 3). Several digital programs over the years have improved visibility but not outcomes for organizations—for instance, dashboards without a defined closed-loop response and analytics that aren’t embedded in frontline workflows.19 Closing the gap should include smart operations that hardwire insights into day-to-day execution, converting “information value” into “operational value.”
For example, a US shale asset operated by a large integrated company realized benefits of up to US$5.5 per barrel by shifting to smart operations. These included agentic AI-powered monitoring, automated downtime coding, and exception-based operations with human intervention only when needed. Additional gains came from predictive failure detection, prescriptive maintenance, and integrated remote operations enabled by dynamic geospatial data.20
Workforce amplification
Opportunity: Nearly 57% of task hours can be redeployed, but value may hinge on tight prioritization
In an unconstrained technology adoption scenario, nearly 57% of workforce task hours in the US O&G sector could be redeployed—34% via physical AI (for example, robotics and mechanical automation) and 23% via digital AI (for example, generative and agentic AI).21 This estimate is an upper-bound indicator of where tasks can be redesigned—not removed—with actual impacts varying by role design, task mix, site conditions, safety constraints, integration effort, and the pace of upskilling. In practice, adoption may be constrained by capital availability, integration complexity, and workforce readiness. Given the industry’s field-heavy cost base and large frontline workforce, companies may want to consider prioritizing field-first use cases that can deliver near-term value.
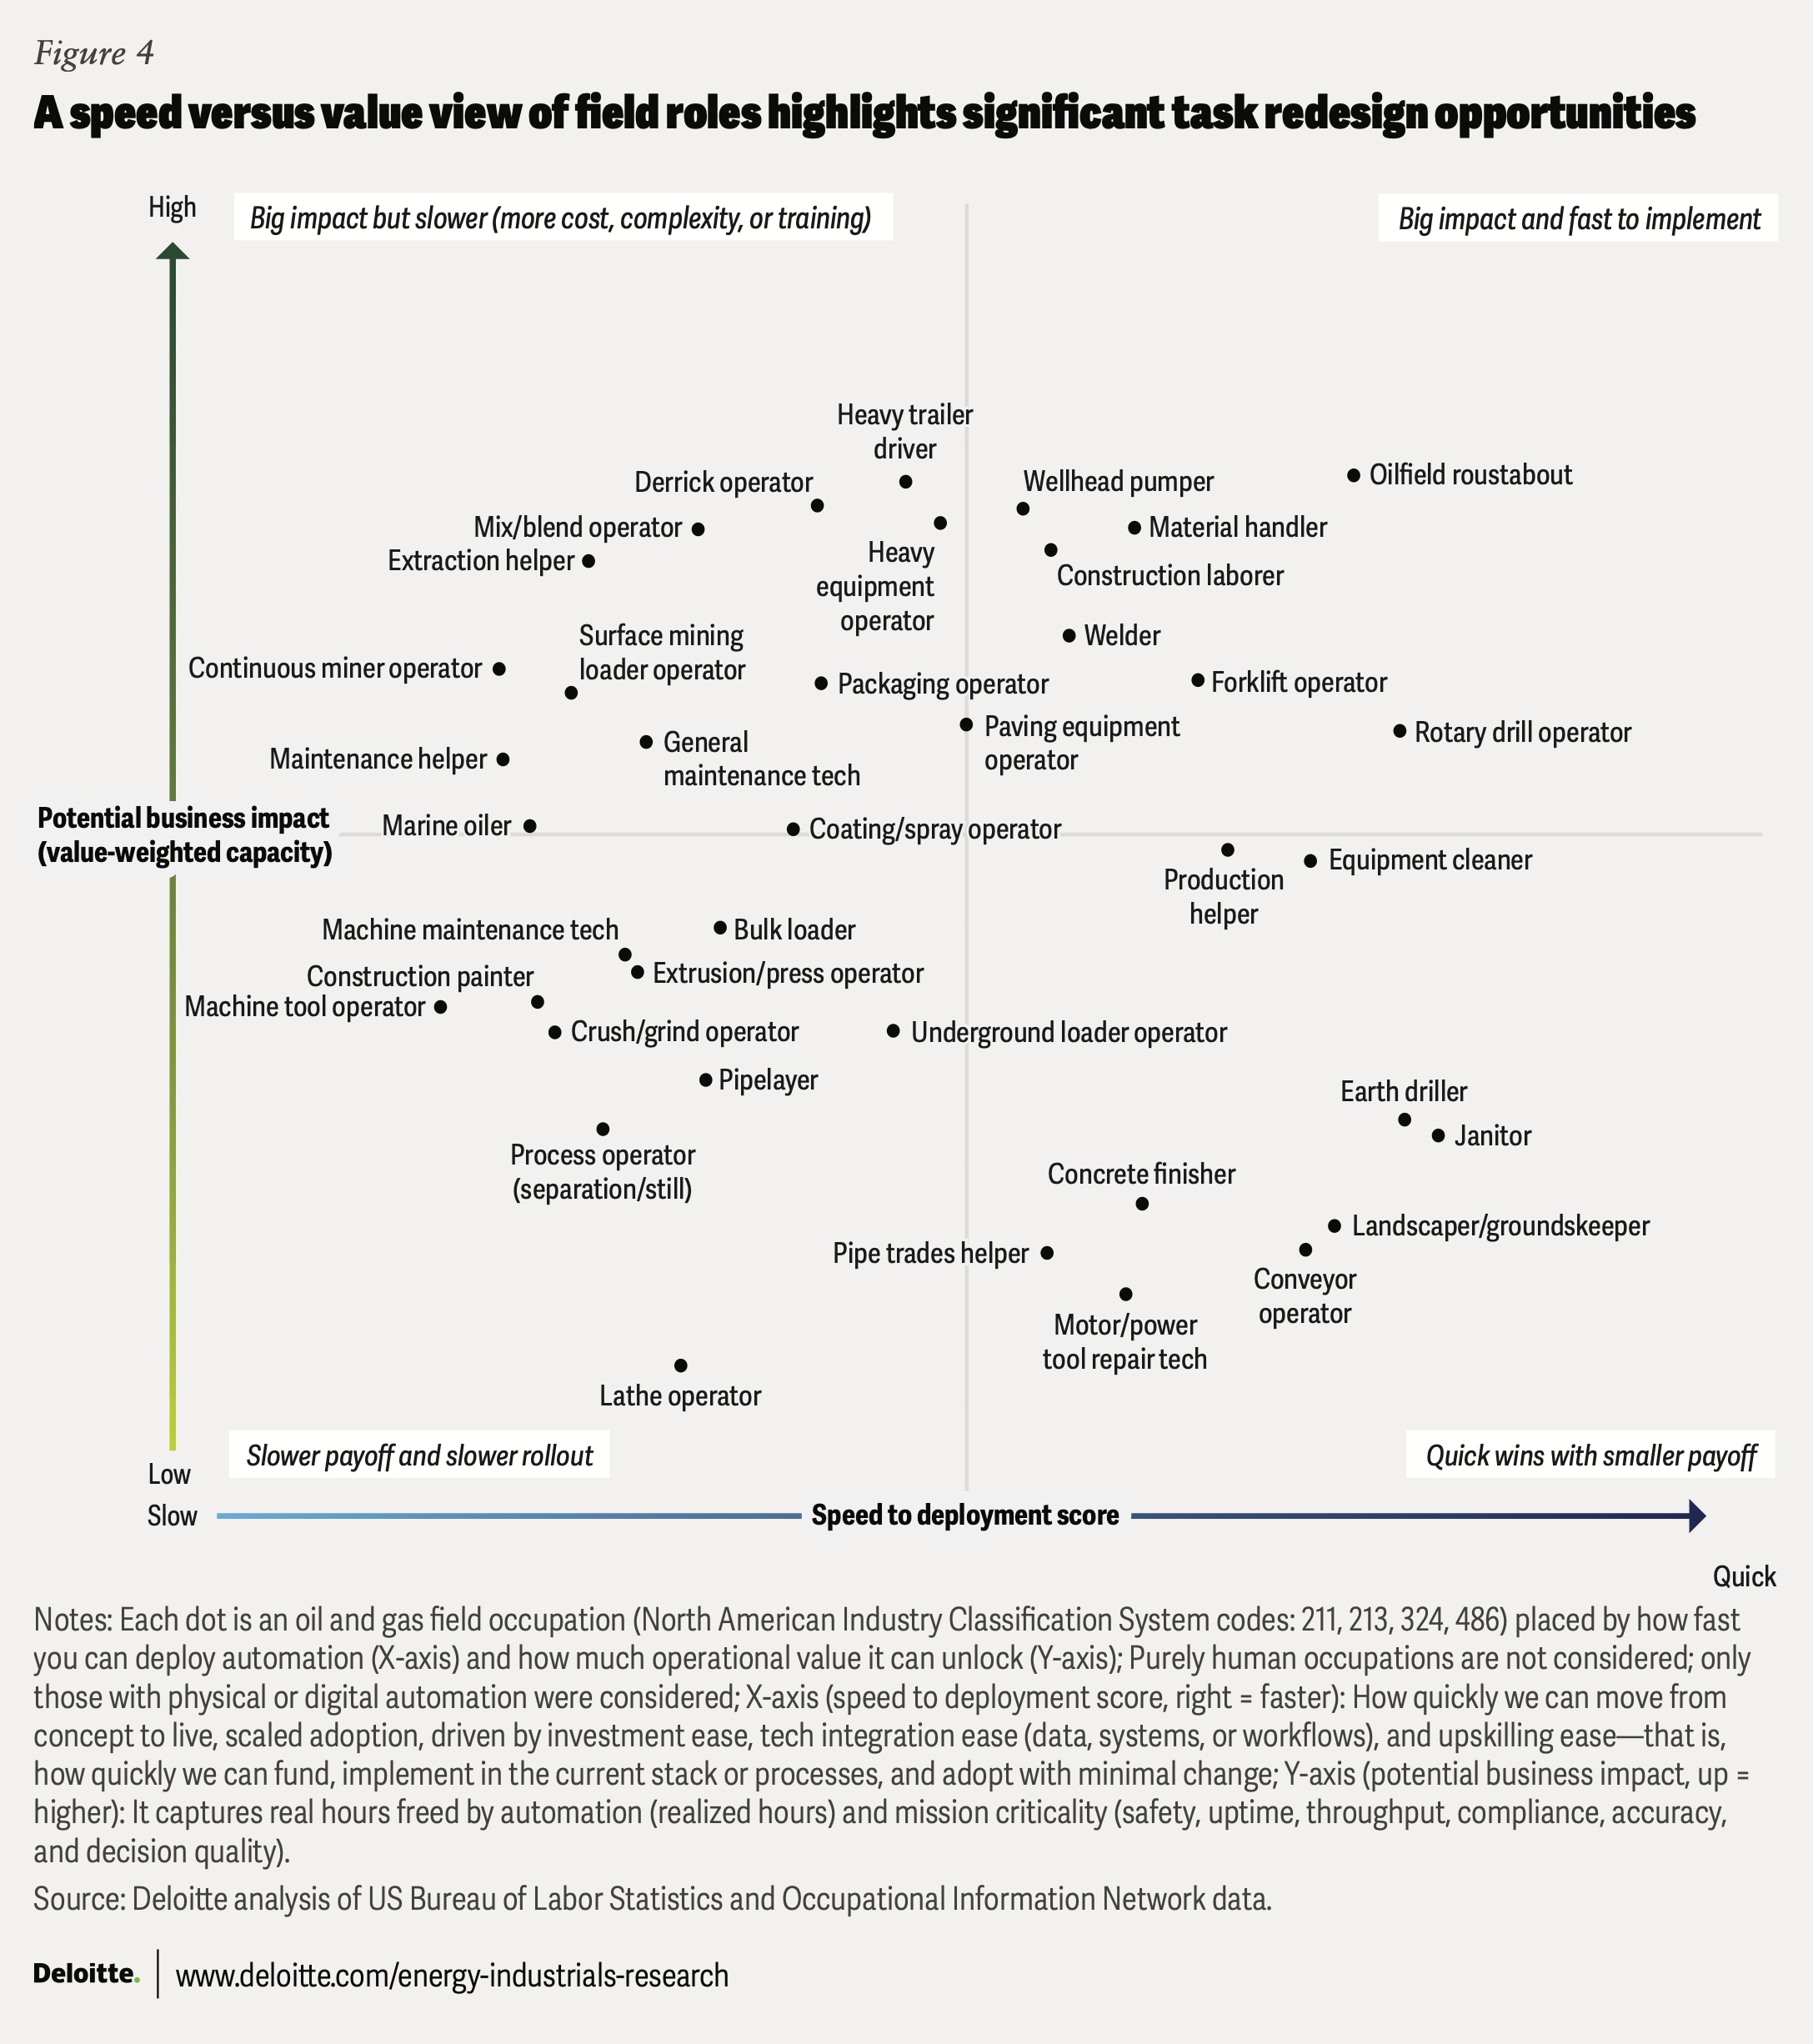
An analysis of about 40 field occupations across two dimensions—deployment speed (capital required, integration effort, and upskilling needs) and potential business impact (value-weighted capacity) adjusted for criticality of the occupation—highlights several “feasible and impactful now” targets (figure 4, top-right quadrant).22 In 2024, this quadrant represented around 95,000 workers—about half of on-field employment—whose frequent, high-risk tasks affect uptime or downtime and are well-suited to established technologies that require little integration or training.23 Importantly, value can come not only from mechanizing tasks but also from redesigning the work around them—dispatch, sequencing, parts availability, and shift coordination. The top five occupations in this quadrant are:
- Roustabout: A hands-on role helps keep the site safe and running (rig-up and rig-down, basic maintenance, site readiness). Value can come from equipping roustabouts with better digital tools to work more safely and effectively, including mobile work management, digital checklists and job hazard analyses, digital permit and lockout or tagout capture, and tool and equipment tracking.
- Wellhead pumper: A frontline role that protects production uptime and asset integrity by performing rounds, making adjustments, and catching issues early. Improvement opportunities can focus on giving these professionals better visibility and faster access to actionable information through asset-linked digital rounds, alert-driven prioritization, and voice-to-text notes that auto-populate field logs.
- Material handler: An important role that helps keep throughput high and crews productive by staging the right parts, reducing delays, and preventing stockouts. Digitization can strengthen this role by improving material visibility and execution through barcode or RFID-enabled receiving and picking, digital chain-of-custody or load tickets, basic yard or staging visibility, and smarter reorder triggers.
- Rotary drill operator: This is an important role focused on drilling performance and safety, where small deviations can quickly cascade into nonproductive time and well-quality issues. Near-term gains could come from enhancing operator decision-making with better data connectivity, faster decision support, and more standardized reporting, including auto-capture of key events or parameters, alarm rationalization, guided procedures, and AI-assisted summaries.
- Welder: An important role for ensuring safety and compliance, where defects can create disproportionate rework and risk. Near-term task redesign should consider focusing on giving welders stronger quality and traceability tools, including digital weld packages, in-process checklists, photo-backed quality assurance and control, consumables tracking, and automated inspection-ready documentation.
One overlooked improvement area across these roles is shift handoff, which can be a bottleneck at the start of every shift. Each handoff forces the incoming worker to reconstruct context, rebuild situational awareness from scattered notes, reconfirm hazards, walk the lines, etc. A portion of on-field workers’ time goes into documentation activities (logging field notes, invoicing, and related work). Digitizing and standardizing this workflow can preserve the rigor of the process while reducing rework and missed details. Examples of digitization include tying every field note to an asset ID, location, time, worker, and shift; using a mobile-guided handoff log with carryover actions; enabling voice-driven forms with auto-transcription; and generating AI-assisted shift summaries that are reviewable and traceable to the underlying entries.
Progress is a process: Toward a new wave of global competitiveness
The next wave of innovation could help shale operators reduce the US$8 to US$10 per barrel gap with their low-cost global counterparts and rewrite the US shale industry’s competitive model in the following ways.24
- Compounding innovation gains: Shale rebuilds 60% to 70% of its asset base annually, allowing operators to roll cost and process improvements across all their wells within 12 to 18 months.25 By contrast, conventional producers refresh only 5% to 10% of wells per year, limiting the impact of innovation on their total production.26 Like regular software updates by a technology company, frequent rebuild helps keep shale operators improving year after year. Put simply, shale’s steep decline curves—often viewed as its weakness—could be a competitive advantage.
- Resilient supply: The US O&G industry is the largest and most integrated O&G industry in the world, offering demand and supply optionality across domestic and export markets.27 As wellhead-to-customer and wellhead-to-terminal integration strengthens, US companies may have a greater cushion in their full-cycle breakeven to absorb price shocks, as opposed to others that are primarily guided by wellhead or half-cycle breakeven. Taken together, this could support viewing US shale as a more stable supply base, not a default swing producer.
- Smoother workforce cycles: US O&G workforce uncertainty should moderate at the margins as more work shifts toward tech- and data-centric roles (automation, remote operations, analytics, reliability), which are often less tightly tied to rig count. As US operators expand digitally enabled operating models and centralized monitoring or support, staffing needs can adjust with less uncertainty, making downcycles less volatile and upcycles less marked by rapid rehiring.
Continue the conversation
Meet the industry leaders
Zillah Austin
Nichelle McLemore
Peter Buettgen
Kevin Gregory
Kate Hardin
Anshu Mittal
By
Zillah Austin
Nichelle McLemore
Peter Buettgen
Kevin Gregory
Kate Hardin
Anshu Mittal
The authors would like to thank Abhinav Purohit, Ankhi Biswas, and Vamshi Guguloth for their extensive contributions to this report, including their extensive research, in-depth analysis, and narrative development.
The authors would also like to thank Michael Orton, Thomas Lochbichler, Christopher Bark, Josh Morgan, Steve Pankratz, Jason Foster, Marc Lebel, Chris Murphy, James Mahan, Kara Swain, Jacob Taylor, Kate Keller, Ade Olayinka, and Julia Tavlas for their subject matter input and review.
Finally, the authors would like to acknowledge the support of Clayton Wilkerson for orchestrating resources related to the report; Katrina Drake Hudson and Dario Failla for driving the marketing strategy and related assets to bring the story to life; Kaitlin Pellerin for leading public relations; Rithu Thomas, Aparna Prusty, and Pubali Dey from the Deloitte Insights team for editing the report and supporting its publication; and Harry Wedel for creating the visual design.
Cover image by: Sanaa Saifi
Knowledge Services: Agni Wagh
Visit the Deloitte Center for Energy & Industrials
Access more insights for the aerospace and defense, chemicals and specialty materials, engineering and construction, industrial manufacturing, mining and metals, oil and gas, power and utilities, and renewable energy sectors.