A shrinking workforce may thwart US manufacturing ambitions
The December 2025 Economics Insider explores trends in the US manufacturing workforce and the factors shaping those trends
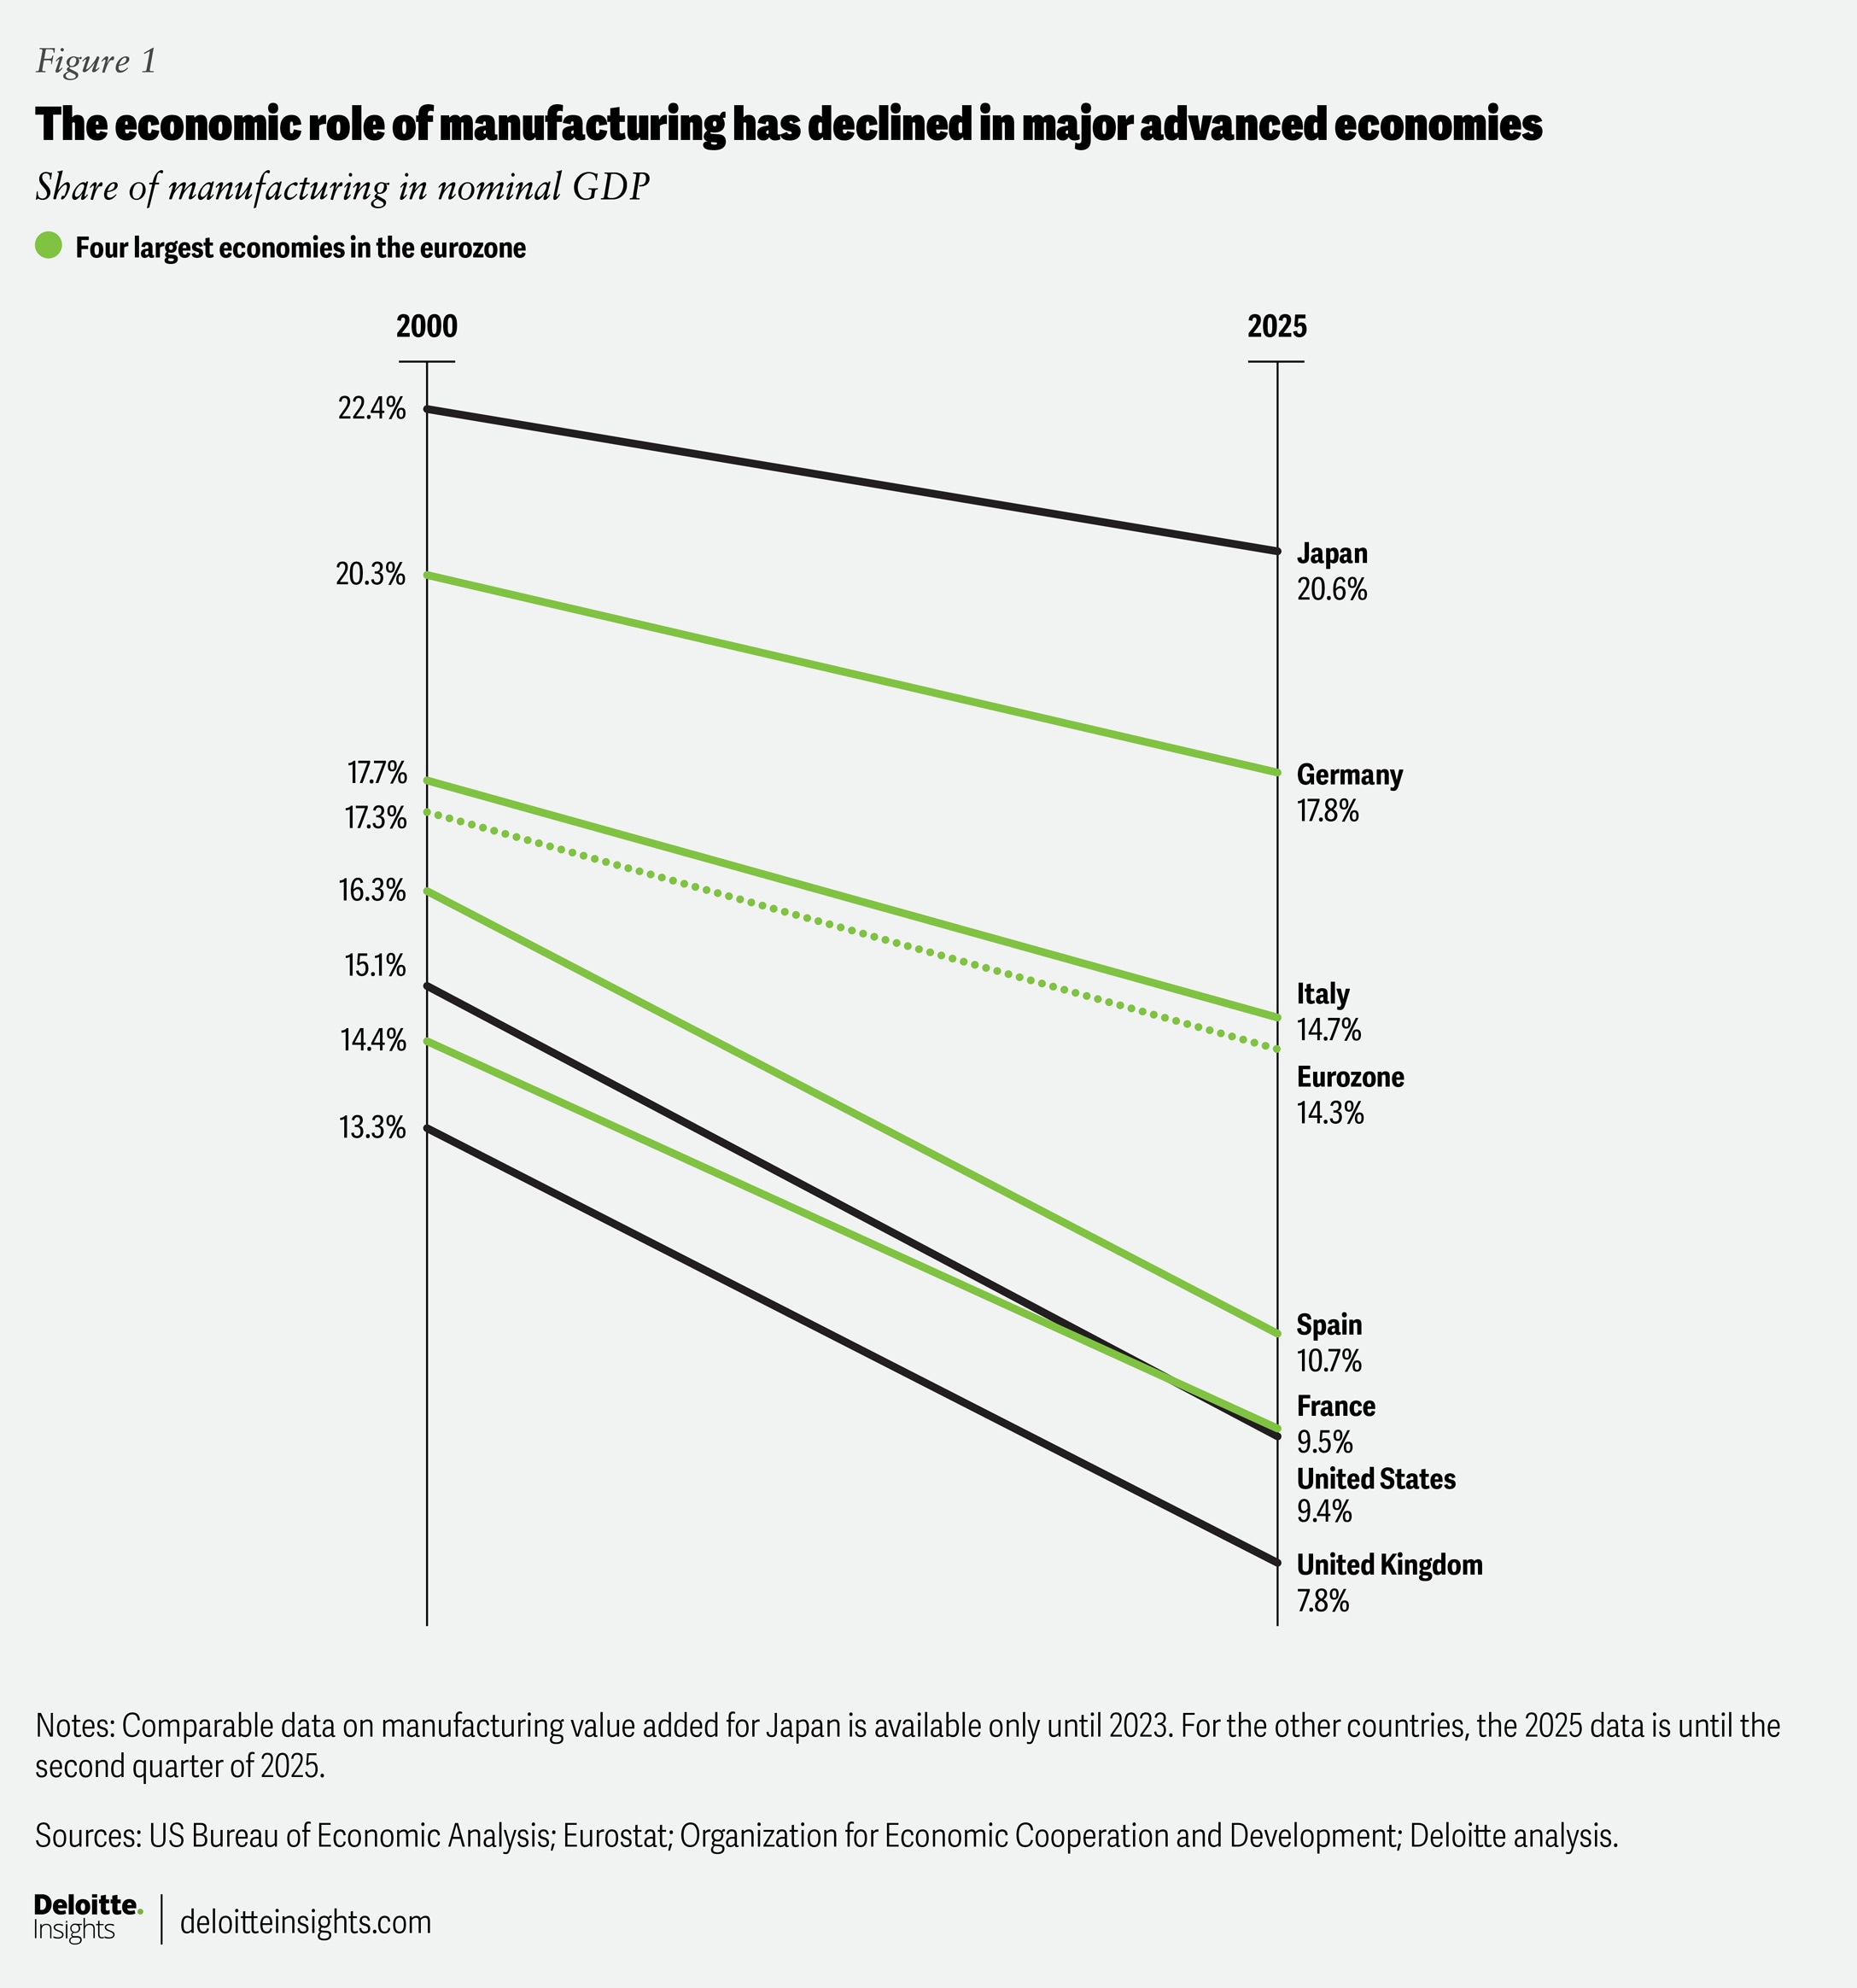
One of the major aims of the current US tariff policy has been to reshore manufacturing back to the United States.1 Over the years, US manufacturing has lost ground to services in its contribution to the overall US economy. Real gross value added (GVA) in manufacturing has grown at just 1.5% on average per year since 2000—lower than the corresponding 2.1% average annual growth in real gross domestic product.2 Hence, manufacturing’s 9.4% share in the economy (in the second quarter of 2025) is much less than the 15.1% it held 25 years ago.3
For the United States itself, tariffs may, however, not be the silver bullet needed to revive manufacturing. To drive growth, a sector may need not only trade protection and investments but also a skilled workforce with the right experience. As of September 2025, there were 12.7 million people on US manufacturing payrolls—well below the 17.2 million in 2000.6 Even if a mix of policy intervention and private sector participation to train potential workers were to succeed, any increase in the workforce will likely be in high value–added, capital-intensive sectors. Low value–added, labor-intensive manufacturing may remain in emerging and developing economies due to their surplus labor and wage competitiveness relative to the United States and other advanced economies.7
High value–added manufacturing has fared better
Within US manufacturing, major durable goods sectors have consistently outpaced others in growth. Since 2000, real GVA in durables manufacturing has risen by about 2.1% on average per year—nearly three times the pace seen in nondurable goods during this period. Out of the eight broad categories of nondurable goods, more than half have seen output decline during this period, with the sharpest contractions recorded in textile mills and products of such mills (a 2.9% decline on average per year) and in apparel, leather, and allied products (a 2.2% decline on average per year).
In contrast, durables have generally fared better, although real output has contracted for 5 out of 11 broad sectors (figure 2). The biggest increase has been in computer and electronic products: real GVA for this sector is up 6.9% on average per year since 2000. Other sectors within durables to witness strong growth are primary metals; motor vehicles, bodies and trailers, and parts; and other transportation equipment (figure 2).
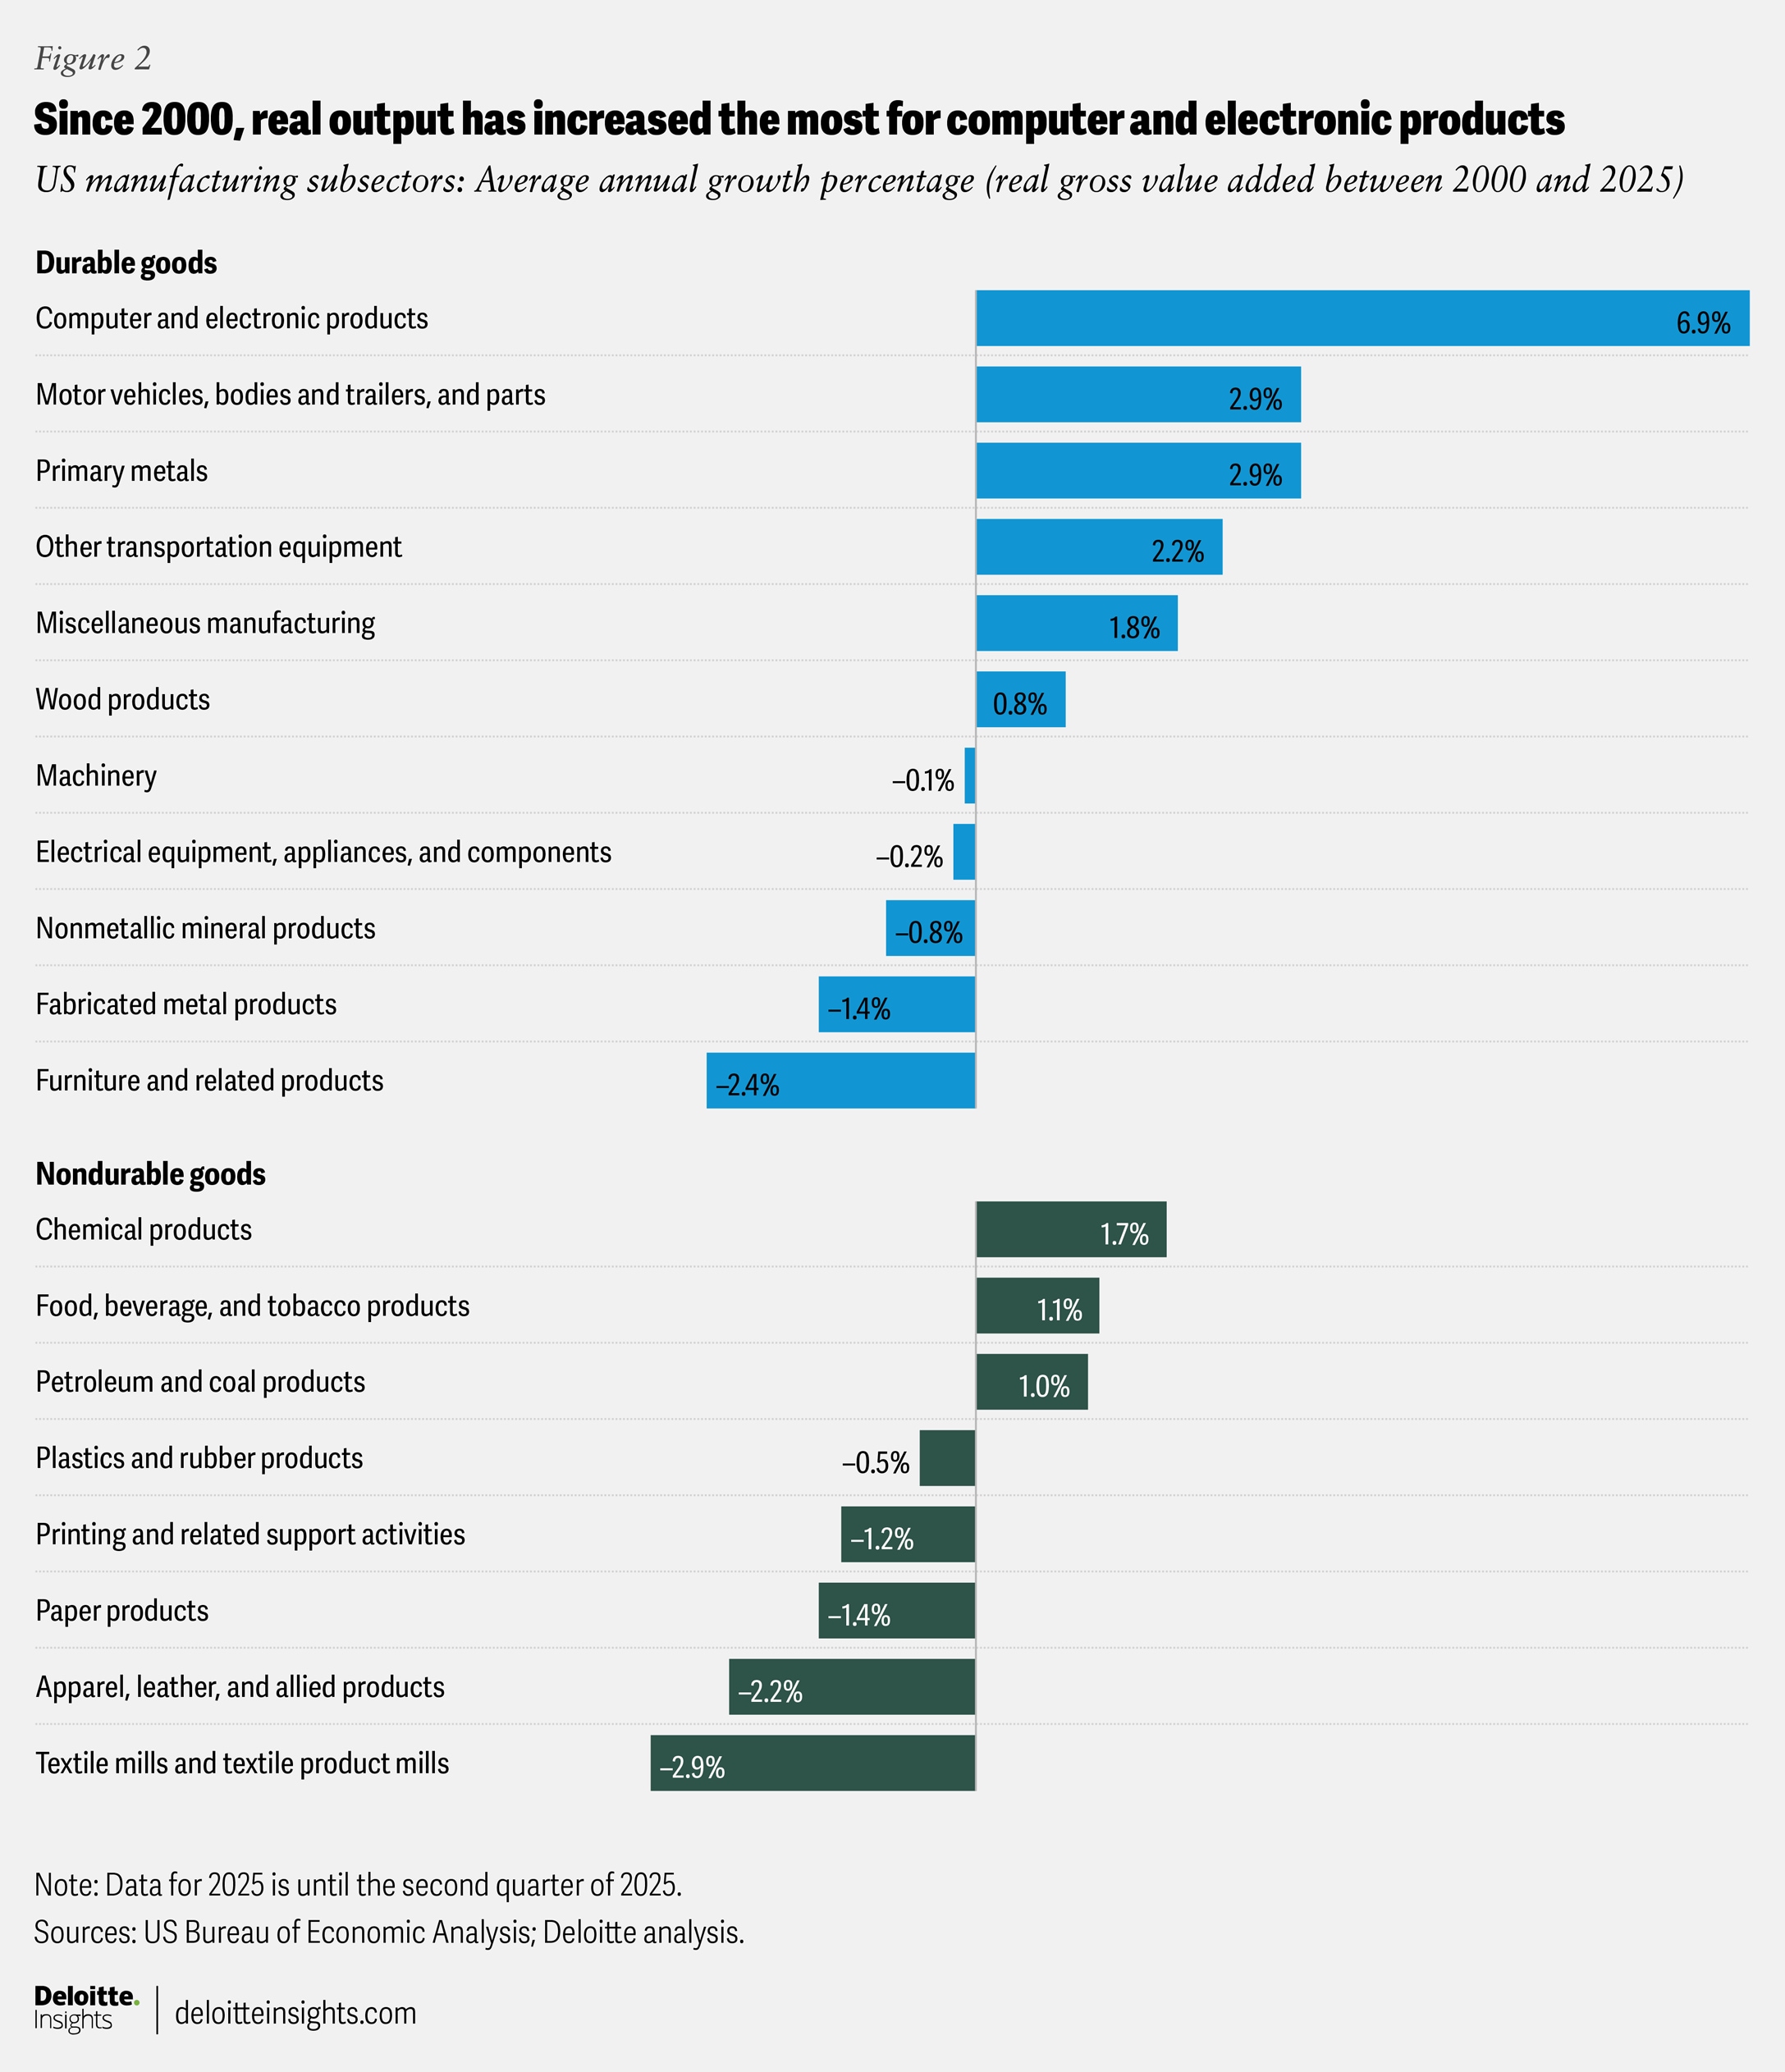
Figure 2 also illustrates how high value–added and capital-intensive sectors have consistently performed better than low value–added ones such as textiles, apparel, paper products, and furniture. Primarily, this is due to two reasons: First, advanced economies like the United States have focused on high-skill, high value–added manufacturing and services.8 This trend is likely to intensify, especially given the sharp increase in investment in technology in recent years, including AI-related investment, with more commitments on the way.9 Second, global value chains have reshaped the way goods and services are produced and exchanged across the world. According to the Organization for Economic Cooperation and Development, nearly 70% of global trade now takes place through these global value chains.10 In manufacturing, most of these supply chains are structured in a way that low value–added manufacturing has shifted to emerging and developing economies with surplus labor and lower wages.11
Employment patterns have shifted in tune with the changing nature of US manufacturing
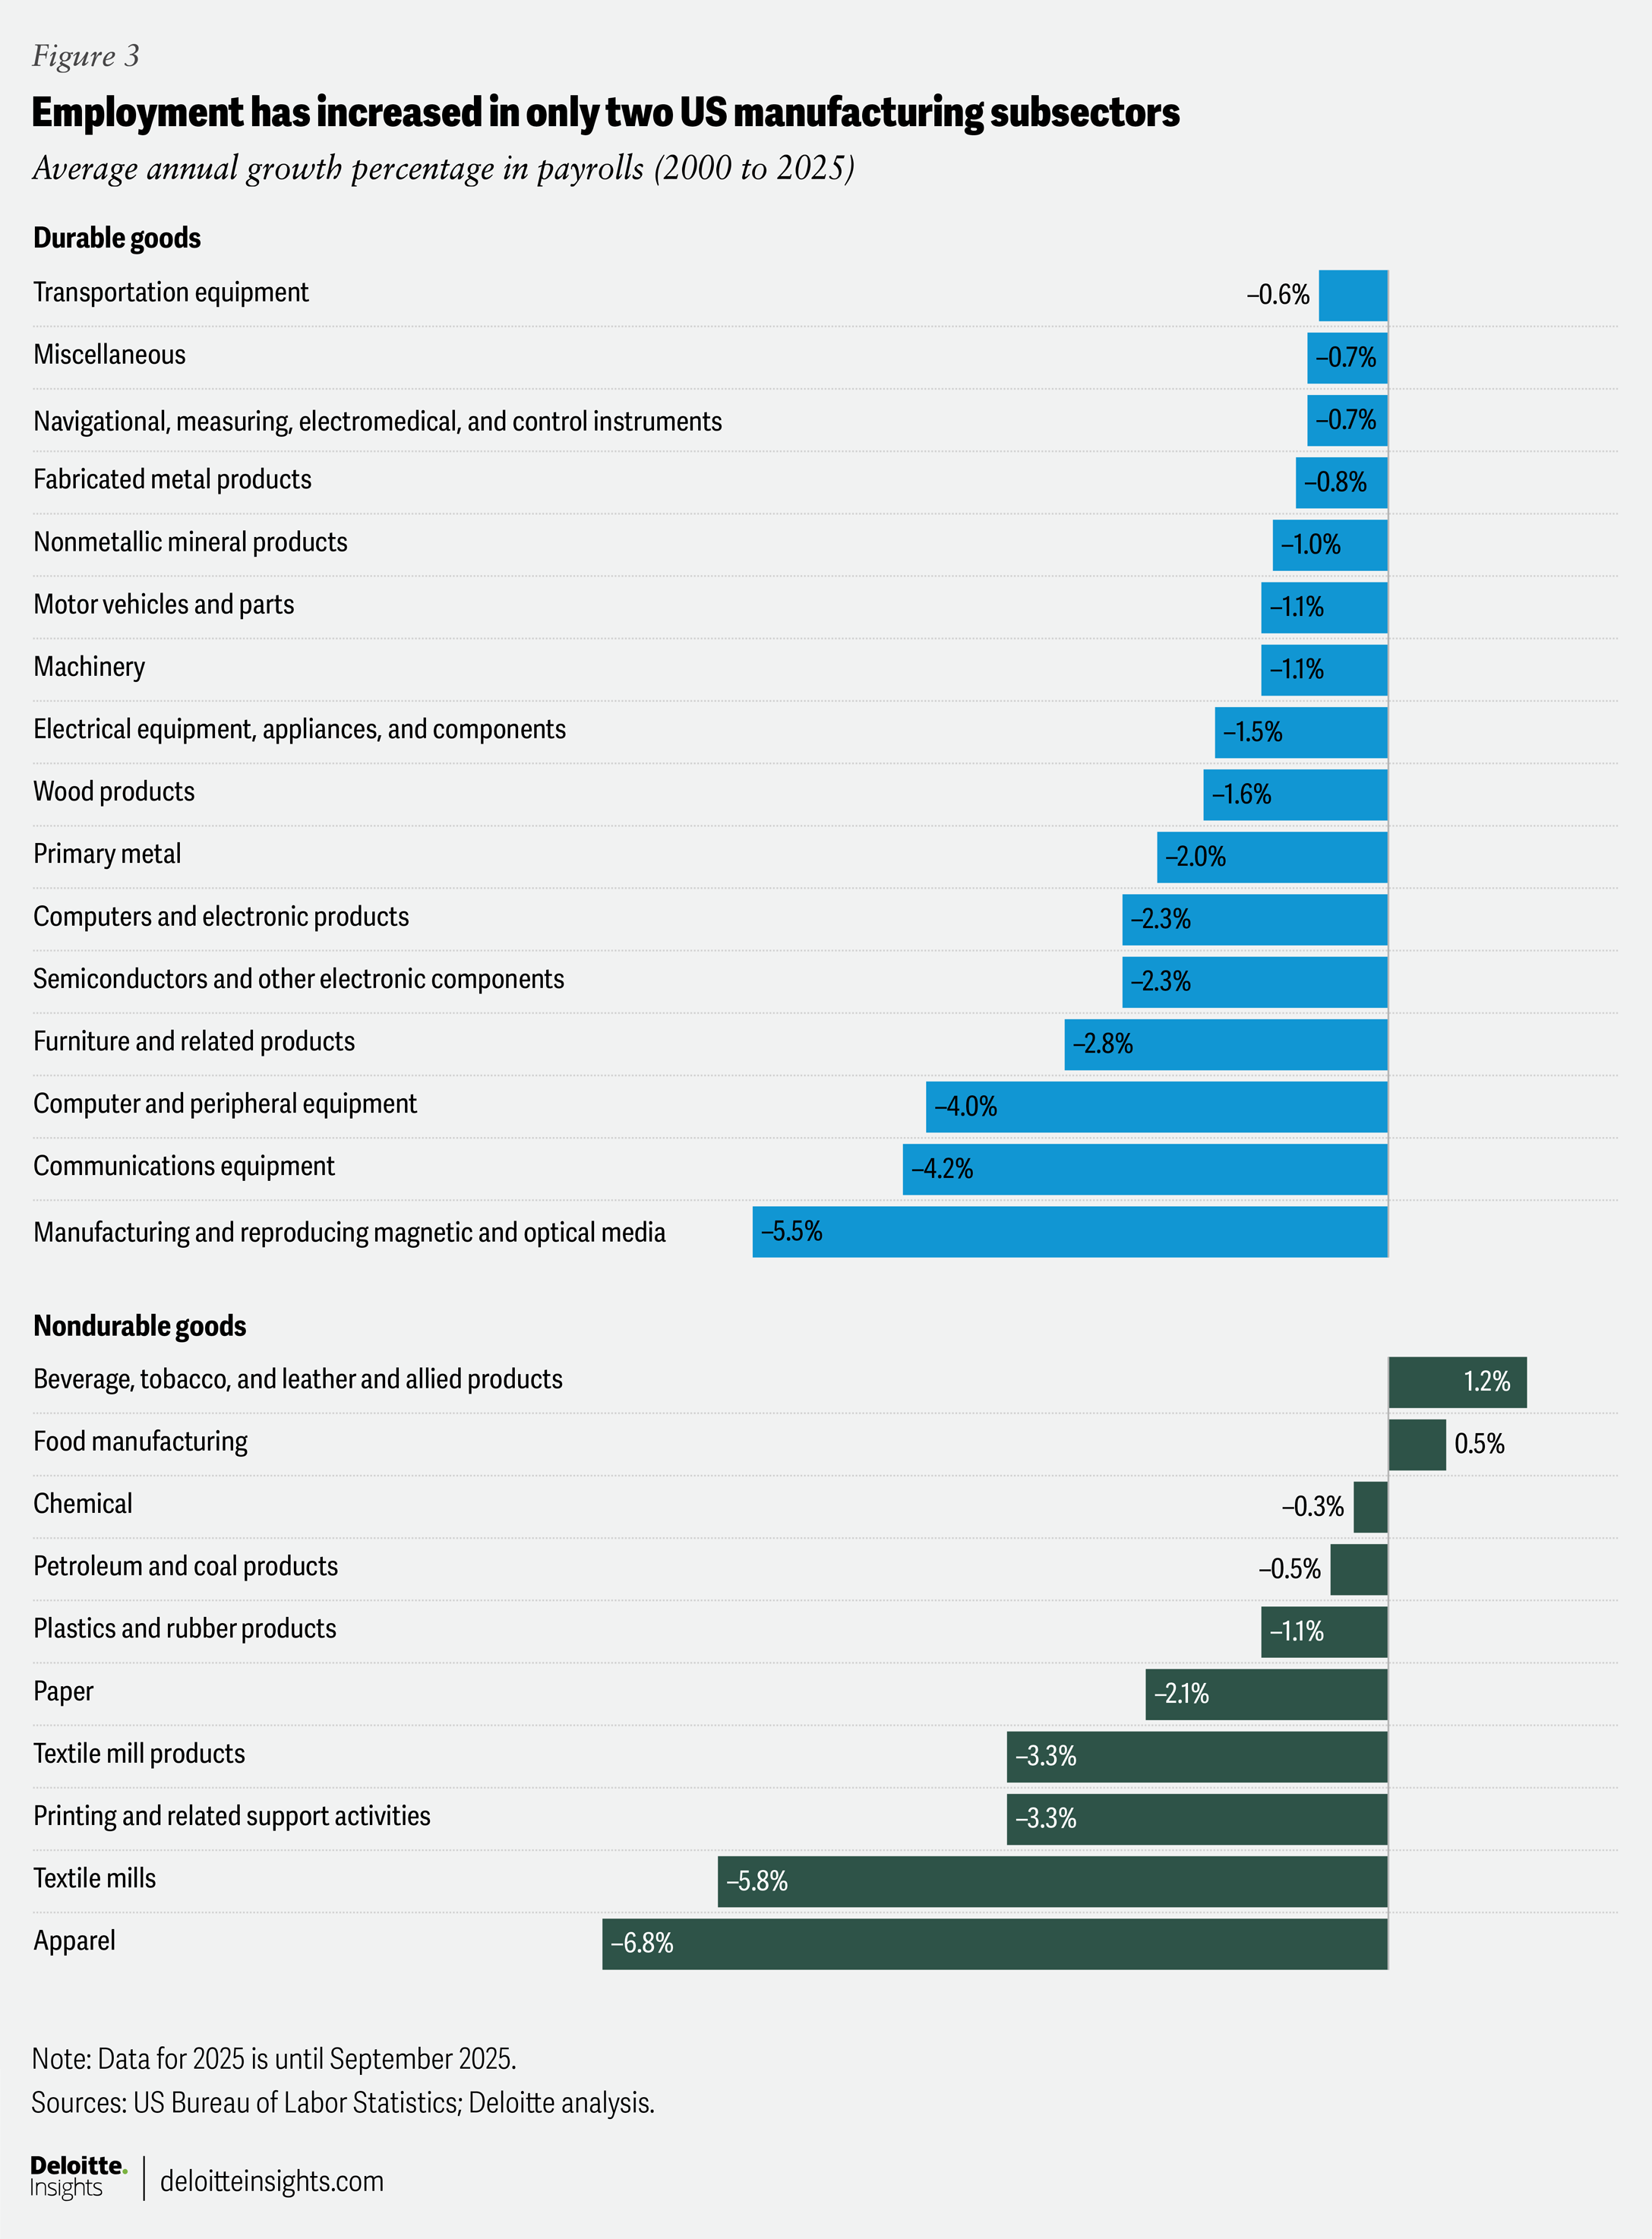
Shifting trends in manufacturing output have led to changes in employment in key labor-intensive sectors within manufacturing. Between 2000 and 2025, the fastest decline in payrolls was in apparel (a 6.8% decline on average per year), followed by textile mills (5.8% decline on average per year). That’s not surprising, given that output in these sectors has declined sharply over the years (figure 2).
Payrolls, however, have declined over the years in key durables sectors with strong GVA growth (figure 3). Payrolls in computer and electronic products manufacturing, for example, have declined by 2.3% on average per year between 2000 and 2025 despite real GVA growth during that period. The trend is similar for sectors like transportation equipment and primary metals.
What explains this dichotomy? First, this is due to high value–added manufacturing that the United States focuses on, primarily using its high-skilled labor. These sectors are usually tech-heavy and capital-intensive.12 And with strong productivity gains over the years, these sectors haven’t produced the employment gains13 that low value–added manufacturing has created in labor-surplus emerging and developing economies.14 Labor productivity in US manufacturing, as measured by real output per hour of all people employed in the sector, has risen by 42.2% since 2000, with almost all gains taking place in the period up to 2010.15
Second, manufacturing global value chains also include a host of services such as research, design, computer coding, and marketing, thereby enabling the spread of these activities across different firms.16 For example, services such as customer support and marketing may not be handled by the firm that is manufacturing and designing computers and electronic products or automobiles.
Occupational composition of the US manufacturing workforce has also changed
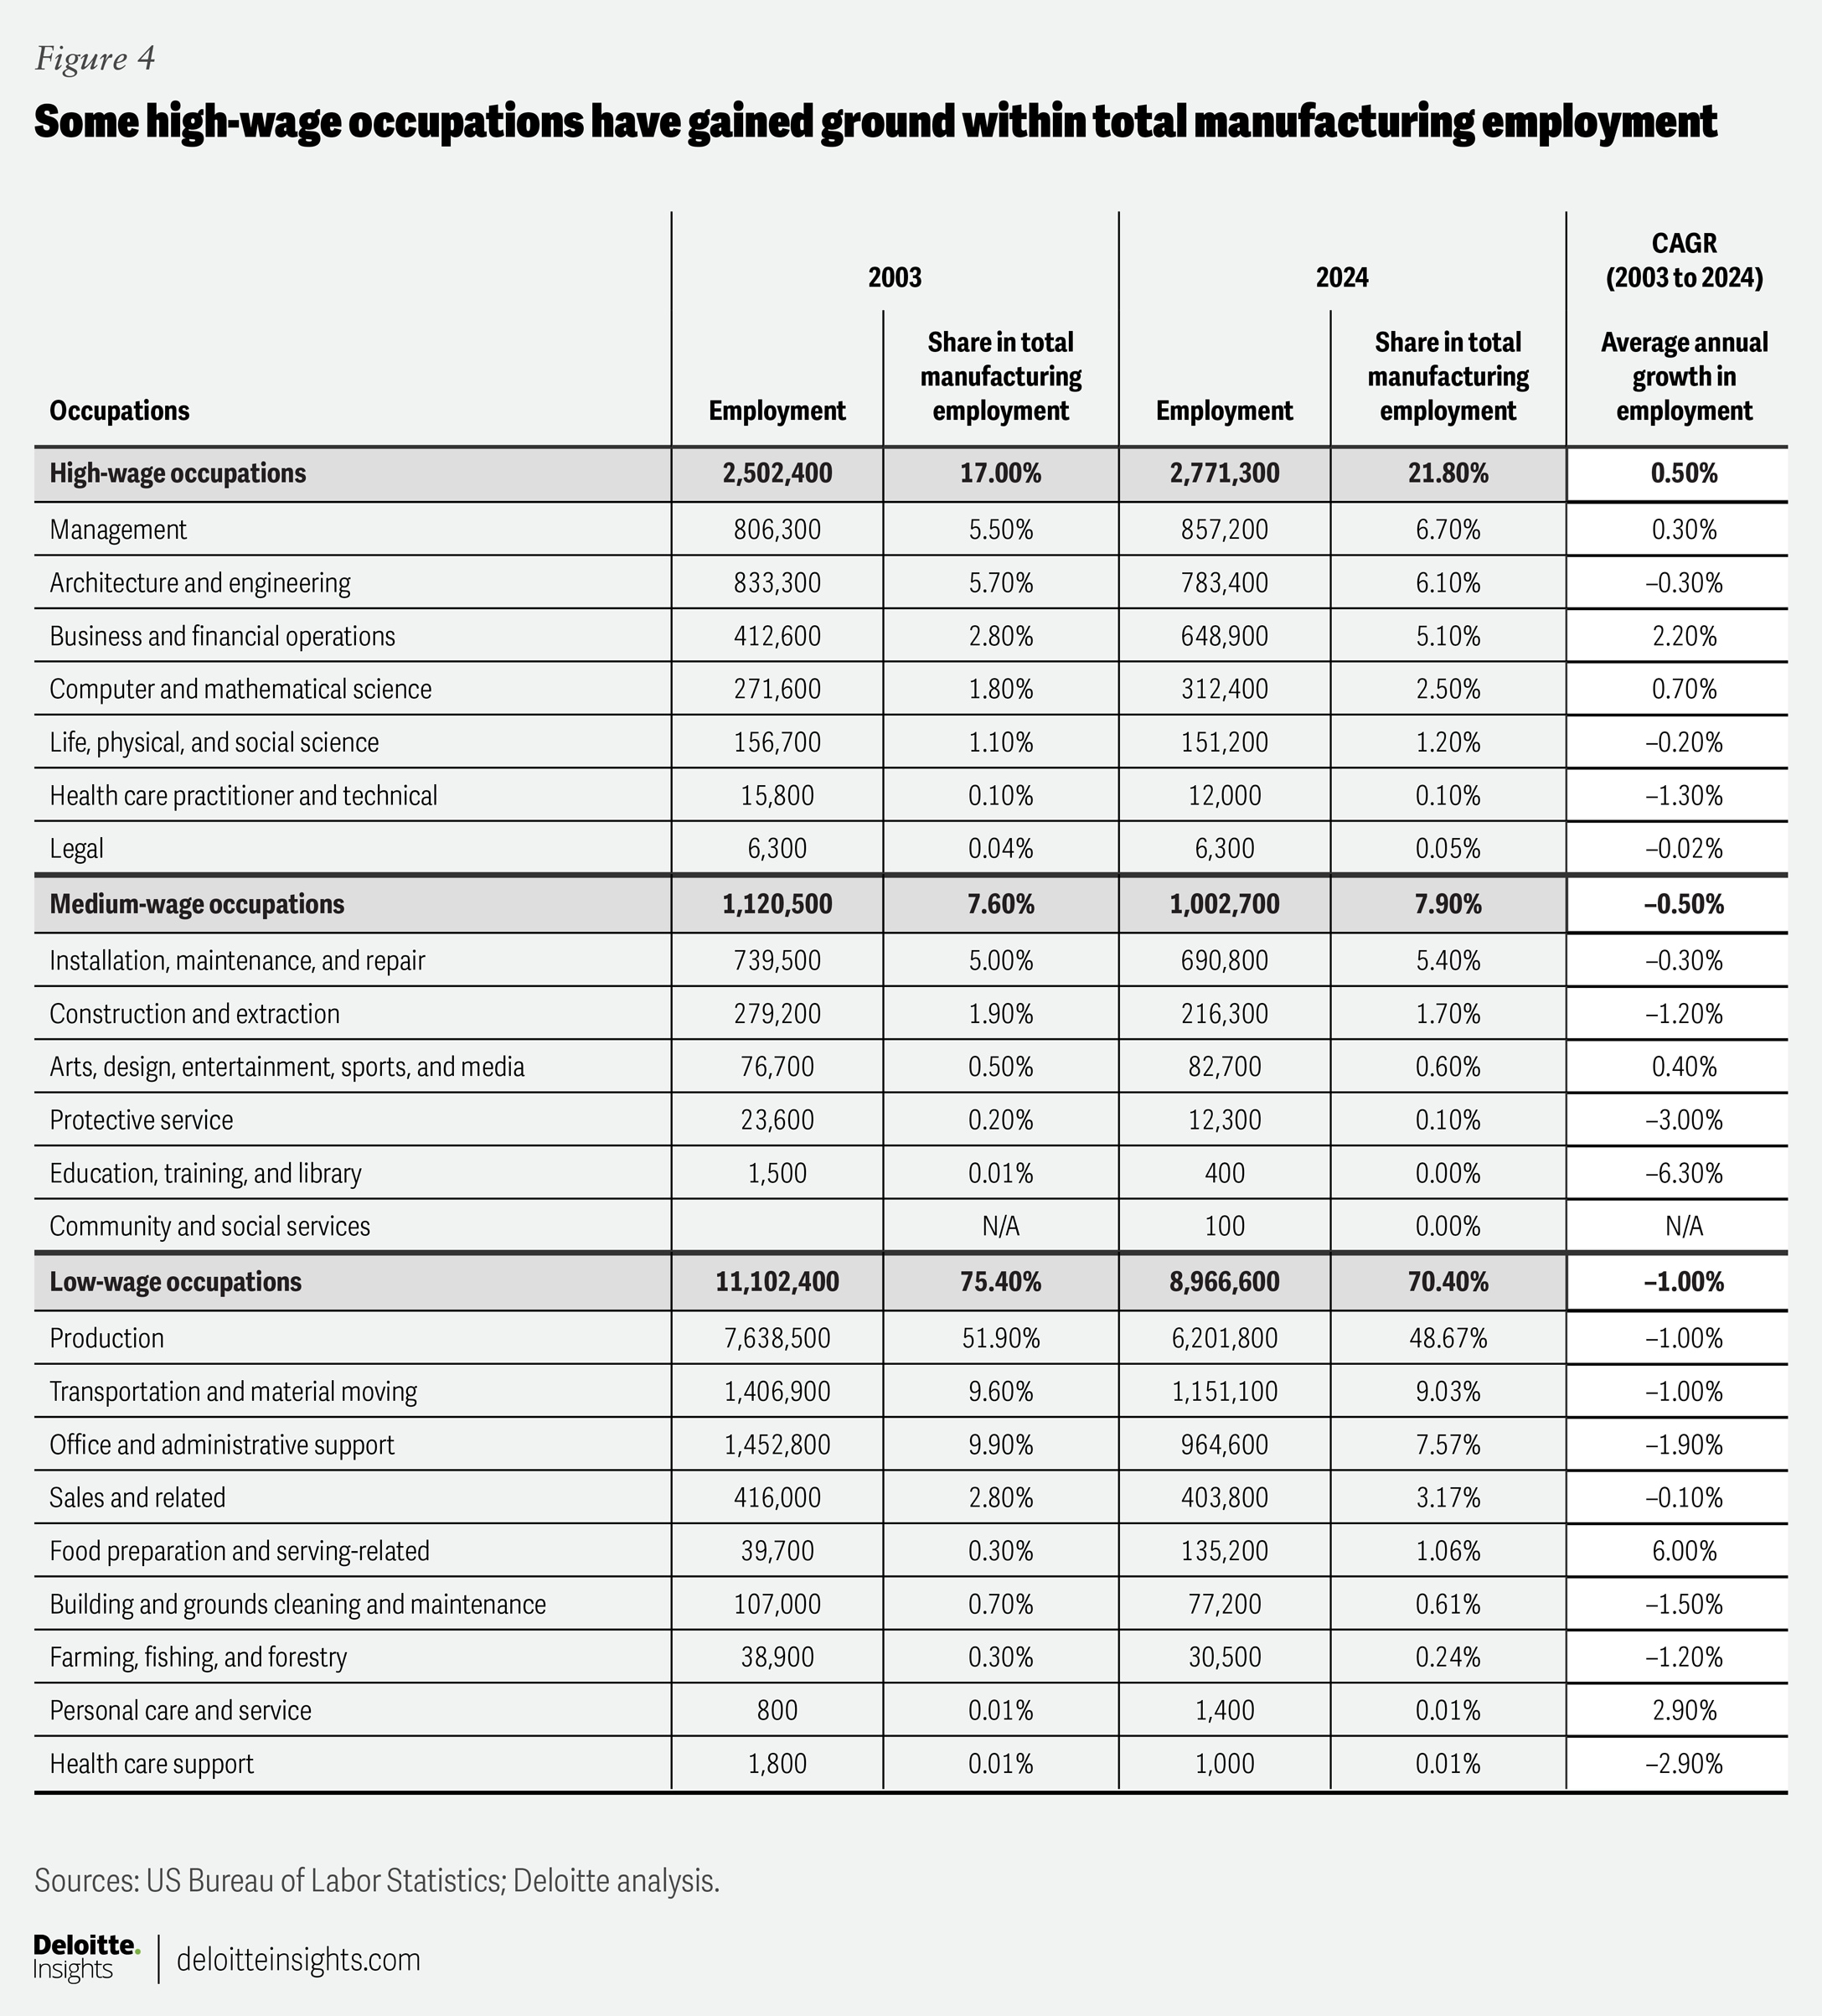
Changes in the manufacturing workforce are also evident from occupational employment and wage statistics from the Bureau of Labor Statistics.17 Production occupations,18 which include assemblers and fabricators, machinists, tool and die makers, and metal and plastic machine workers, continue to account for the largest share of manufacturing employment, but their role is receding. In 2024, these jobs made up 48.7% of total manufacturing employment—lower than their 51.9% share in 2003. This decline stems from automation, rising productivity due to new technology, and higher outsourcing.19
During the same period, occupations such as health care support, office and administrative support, and building and grounds cleaning and maintenance also witnessed declining employment, thereby reducing their shares of total manufacturing employment (figure 4). This is likely due to the outsourcing of certain services to other firms,20 while technological progress (like word-processing or accounting software) has reduced the need for office and administrative support personnel in the wider economy.21
The share of low-wage occupations22 in the manufacturing workforce has declined—but remains high—relative to high-wage occupations (figure 4). Within high-wage occupations, the shares of business and financial operations, computer and mathematical science, and management have risen. In the overall economy, computer and mathematical science occupations constitute more than 80% of the tech workforce, which in turn has been growing steadily over the years.23 A similar trend is visible within the manufacturing workforce as well: As high-tech manufacturing has gained ground, the share of computer and mathematical science occupations has increased.
The US manufacturing workforce may grow but gains may be limited
As commitments to set up more production units in the United States increase—aided by new trade agreements like the one with the European Union, Japan, and South Korea24— their success will depend not only on achieving cost effectiveness due to tariffs25 but also on the availability of a skilled workforce. In August 2025, there were approximately 409,000 unfilled positions in manufacturing.26 By 2033, the industry may need 3.8 million new workers, with nearly 1.9 million of those roles at risk of going unfilled if preexisting workforce challenges remain unaddressed.27 In a survey of over 500 manufacturers in early 2025 by the Reshoring Initiative, 30% of original equipment manufacturers (OEMs) responded that they would reshore production to the United States if the “workforce had higher skills and were in abundant supply.”28 The same survey shows that a skilled workforce is a bigger focus for these OEMs than policy (like tariffs and taxes), regulations, and currency movements.29
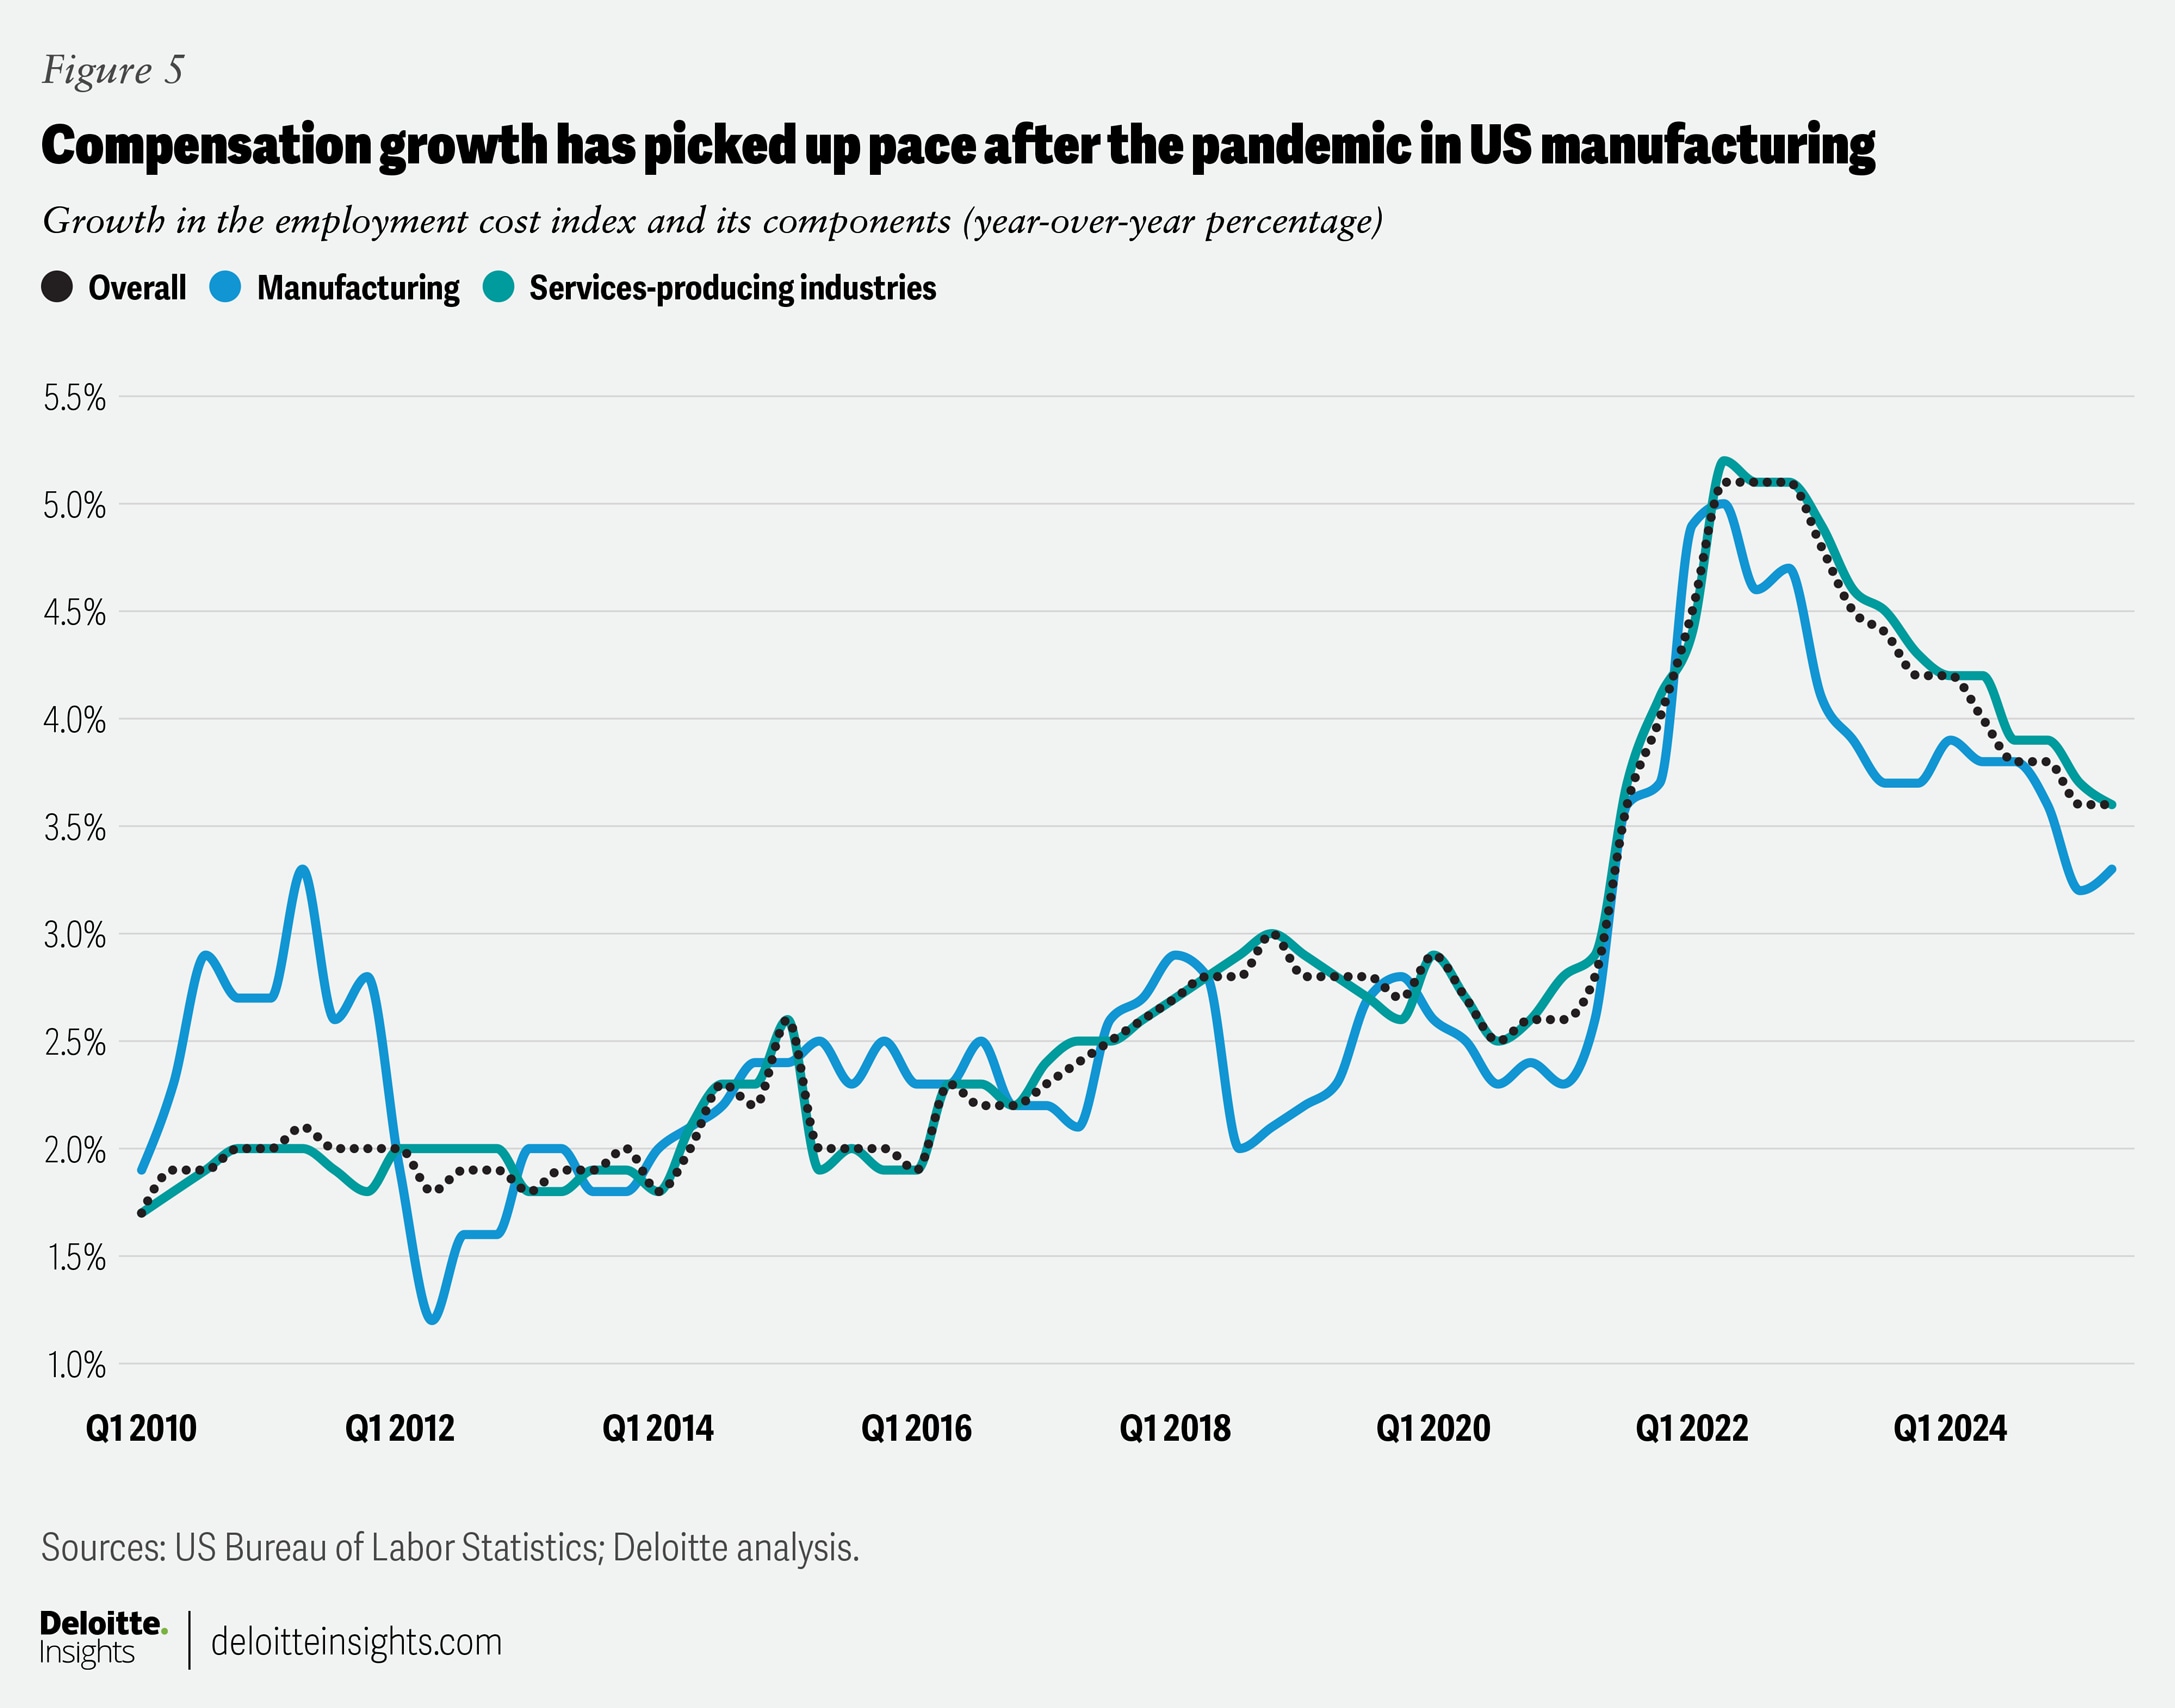
One way to attract more talent is higher wages. Indeed, wage and compensation growth in manufacturing has been roughly keeping pace with that in services-producing industries since the pandemic (figure 5).30 And manufacturers have also been focusing on improving the workforce experience to attract and retain employees.31 Nevertheless, getting additional skilled workers ready to run new production facilities will not only require interested workers but also adequate training, potentially incentivized by public policy.
It may also require skilled foreign workers to run and oversee manufacturing facilities initially while training US workers for the future.32 And since population growth has slowed in the United States over the years, a larger workforce may also need more immigrant workers to fill gaps in low- to medium-skilled roles. In fact, analysis by the Bureau of Labor Statistics suggests that, in 2024, foreign-born workers were more likely to be employed in production, transportation, and material-moving occupations compared to native-born workers.33 Recent restrictions on immigration,34 however, will likely present some challenges.
Finally, the reshoring of labor-intensive manufacturing back to the United States is expected to cost money and time, even with high tariffs in place. It may just lead to an inefficient allocation of resources, thereby raising costs for producers and consumers.35 As tariff rates stabilize, manufacturers may still prefer to keep low-value operations in emerging and developing economies while passing on part of their tariff costs to consumers.36
by
Akrur Barua
Ruhika Agarwal
The authors would like to thank Ira Kalish, chief global and US economist, and John Morehouse, US research leader for Industrial Products Manufacturing, for their reviews and suggestions.
Editorial (including production and copyediting): Arpan Saha, Sayanika Bordoloi, and Anu Augustine
Design: Harry Wedel and Govindh Raj
Audience development: Atira Anderson
Knowledge services: Bichapogu Rishitha
Cover image by: Harry Wedel
Visit the Deloitte Global Economics Research Center
Access more insights for the consumer spending, housing, business investment, globalization & international trade, fiscal & monetary policy, sustainability, equity, & climate, labor markets and prices & inflation sectors.