2026 Global Hardware and Consumer Tech Industry Outlook
AI is reigniting hardware growth, redefining data centers, and reshaping hybrid computing—while trust emerges as a key driver of consumer spending
In 2026, the enterprise hardware technology landscape is being reshaped by the accelerating requirements of artificial intelligence—from the explosive growth of AI servers and next-generation data centers to the rise of hybrid, multitier computing (or “compute”) architectures. At the same time, consumer demand for new digital experiences continues to rise amid uneven financial realities.
AI demand is causing enterprise hardware revenue to grow, even as PC sales may weaken due to rising memory prices. Data centers are reinventing themselves around higher power, liquid cooling, and ultra-fast optical networks, raising new prospects—and pressures—across the hardware ecosystem. Enterprises are adopting more deliberate hybrid cloud strategies to manage the cost, latency, and sovereignty needs of AI workloads. And in the consumer market, a K-shaped economy and a call for data responsibility are shaping tech purchasing, putting a premium on trusted innovation. Together, these forces define what will likely be a pivotal year for hardware and consumer tech and create new opportunities for leaders to innovate and differentiate.
table of contents
- State of the market
- AI transforms enterprise hardware
- Growth opportunities from AI data centers
- Mix of on-premises, cloud, and edge computing
- Competing for consumer trust
- Strategic considerations
The rapid expansion of AI workloads is driving unprecedented growth: The global AI infrastructure market has demonstrated high double-digit gains over several years and is expected to reach US$758 billion by 2029.3 Indeed, in the second quarter of 2025, spending on compute and storage hardware for AI deployments surged 166% year-over-year to US$82 billion, underscoring AI’s emergence as a key driver of enterprise hardware demand.4
AI infrastructure expansion is also reshaping the semiconductor market. Demands for AI-optimized processors, edge-computing devices, and high-performance chips are driving strong semiconductor growth: Global revenues were forecast to rise over 22% to US$772 billion in 2025, then another 25% to US$975 billion in 2026.5
On the consumer tech front, after several years of muted demand, 2025 delivered solid global growth. Spending rose about 3% to roughly US$1.3 trillion—led by China, the Middle East, and Africa, with North America remaining steady.6 2026 global consumer tech spending is expected to be flat overall.7 In the United States, consumer tech spending is projected to reach US$565 billion in 2026, representing a 3.7% growth.8
The smartphone market appears to be stabilizing after recovery, but it still faces near-term cost and supply challenges. Global smartphone shipments were projected to grow 1.5% in 2025 to 1.25 billion units, before potentially contracting as much as 5% in 2026 as memory chip shortages and costs weigh on production.9 Despite softening volumes, average unit prices were expected to reach $465 in 2026, pushing overall market value to an anticipated record US$578.9 billion.10 The global PC market also showed renewed momentum, with shipments rising an estimated 9.6% year-over-year in the fourth quarter in 2025. However, analysts expect the memory chip shortage to fuel a volatile 2026 for PCs, and they anticipate potential price increases and shipment declines of up to 9%.11
The wearables segment continues to outperform expectations, with 136.5 million units shipped in the second quarter of 2025, representing a 9.6% year-over-year increase.12 2026 is shaping up to be the year the category matures beyond wrist-worn devices and basic fitness tracking toward AI-enhanced, health-centered and diversified form-factor products that offer deeper insights.13
About Deloitte’s TMT Center Outlooks
Deloitte’s 2026 global hardware and consumer tech industry outlook seeks to identify the strategic issues and opportunities for tech companies and other parts of the tech supply chain to consider in the coming year, including their impacts, key actions to consider, and critical questions to ask. The goal is to help equip companies across the tech ecosystem with information and foresight to better position themselves for a robust and resilient future.
Hardware eats the world again: AI transforms the global enterprise hardware industry
AI chips are only one way AI is benefitting the hardware industry: They need to be integrated into racks and boxes and servers and more. Traditional tech enterprise hardware companies are doing that integration.
As recently as 2023, enterprise caution driven by macroeconomic pressure pushed worldwide server shipments down 19.4%, and the “traditional” (x86) server market grew just 2.3%.14 Fast-forward two years, and the market for all servers nearly doubled from a year earlier.15 Analysts projected that the market would exceed US$455 billion in 2025, reflecting an annual growth rate of 80%, largely driven by expanding demand for AI-optimized infrastructure.16
AI-optimized servers are growing much faster than traditional (x86) servers. In 2025, x86 server revenues were projected to grow nearly 58%, while non-x86 architectures—spanning ARM (advanced RISC machine) and GPU-centric designs specifically designed for AI workloads—are expected to surge by roughly 169%.17
AI servers can be racks in gigawatt-scale data centers or smaller boxes in wiring closets in medium-sized enterprises. Some hardware companies are revising their overall growth forecasts through 2030 to two or three times higher than before AI compute demand began rising.18 This surge is being driven by the current hypergrowth in servers for AI data centers, which accounts for 20% to 70% of revenues for selected major hardware makers.19 These servers are expected to continue expanding in 2026 and 2027, though the growth rate may moderate.20
At the same time, the global AI chip market is likely to near $500 billion in 2026.21 But those $25,000 chips22 cannot just be “plugged into” existing data center equipment. These chips require specialized packaging, cooling, power, and communication networks, all placed inside the smallest, most reliable, and easiest to maintain configuration possible.23
This work is done by original equipment manufacturers (OEMs), original design manufacturers (ODMs), and electronic manufacturing solutions (EMSs), which make subsystems that supply the OEMs and ODMs (there is occasional overlap as well). The five largest OEMs and ODMs that make AI servers are Cisco, Dell, HPE, Lenovo, and Supermicro,24 while the larger AI EMS players include Foxconn, Luxshare, Pegatron, Quanta, and Wistron.25
Manufacturing of PCs and non-AI servers is a mature industry with generally well-known design challenges, along with modest growth rates and weak ability for manufacturers to differentiate. In contrast, these AI boxes, either in data centers or for on-premises compute, are already complex and evolving daily, with new chips, new configurations, and greater room for hardware makers to shine. However, over-reliance on AI as a growth driver could lead to vulnerability in case of a downturn.
Strategic questions to consider
- How can hardware companies invest and grow capacity for making AI servers while hedging against potential uncertainty?
- What organizational capabilities, leadership competencies, and technical talent will companies require to excel in a market defined by intricate thermal demands, advanced interconnect architectures, and fast-moving system design challenges?
- How should geopolitical risks, especially in semiconductor supply chains and critical component manufacturing hubs, influence companies’ long-term manufacturing footprint and partnership strategies?
Next-generation AI data centers present new growth opportunities in tech hardware
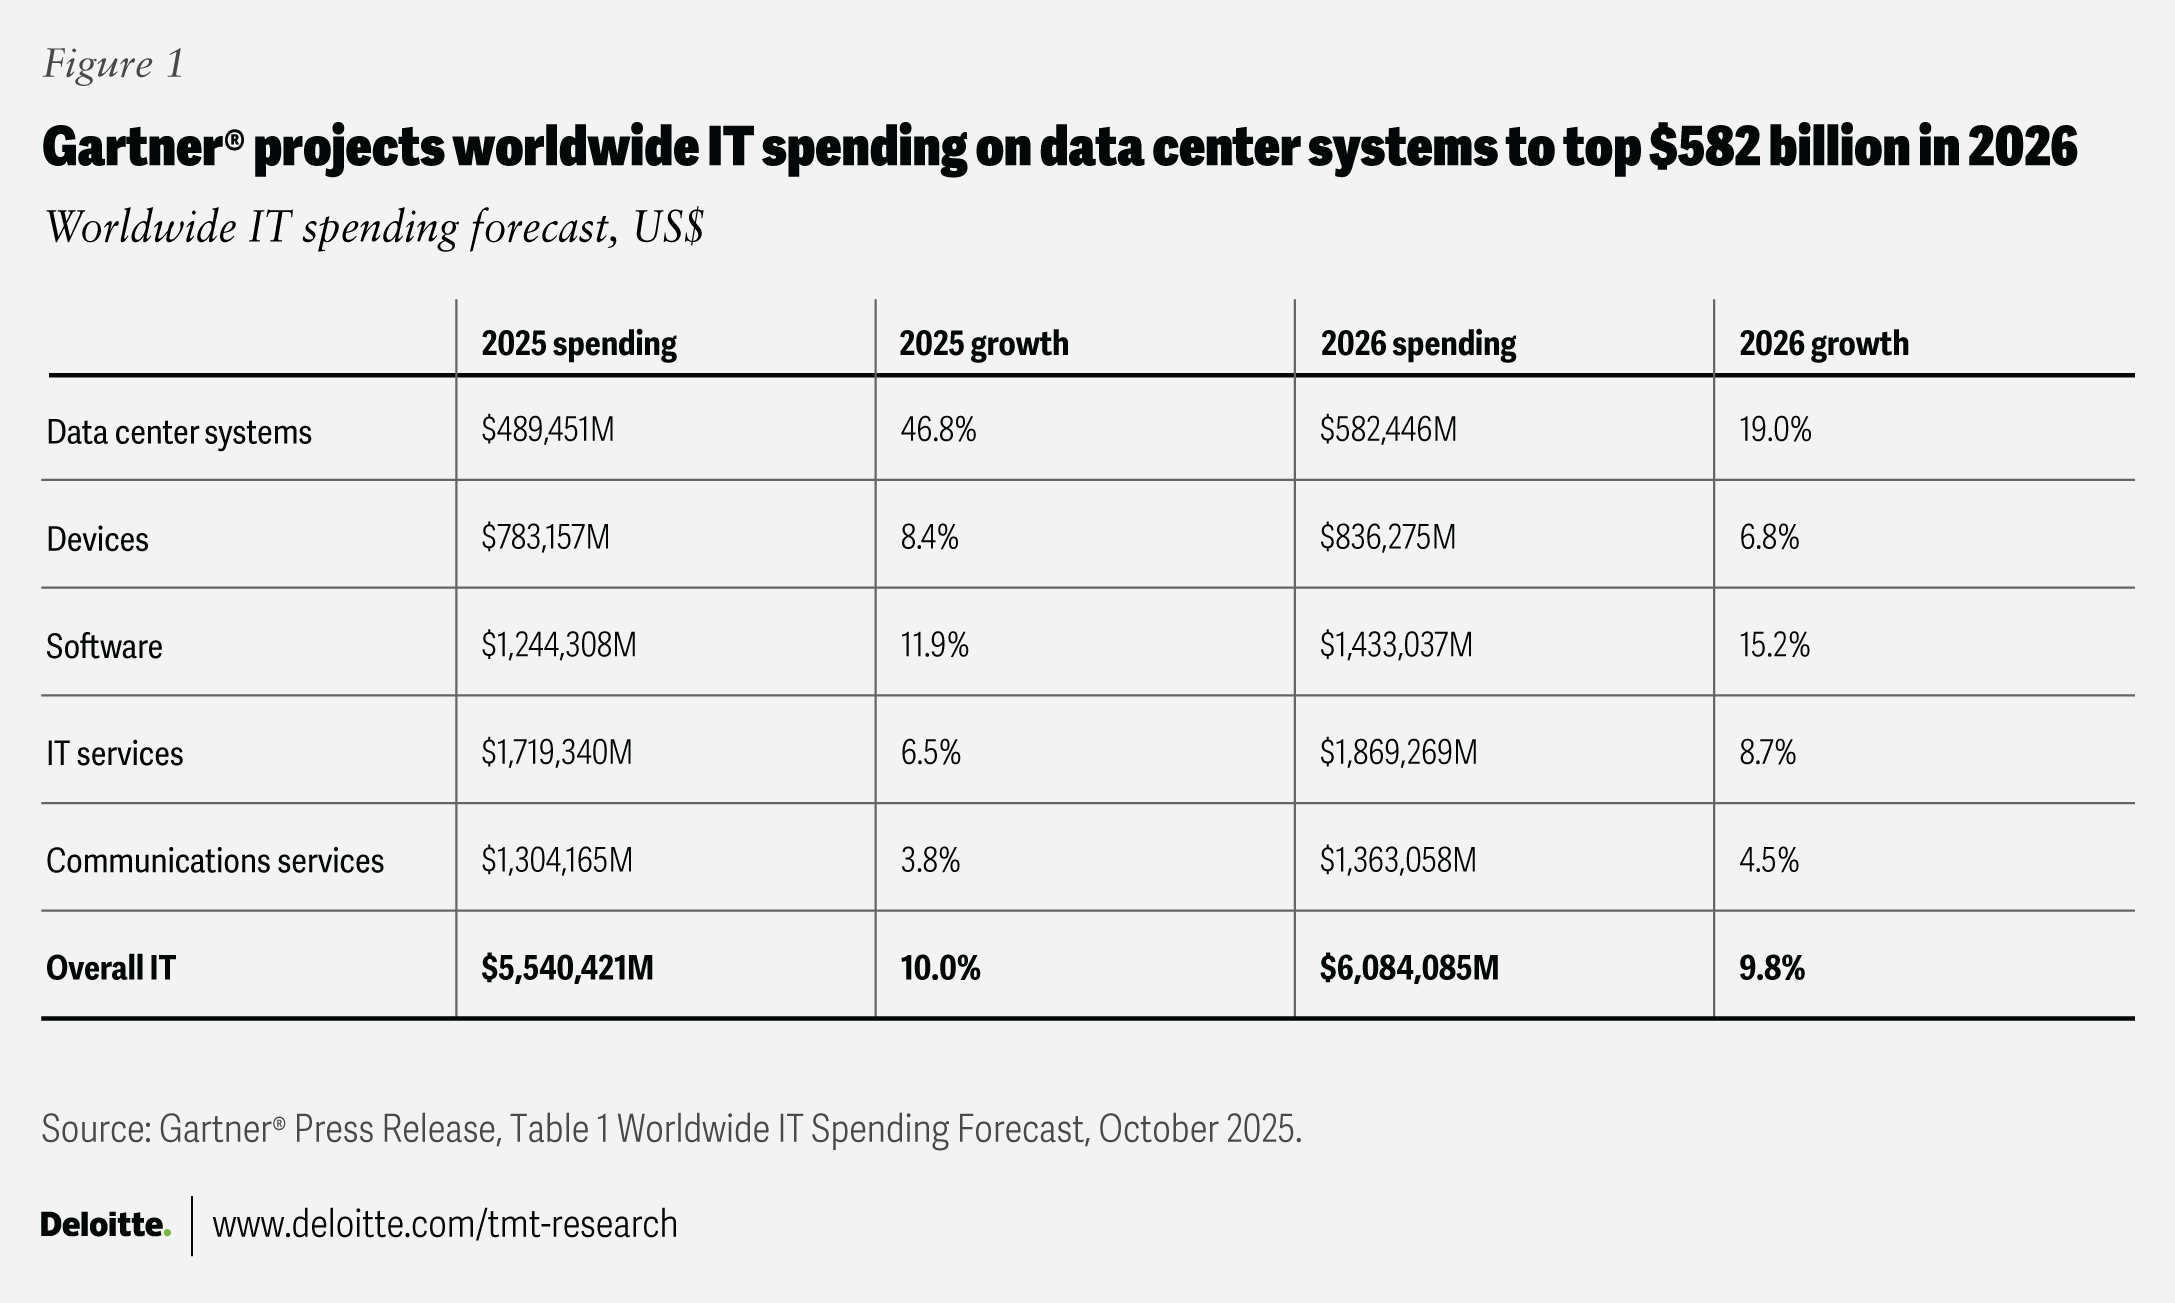
Tech hardware and equipment, such as power and cooling equipment for racks, storage hardware, and networks, will likely account for one-third of the anticipated $582 billion in data center spending in 2026, with chips making up the other two-thirds.26 Most of these technologies are relatively new when compared with those in traditional, non-AI data centers.
Traditional, kilowatt-scale racks typically rely on 54-volt in-rack power distribution, but megawatt-scale racks will demand much higher voltages.27 Moreover, as AI racks’ power consumption grows, demand for liquid cooling solutions will also rise. Older data centers used less than 10 kilowatts (kW) per rack, but with next-gen AI racks operating at 370 kW in 2026,28 liquid cooling is rapidly becoming a necessity.29 Both higher-power distribution architectures and liquid cooling solutions, purpose-built for AI data centers, represent small but fast-growing markets, with strong growth expected as AI workloads drive higher rack densities and infrastructure redesigns throughout the decade. The AI server power supply market is projected to grow from US$1.5 billion in 2024 to over $31 billion in 2028.30 And the liquid cooling market is expected to grow a hundredfold, from $300 million in 2024 to over $30 billion in 2028.31
AI data centers also need ultra-fast connections within and across racks. These can be copper-based (Ethernet or InfiniBand), but many are moving to fiber optics.32 This accelerated shift in 2026 toward high-speed optics will fuel demand for advanced AI network and communications infrastructure solutions. Growth in gen AI networking equipment is off a high base, but still significant, projected to grow from about $8 billion in 2023 to $34 billion in 2028.33
As AI workloads in 2026 shift toward inference, high bandwidth flash (HBF) may emerge as an alternative to high bandwidth memory (HBM) in integrated AI systems, potentially opening new opportunities for traditional flash storage companies. Importantly, HBF promises to serve as near-memory (sitting close to an AI graphics processing unit (GPU, or accelerator), offering 8 to 16 times more capacity at roughly the same cost as HBM.34
Making next-gen AI racks will require deeper coordination between power semiconductor companies (including silicon carbide and gallium nitride compound power chip players); chip design players involved in developing AI GPUs, accelerators, and application-specific integrated circuits; power system and component suppliers; tech hardware OEMs and ODMs selling servers, storage, and network solutions; data center electric power infrastructure solution providers; and data center operators.
In 2026, “validated” and “certified” rack architectures and solutions will likely become more crucial for server and network OEMs, to drive interoperability, fast deployment time, and ease of integration. Moreover, solution providers and OEMs should consider integrating liquid and hybrid cooling solutions into their designs.
Strategic questions to consider
- What are the various factors to plan for—across rack-scale design, AI architectural shifts, DC power standards, and AI-optimized products—when designing hardware systems for AI data centers?
- What supply chain chokepoints should be anticipated and prepared for across HBMs, substrates, interposers, cables, cooling components, power modules, and high-voltage parts?
- What key channel and ecosystem partnerships may be needed for AI hardware pre-validation, testing, and optimization?
The thoughtful hybrid cloud: Routing workloads on-premises, off-premises, and to the edges
The need to balance cost, elasticity, and security has driven organizations to consider more deliberate, “hybrid by design” IT environments.35 We talked last year about a renewed interest in reincorporating private resources, and this trend appears to be evolving toward multiple hybrid configurations working in tandem to support next-generation AI workloads.
Public cloud remains the starting point for most AI adoption, as it provides access to frontier models, flexible resource stacks, and rapid experimentation. But as AI workloads grow—particularly training and high-volume inference—cloud costs can spiral out of control.36
On-premises AI infrastructure (ranging from under $1 million appliances to multi-rack GPU clusters) can be a way to rein in costs but often uses open-source or self-hosted models that may lag leading-edge cloud models by weeks or months. Finding the balance is likely to be a key focus for IT organizations in 2026.37
AI workloads are driving a multi-year, supply-constrained build-out of compute capacity across cloud, on-premises, and edge environments. The persistent shortage of data center space, power, and skilled labor highlights the need for dynamic hybrid strategies—distributing workloads based on cost, latency, sovereignty and security considerations, and power availability rather than defaulting to hyperscale cloud.38
For enterprises, AI infrastructure buildouts may be most successful when heterogeneous and multitiered, which puts a critical spotlight on hybrid placement intelligence.
Deloitte research suggests that the traditional cloud-edge binary is fragmenting. Enterprises are likely to operate across four distinct compute tiers:
- Public cloud, for access to continually updated frontier models and large-scale infrastructure
- Telco edge, where service providers are expanding AI-adjacent data centers to deliver metro-level latency and sovereign data handling39
- Enterprise edge, where organizations deploy GPU/CPU/memory resources on their own sites to protect intellectional property, ensure uptime, and manage sensitive data
- Device edge, where smartphones, PCs, vehicles, robots, and sensors perform on-device inference for ultra-low latency and offline reliability40
For tech companies, this dynamic deployment of AI compute can unlock new opportunities and new expectations. Cloud providers should offer orchestration, observability, and governance across heterogeneous environments, not just within their own platforms. Hardware vendors should design accelerators, networking, and cooling for power-constrained devices, ruggedized edge settings, and dense data centers. Telcos can reposition metro-edge compute as a premium “AI adjacency” offering. And device manufacturers may want to build out on-device inference capabilities over time, with adoption rising post-2026.
Looking ahead, AI infrastructure success will hinge on more than building capacity. It will likely depend on adding intelligence to the hybrid estate and routing AI workloads dynamically based on cost, latency, security, and regulatory needs in real time. Tech companies that can abstract this complexity for customers will likely be well-positioned as AI infrastructure becomes more distributed and resource-constrained.
Strategic questions to consider
- Have we evaluated our workload needs and run simulations to find the optimal mix of hybrid environments to handle development, production, and edge use cases? Can we offer similar services to our customers?
- What are the network and connectivity requirements of these new hybrid environments? Do we have the appropriate partnerships in place to deliver end-to-end solutions?
- Are we building environment-agnostic resource stacks, and the connectors to ensure interoperability?
Competing for trust and growth in a divided consumer tech landscape
The composition of US consumer spending reveals an uneven picture beneath the positive 2025 topline trends we noted in the “State of the market.” Recent macroeconomic views argue that the American consumer landscape has split into a “K-shaped” economy, where wealthier households power record levels of spending while many others tread water.41 These diverging financial realities could have profound implications for consumer tech purchasing in 2026 and beyond—especially as makers of devices like smartphones and PCs may face upward pricing pressures due to the memory chip crisis.42
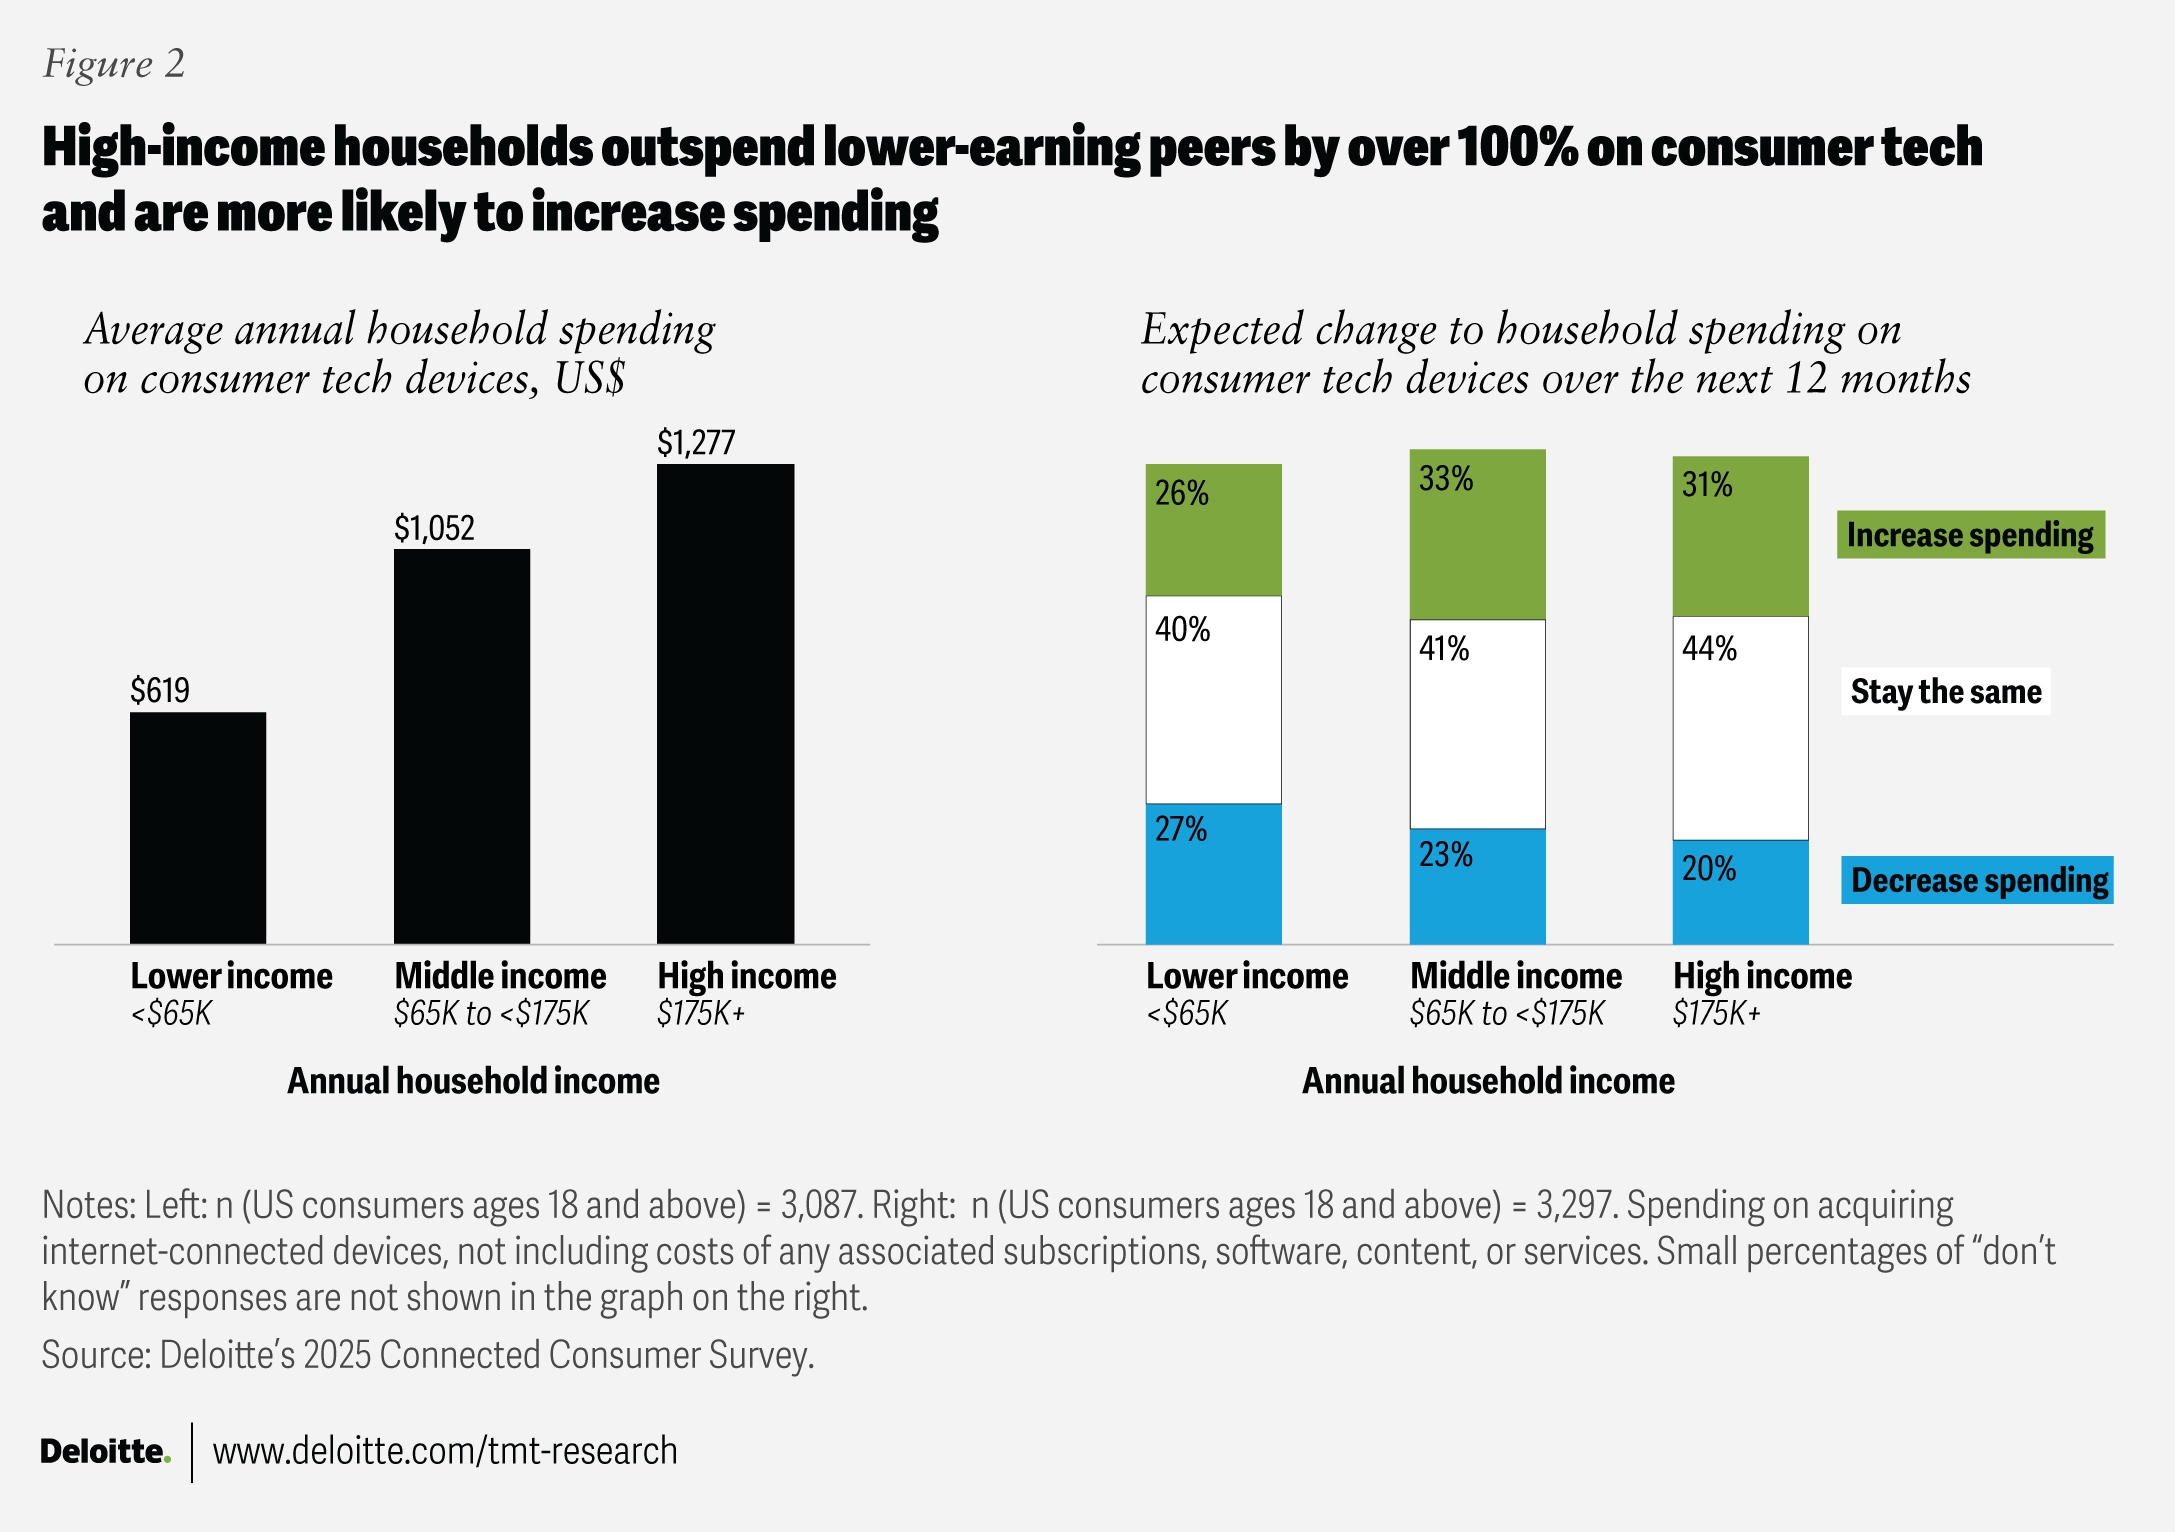
Consumer demand for technology remains resilient, though at very different levels depending on income. Deloitte’s 2025 Connected Consumer Survey reported that US households spent an average of $896 on consumer tech devices over the past year, up 17% from 2024.43 Looking ahead, 29% of consumers planned to increase device spending—triple the share in 2023—while 24% expected to cut back. Income-level analysis supports the K-shaped pattern: High-income44 households account for significantly greater tech spending already and show a stronger appetite for future purchases, positioning them to drive much of consumer tech’s near-term growth (figure 2).
Financial pressures could help explain why lower-income households are also the most likely to reduce their tech spending in the year ahead. Sixty-two percent anticipate affordability challenges—compared with 47% of middle-income and 34% of high-income households.45
Consumers across income groups prioritize the same core attributes when purchasing tech devices: Durability, strong foundational features (performance, storage, memory), and robust data privacy and security.46
Although new features are central to most product launches, innovation may not always hit the mark with consumers. While 75% agree that new features improve their lives, fewer than 3 in 10 agree strongly, highlighting an opportunity to better align innovation with user needs. Moreover, 69% feel innovation is moving too quickly, without sufficient attention to potential risks to users. Indeed, the top type of innovation consumers say they want is “better security and privacy,” a view shared across income groups. In one year, the share of respondents worried about data privacy and security jumped from 60% to 70%, with only 27% expressing high confidence that tech providers keep their data secure. Today’s consumers appear to be sending their tech providers a clear message: Don’t just deliver innovation—deliver it responsibly, with better data protection, transparency, and control.
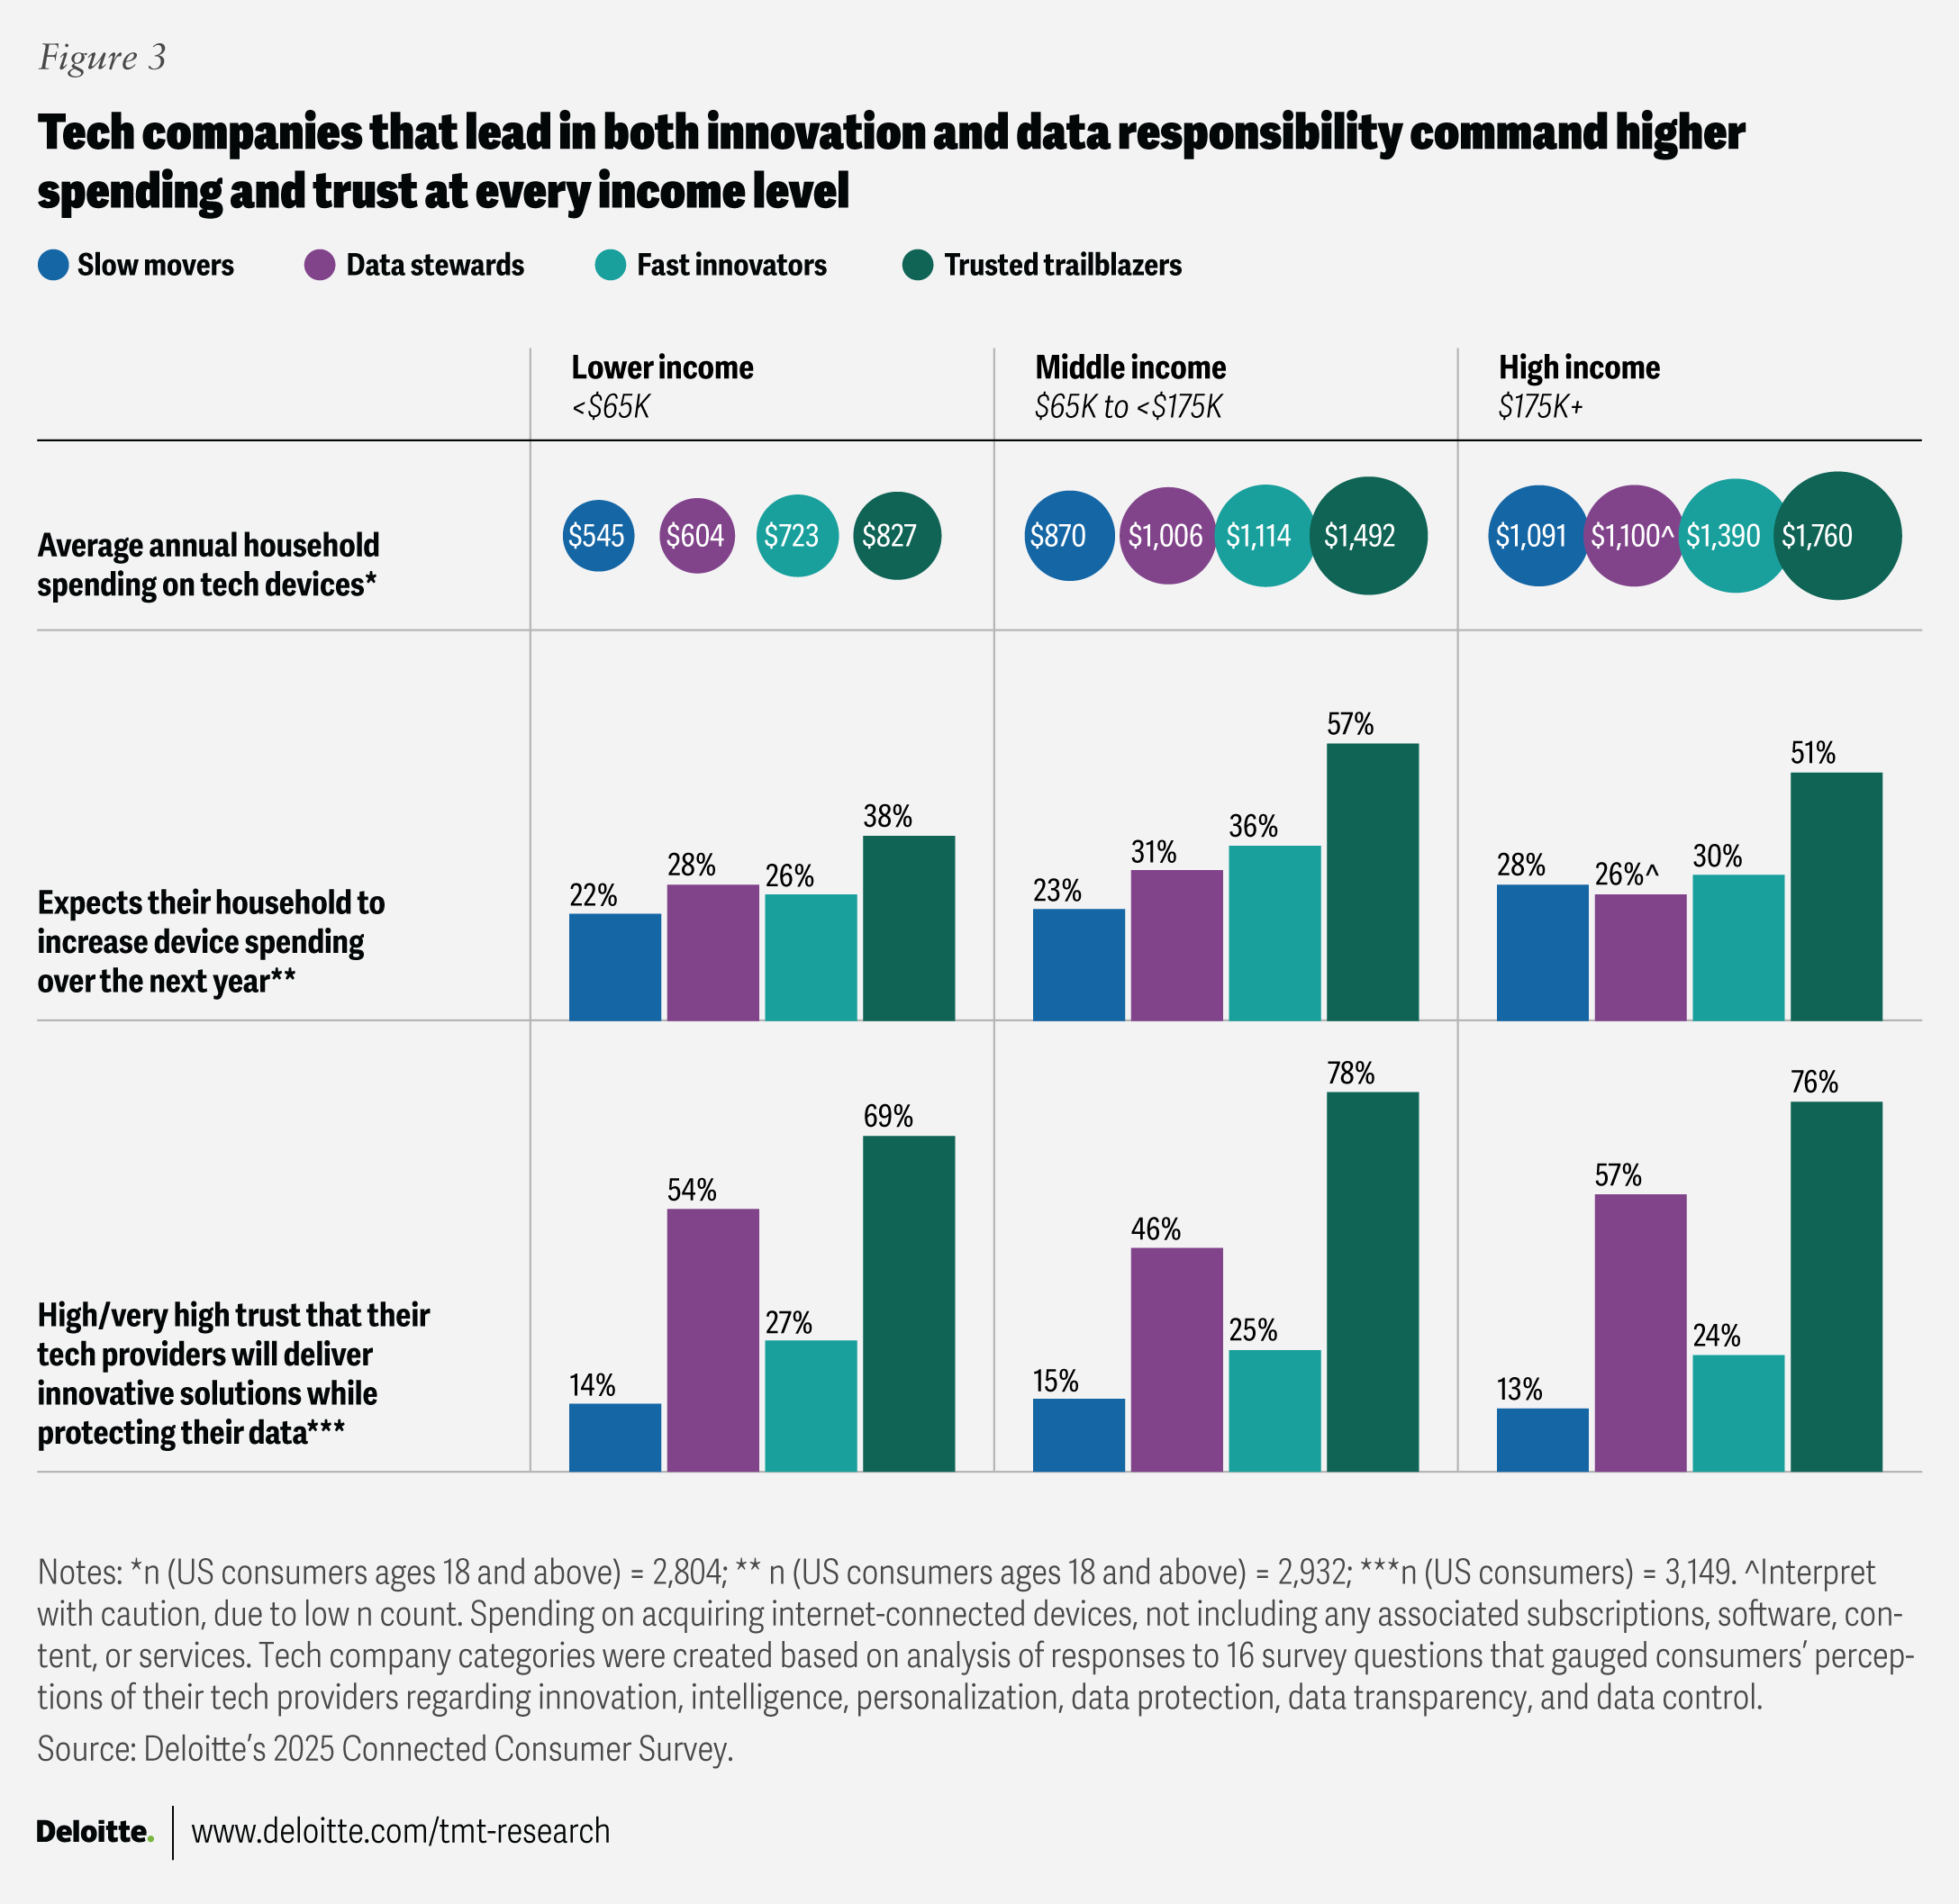
Our survey analysis created four segments, based on how well consumers feel their tech providers deliver on innovation and data responsibility:47 trusted trailblazers (24%), strong on both innovation and data stewardship; fast innovators (24%), high on innovation but weaker on privacy and transparency; data stewards (8%), strong on data responsibility but not seen as innovators; and slow movers (44%), the largest group, rated low on both dimensions.
Both financial capacity and provider performance help shape the consumer tech market (figure 3). Within each income group, households that rely on trusted trailblazers stand out: they spend the most on consumer tech, are the most likely to increase spending, and express the most trust that their providers can deliver innovative solutions securely. In contrast, households using slow movers report the lowest spending, the weakest intent to increase spending, and the lowest trust. Fast innovators gain spending lift from their advanced features despite limited trust, while data stewards earn strong trust that correlates with higher spending, even without standout innovation.
For tech providers, the path to sustained loyalty and growth likely lies not only in rapid innovation, but in earning trust through data transparency, control, and security by design.
Strategic questions to consider
- How can consumer tech companies calibrate innovation, pricing, and value to meet the expectations of high-income adopters without leaving price-sensitive consumers behind?
- What shifts in product strategy are needed to ensure that innovation solves real user problems consistently, closing the gap between what companies launch and what consumers value?
- How can providers strengthen data responsibility—privacy, transparency, and user control—to build trust and boost loyalty and spending?
- Given the advantages of trusted trailblazers, what capabilities, investments, or partnerships are needed for organizations to move into (or defend) this leadership position?
Strategic considerations for tech leaders in 2026
As the hardware and consumer tech industry navigates 2026, three forces are converging across the enterprise stack: AI is reigniting hardware growth; next-generation data centers are redefining power, cooling, and networking requirements; and hybrid compute is becoming a strategic imperative rather than an architectural choice. Across these domains, success may depend increasingly on system-level integration—the ability to design and orchestrate complete, end-to-end systems that tightly align chips, servers, racks, data center infrastructure, and hybrid environments to deliver performance, efficiency, and resilience at scale. In consumer technology, the imperative is different but no less systemic: Growth is shaped by uneven purchasing power and rising expectations for trust, making the integration of innovation, affordability, and data responsibility central to winning demand.
For tech leaders, the path forward is not defined by speed or innovation alone, but by the ability to integrate technology, operations, and trust—aligning bold ambition with disciplined execution across both enterprise and consumer markets.
Continue the conversation
Meet the industry leaders
Steve Fineberg
Todd Beilis
Duncan Stewart
Jeff Loucks
by
Steve Fineberg
Todd Beilis
Susanne Hupfer
Duncan Stewart
Michael Steinhart
Prashant Raman
The authors would like to thank Jeff Loucks for his guidance and leadership on this project. We would like to thank Karthik Ramachandran and Ankit Dhameja for their valued contributions to the research, and Girija Krishnamurthy, Drew Scaggs, Brian Pinto, Brandon Kulik, Gillian Crossan, David Jarvis, Sayantani Mazumder, Alison Zink, Lancy Jiang, Dasani Walton, Michelle Dollinger, Catherine King, Andy Bayiates, Blythe Hurley, Prodyut Borah, Jaime Austin, and the Deloitte Insights team for their contributions and support.
Editorial (including production and copyediting): Andy Bayiates, Prodyut Borah, Cintia Cheong, Anu Augustine
Design: Molly Piersol
Cover artist: Rahul Bodiga and Jaime Austin; Adobe Stock
Knowledge Services: Vanapalli Viswa Teja
Visit the Deloitte Center for Technology, Media & Telecommunications
Access more insights for the technology, media, and entertainment; semiconductor; telecommunication; and sports sectors.