
2026 Deloitte Back-to-School Survey
Deloitte’s 19th Back-to-School Survey finds parents seeking value in their shopping journey amid persistently high inflation and weak consumer sentiment
In our 19th annual Back-to-School Survey, families are approaching the season with the same disciplined caution that has defined the post-pandemic years. Expected spending per child holds flat at $557, with an estimated BTS market of $30.4 billion.1 Inflation reached 4.2% in May,2 and consumer sentiment remains weak: Fifty-seven percent expect the economy to worsen in the next six months, the highest level reported in the survey since 2020. Parents are, however, taking it in their stride, as value-seeking has become their default mode. Most back-to-school shoppers use at least one cost-saving tactic, while one-third employ four or more. Notably, these hyper-value seekers (adopting four or more cost-saving behaviors) spend 14% more on average, offering opportunities for retailers to earn incremental dollars.
While budgets are flat, a shift is evident in what parents are purchasing. They plan to spend 22% more on clothing and accessories this year as they replace worn items and allow selective splurges; tech spending is expected to decrease 16% as device upgrades get deferred. Spending on school supplies is expected to be flat as parents look to stick to what’s on the list.
Digital tools are reshaping the back-to-school shopping landscape in ways retailers may not be able to afford to overlook. Planned spend is consistently higher among parents across all income groups who use a broader set of digital tools in their shopping journey. Non-tech users (20%) plan to spend $381, while those planning to use search engines (30%) plan to spend $494 on average. As respondents add additional tech tools, their spend goes up: Those using search and social media (21%) spend an average of $531, and those who use search, social media, and generative AI (29%) have the highest planned spend at $737. The implication is clear: The more digitally engaged the shopper, the greater the spending potential.
For retailers, an opportunity lies in going beyond just discounting to meet disciplined shoppers with sharper relevance. Parents are still spending, but they are making clearer trade-offs: prioritizing replacement items, using digital tools to plan, and timing purchases around value moments. Retailers that can make those decisions easier, more personalized, and more rewarding have room to capture growth even in a constrained season.
Read on for key takeaways and download the full survey findings.
Key takeaways
Parents are doing the math
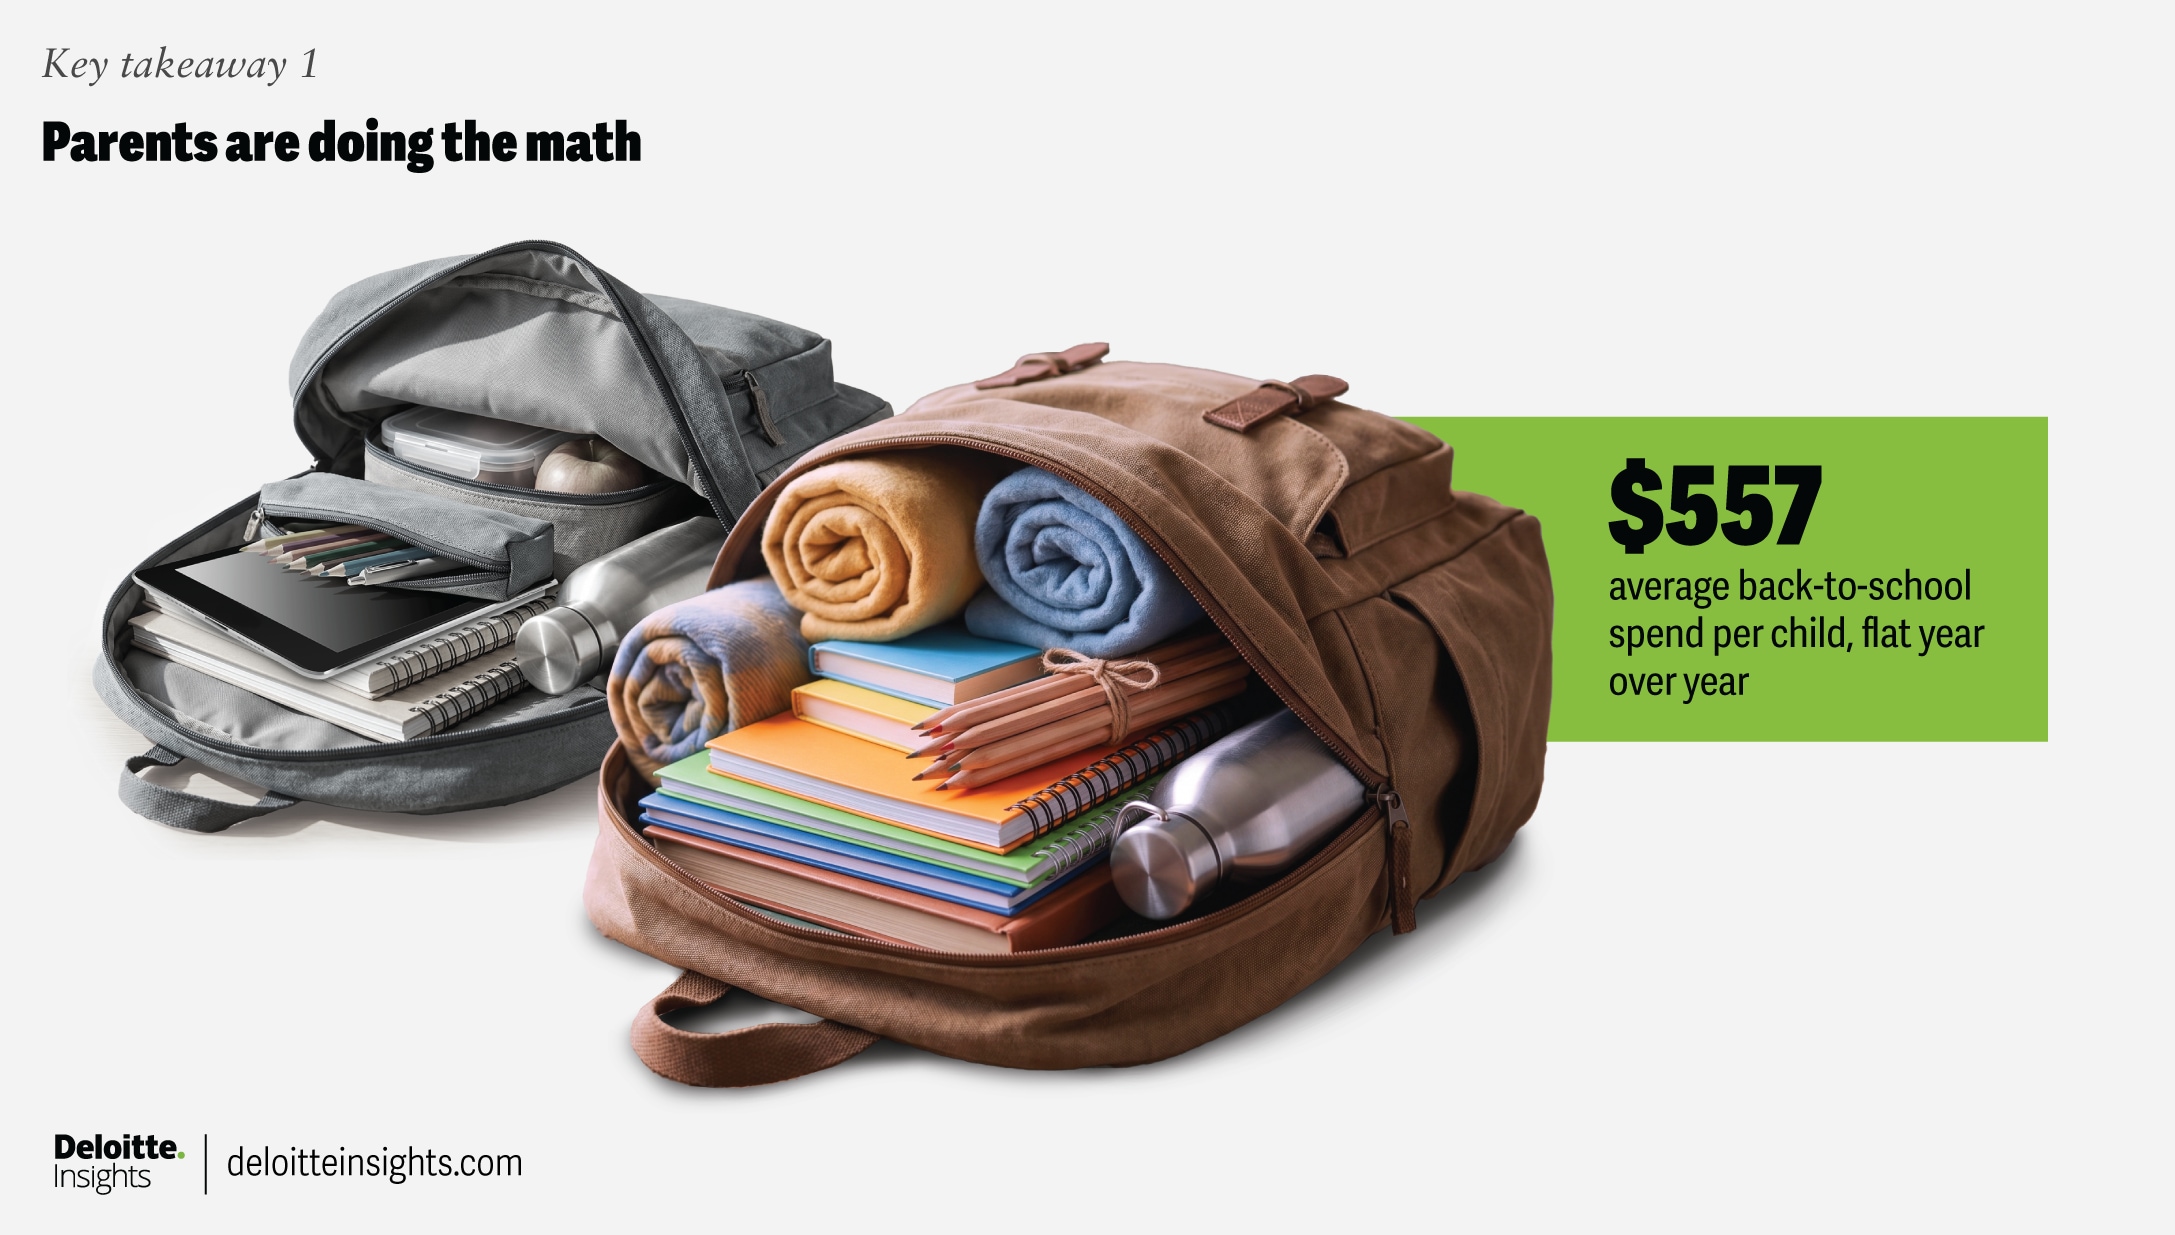
Parents surveyed plan to spend $557 per child on back-to-school items this season (flat year over year). Spending caution persists as 57% expect economic conditions to worsen over the next six months.
The savviest shoppers spend big
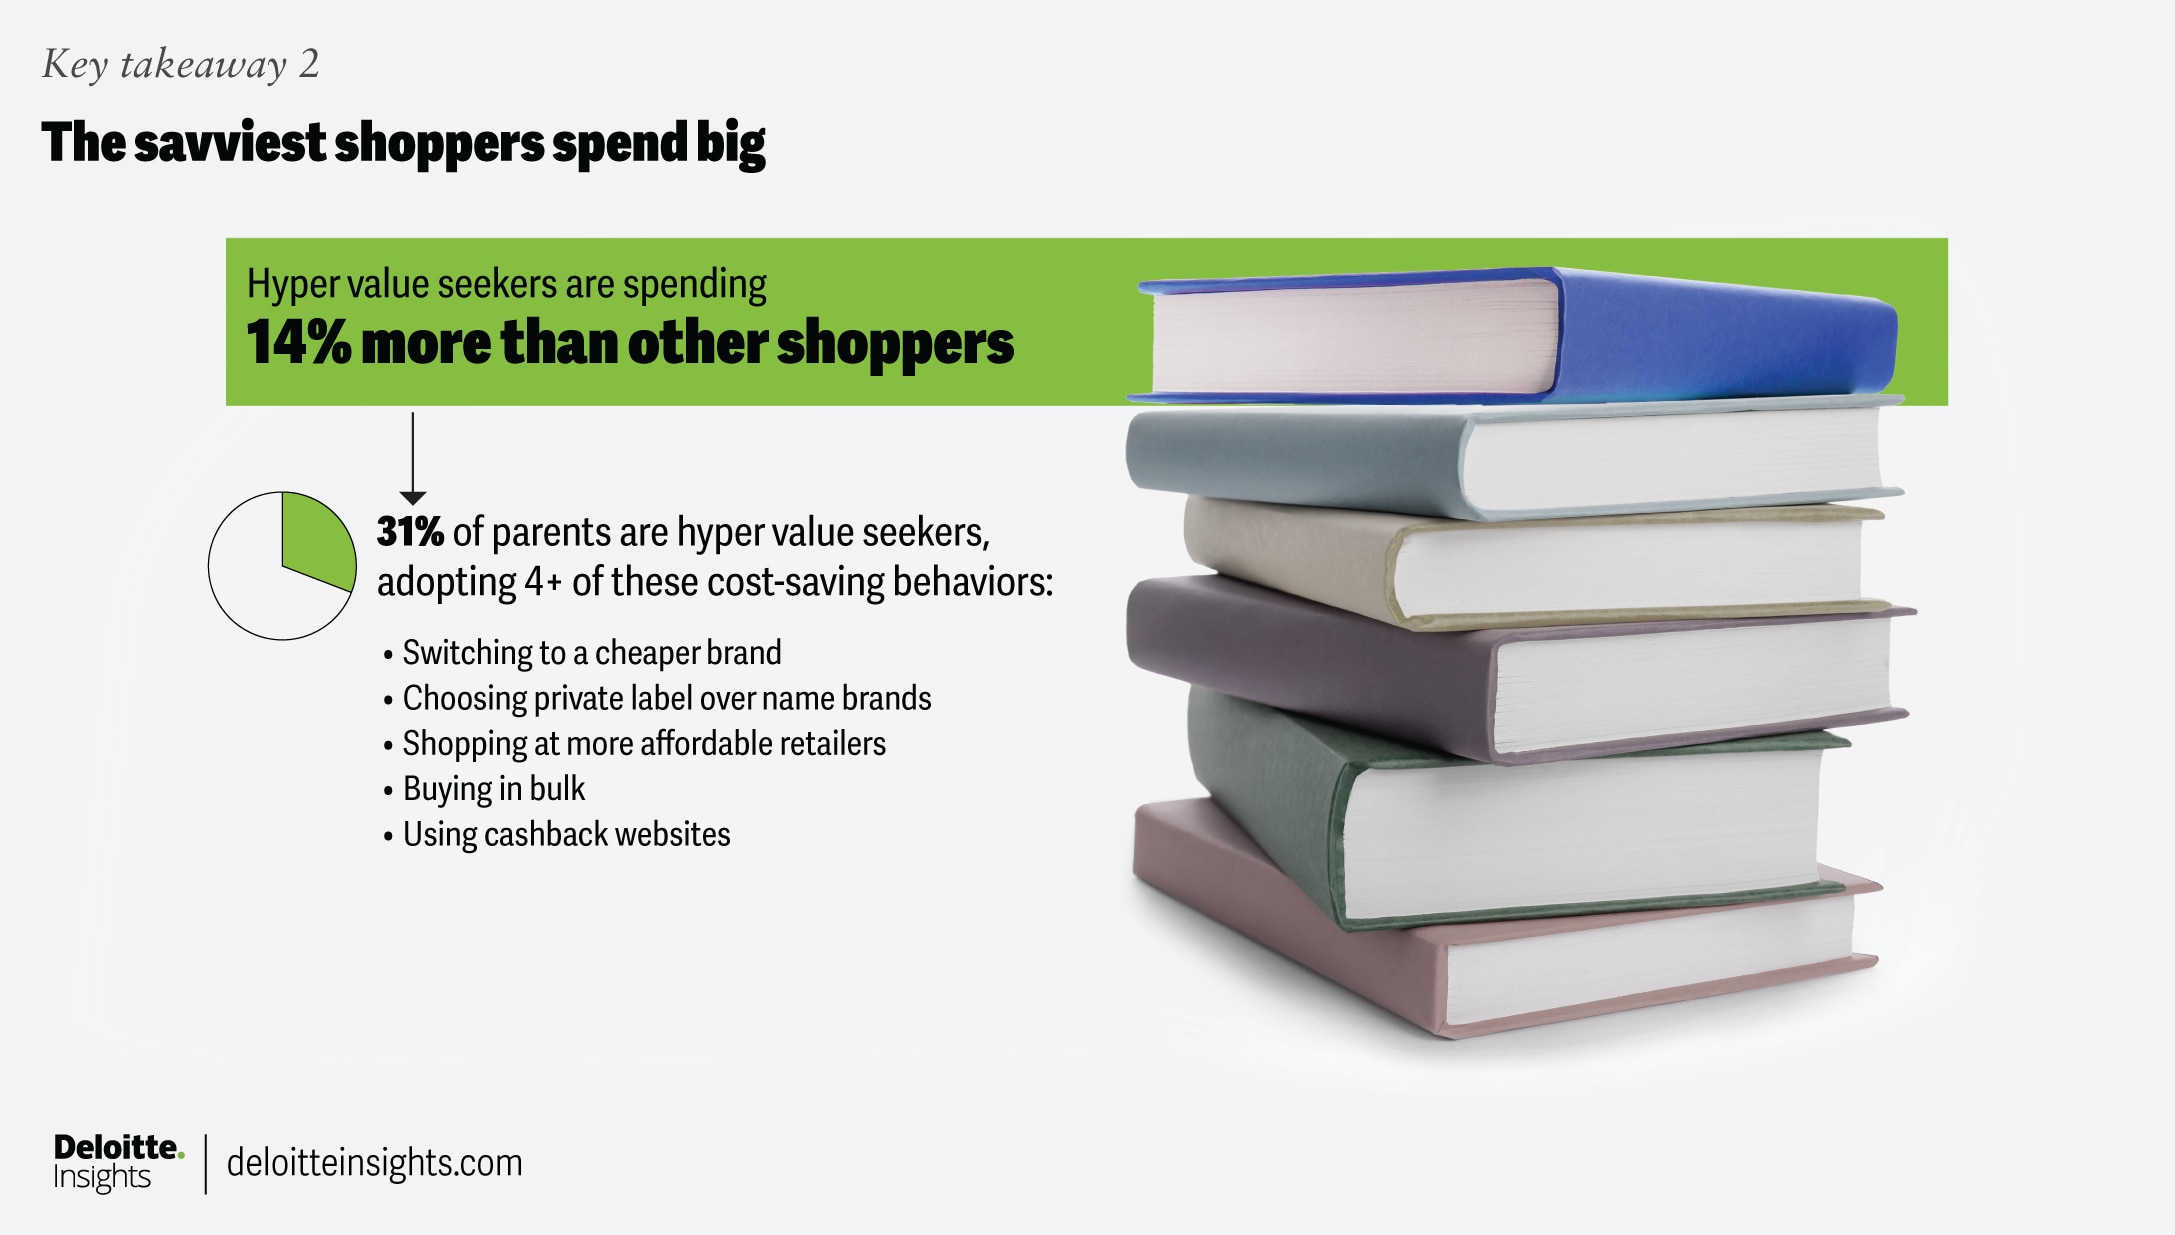
This back-to-school season, parents are shopping with intention rather than restraint. Thirty-one percent of parents qualify as hyper-value seekers, adopting four or more cost-saving behaviors. Despite their deal-seeking mindset, they spend an average of about $610 per child, 14% more than other shoppers, indicating that value-seeking is more about selectivity than austerity.
Digital engagement spurs spending
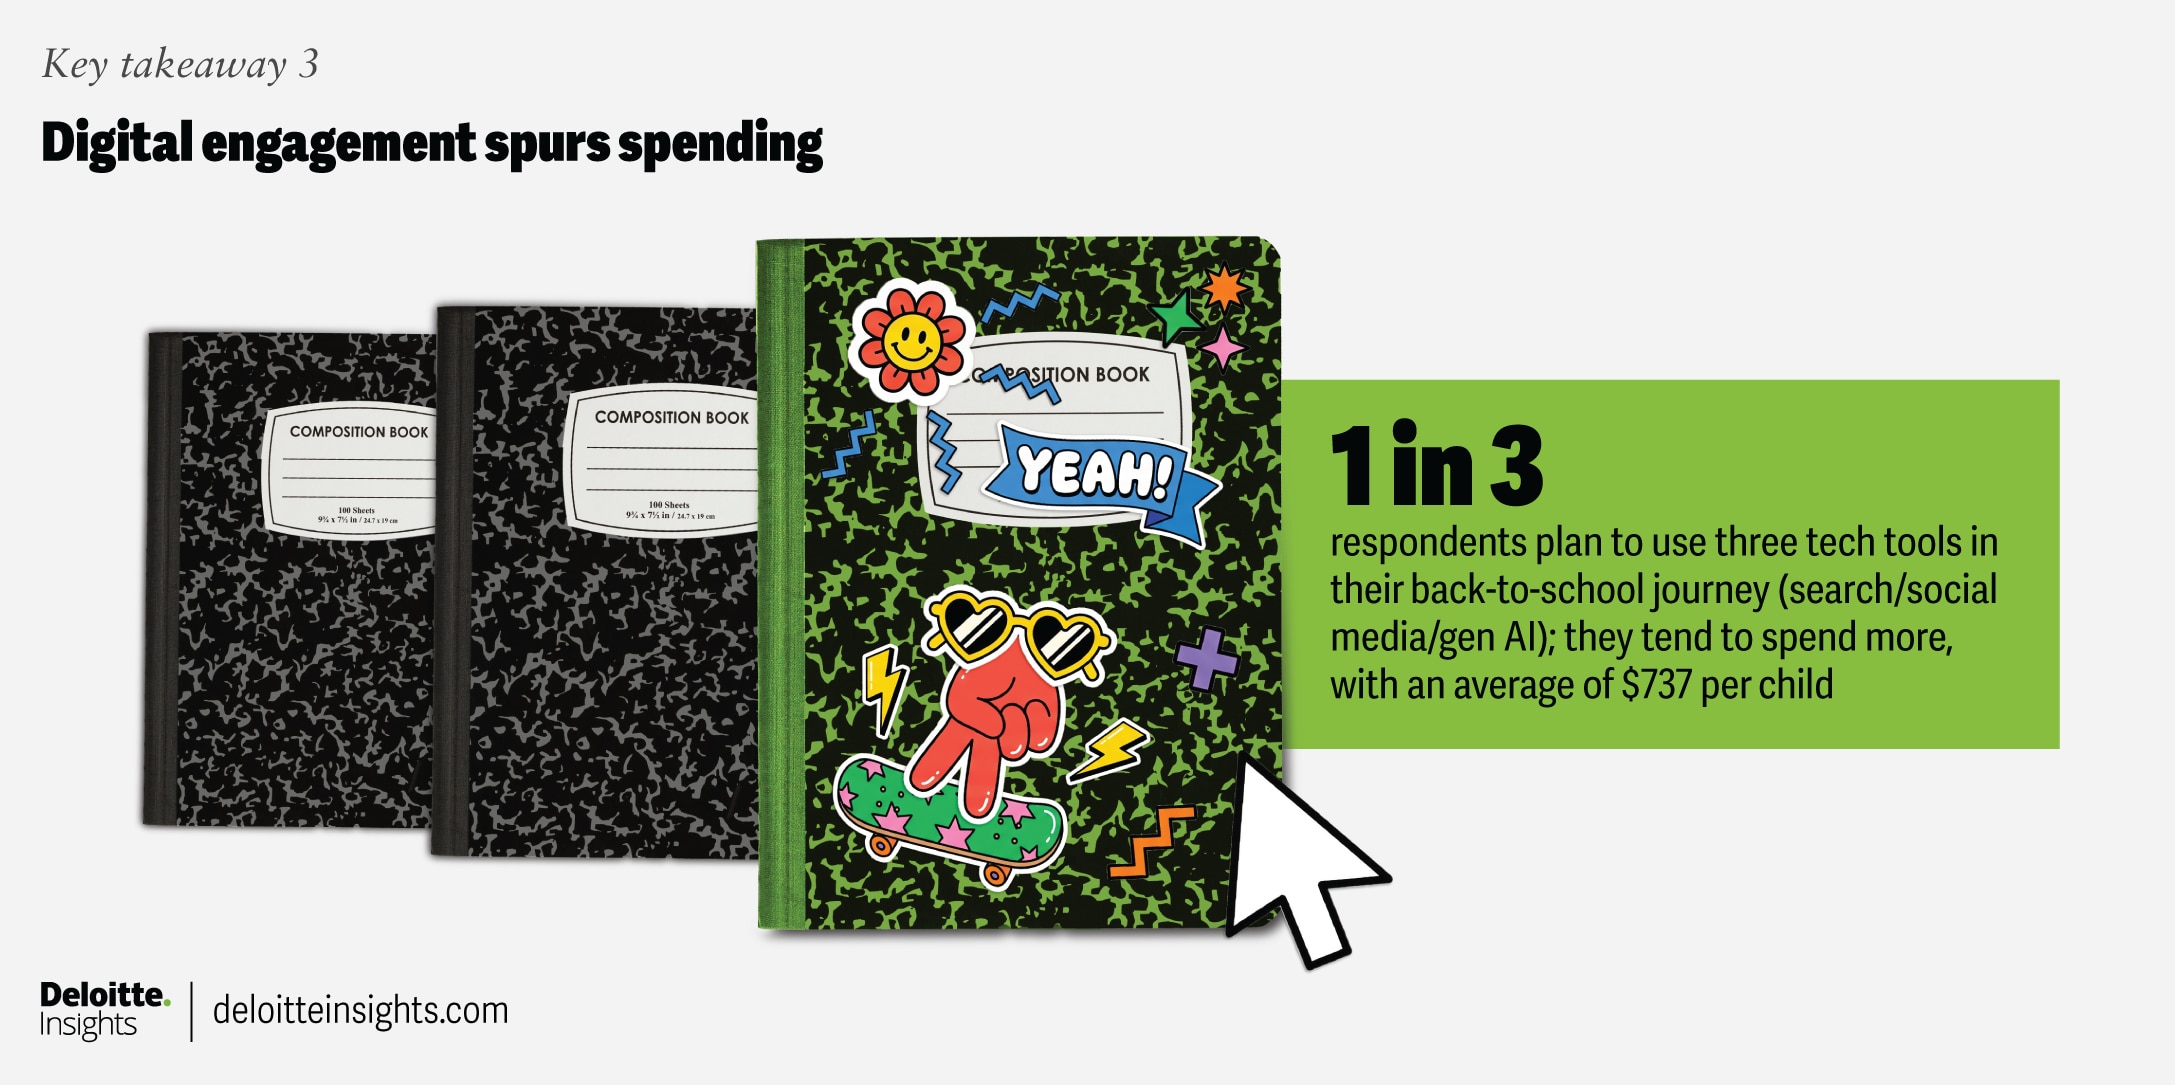
Respondents across income groups who use digital tools tend to spend more on back-to-school shopping. Non-tech users plan to spend $381, while those using search engines spend an average of $494, those using search and social media spend $531, and those using all tech tools (search, social media, and gen AI) have the highest planned spend at $737.
BY
Natalie Martini
Brian McCarthy
Stephen Rogers
Lupine Skelly
Manvi Verma
The authors would like to thank Sanjay Mallik Vadrevu, Anup Raju, Rithu Mariam Thomas, and Kianna Sanchez for their contributions to this survey.
Editorial (including production and copyediting): Rithu Mariam Thomas, Preetha Devan, and Anu Augustine
Design: Alexis Werbeck, Molly Piersol, Natalie Pfaff, and Sofia Laviano
Audience development: Pooja Boopathy
Cover image by: Sofia Laviano; Adobe Stock
Knowledge services: Rishitha Bichapogu
More from the Deloitte Consumer Industry Center
Access more insights for the automotive, consumer products, food, retail, wholesale and distribution, airlines and hospitality, and transportation sectors.