Weekly Global Economic Update
What’s happening this week in economics? Deloitte’s team of economists examines news and trends from around the world.
Week of January 12, 2026
- US productivity surges because of the tech industry
- The US job market shows signs of cooling even as the economy has grown rapidly
- Southeast Asia’s economy has performed well despite headwinds
- The US dollar has weakened considerably in the past year
- Inflation in the Eurozone remains subdued
US productivity surges because of the tech industry
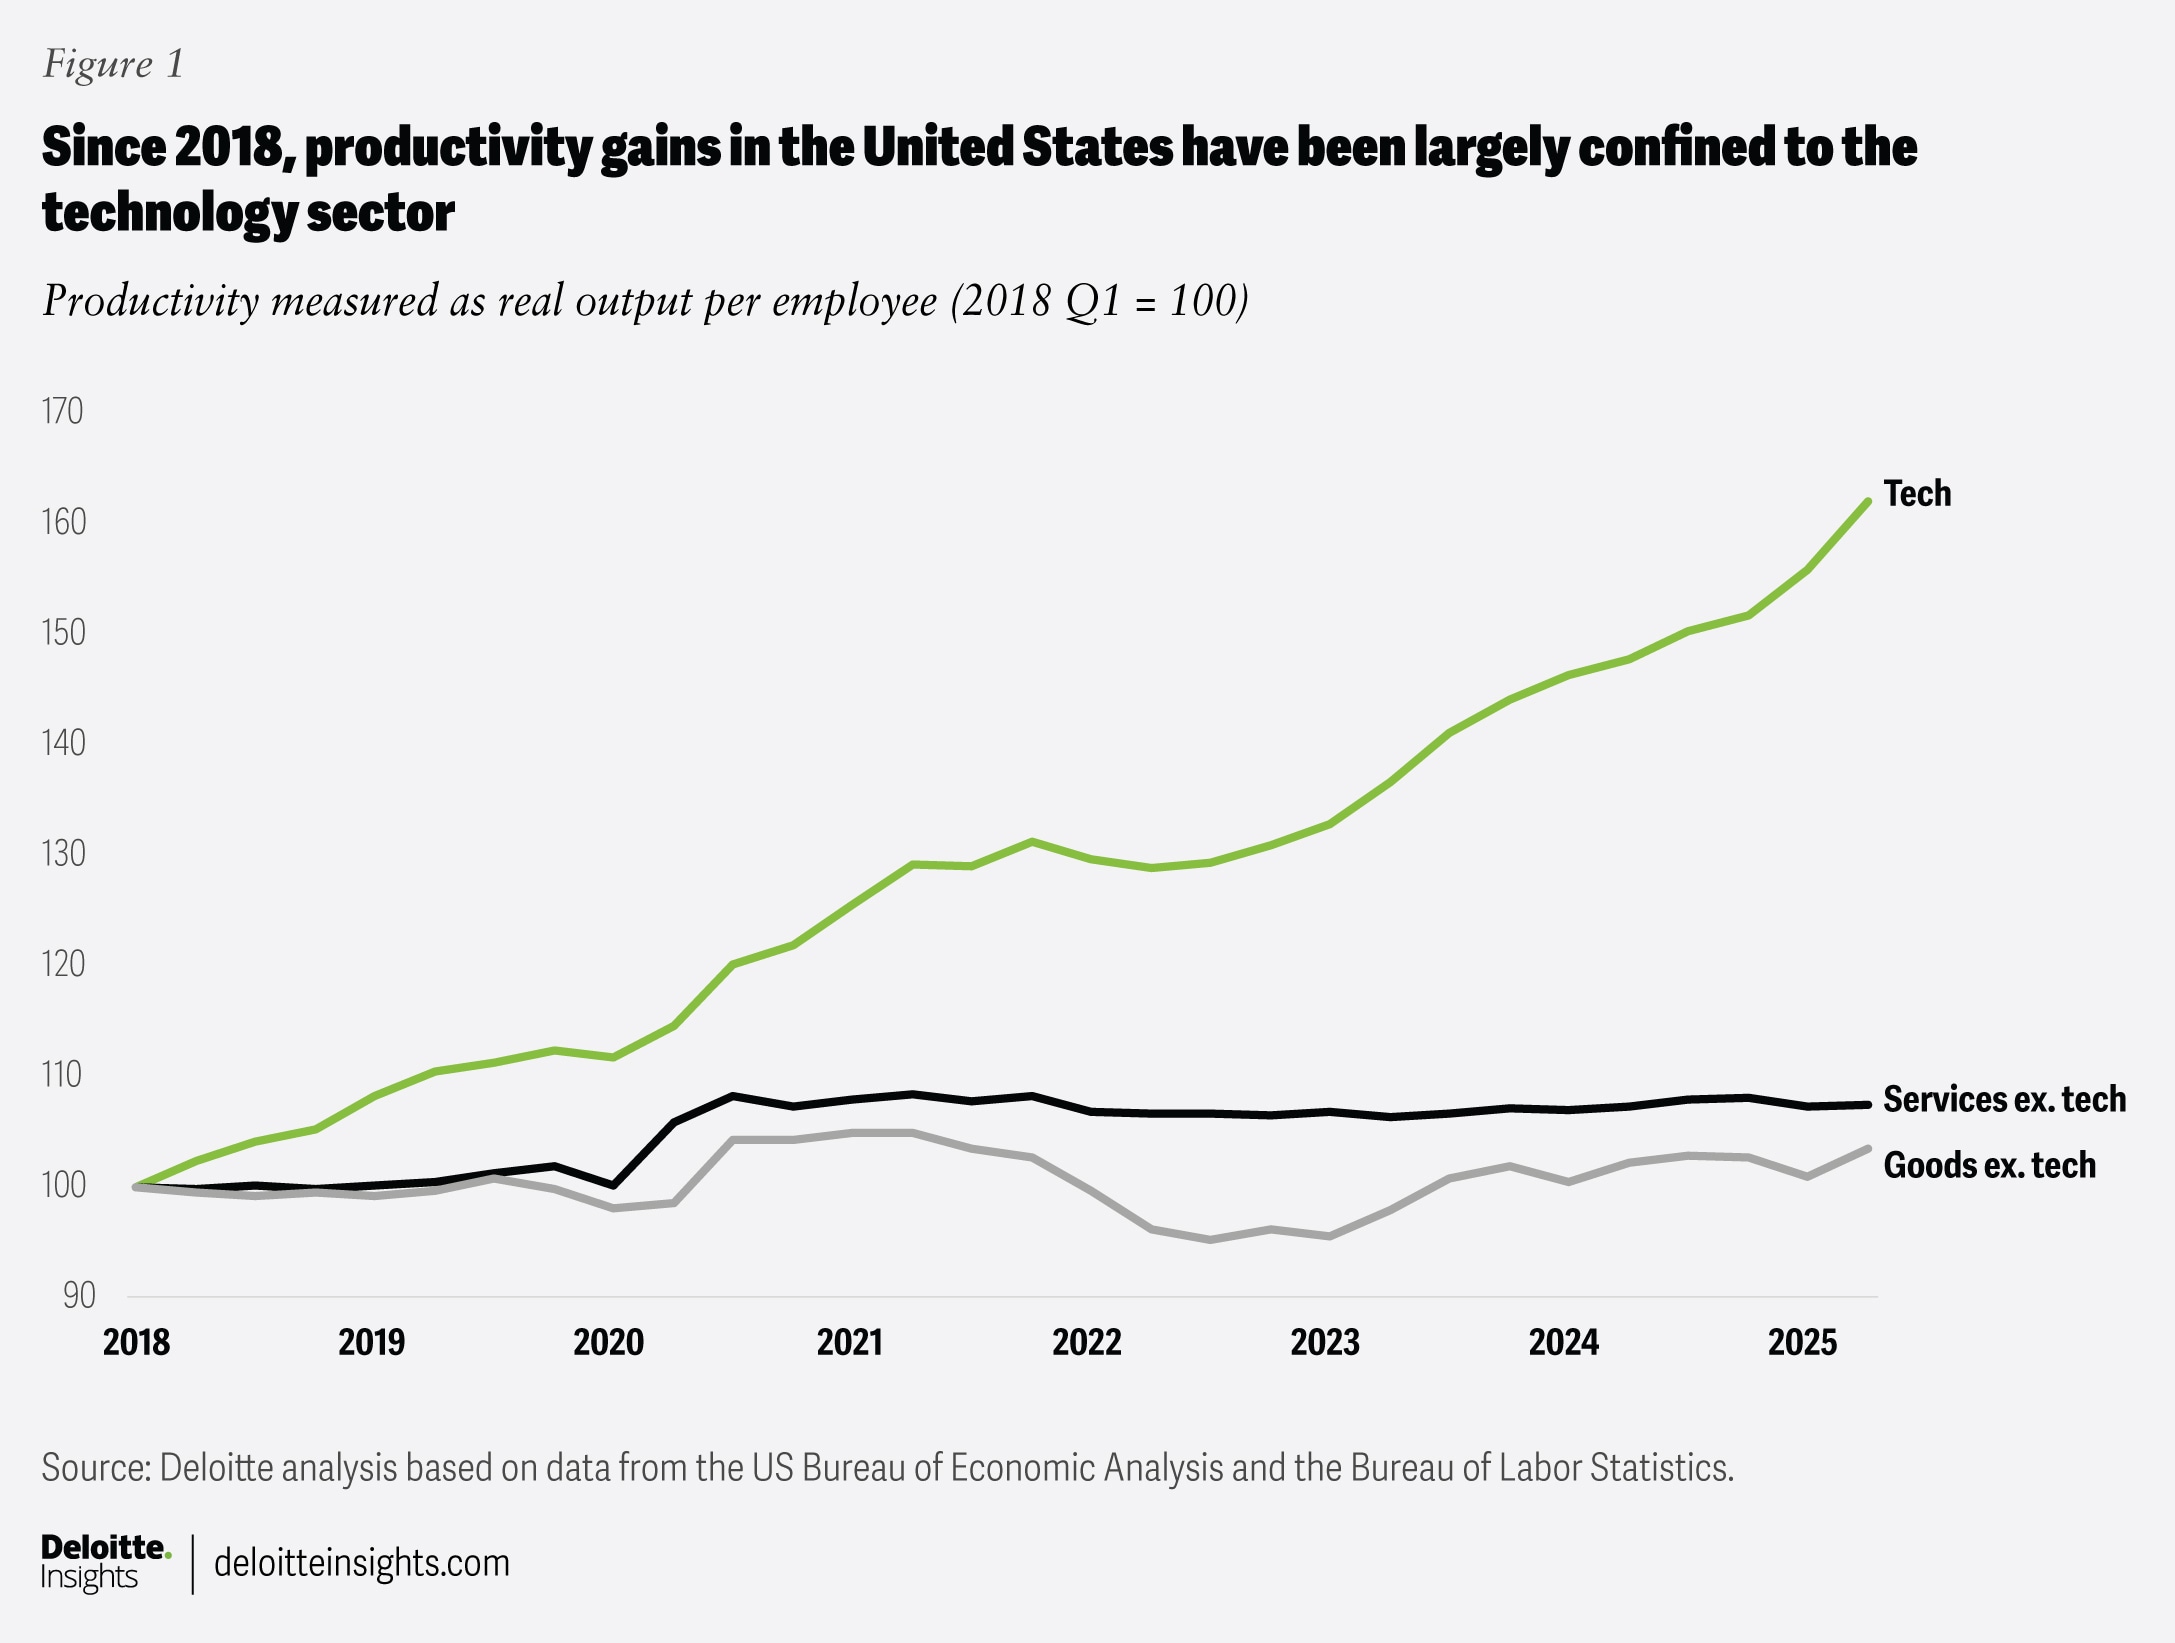
- The US economy appears to be generating significant gains in labor productivity. Yet most of those gains appear to be heavily concentrated in the tech industry, while the rest of the economy has not kept pace. As such, the economy appears to be bifurcating. For a while, some observers have talked about a K-shaped economy in which high-income households do well while others do not. This is real. Yet there now appears to be another K-shaped aspect to the economy, involving the divide between tech and non-tech. Let me explain.
In both the second and third quarters of 2025, labor productivity grew rapidly. Does this mean that the long-hoped-for productivity gains from AI have arrived? Probably not. Rather, productivity gains are mainly increasing in the technology sector while non-tech sectors see only limited gains (figure 1). This likely reflects big increases in tech output combined with only limited gains in employment. When data centers open and start spitting out insights (or hallucinations), this is an increase in output. Yet data centers employ very few people. Hence, productivity rises very rapidly.
Yet with productivity gains being so concentrated, most of the US economy is yet to experience the beneficial aspects of these gains. Normally, widespread gains in productivity would lead to significant wage gains and, consequently, improvements in living standards. For the US economy, this can only happen when productivity gains shift from the tech industry toward most other industries. And that will happen when AI adoption in other industries generates productivity gains. The evidence suggests this transition is not yet happening and may take some time.
The US job market shows signs of cooling even as the economy has grown rapidly
- The latest jobs report from the US government indicates slow employment growth in December, which is consistent with the pace of job growth throughout 2025. In fact, nonfarm payrolls in 2025 rose 584,000, the slowest pace since the pandemic. In comparison, payrolls rose 2 million in 2024. Slower job growth reflects both supply and demand factors. On the supply side, a tight immigration policy has slowed the growth of the labor force. On the demand side, there has been a softening of demand, due in large part to the disruptive impact of tariffs and trade policy uncertainty. In addition, it is possible that the transition to AI has disrupted some types of hiring. As such, the slowdown in job growth is not simply a reflection of cyclical factors. It might also have to do with structural factors. This makes it more difficult for the Federal Reserve to choose the appropriate policy.
The US government publishes a report on employment based on two surveys: a survey of establishments; and a survey of households. The establishment survey found that, in December, 50,000 new jobs were created. Moreover, since April, job growth has been volatile, with several months of declining employment. Thus, there have only been 93,000 jobs created since April, or an average of 11,600 jobs per month. In other words, there was barely any job growth in the past eight months. And yet, real GDP growth in the second and third quarters was strong. This was because labor productivity grew rapidly. Plus, the data tells us that almost all that productivity growth took place in the technology sector as output increased while employment declined.
Looking at job growth by industry and sector, the report found that employment declined in mining, manufacturing, construction, wholesale trade, retail trade, transportation and warehousing, and professional and business services. In fact, the combined decline in employment in those industries was 57,000 jobs lost in December. Meanwhile, employment grew strongly only in health care and social assistance (up 38,500), leisure and hospitality (up 47,000), and government (up 13,000). Thus, job growth was concentrated in just three industries with considerable weakness in most of the others.
Notably, employment in manufacturing fell not only in December. It fell every month since April, with a combined decline of 73,000 jobs. April was the month in which tariffs were introduced, in part with the purpose of encouraging reshoring of manufacturing. Instead, high tariffs on imported components boosted costs for manufacturers in the United States. This increase in costs was not shared by their overseas competitors. Yet US companies held the line on pricing by taking a hit to their margins and cutting other costs including workforce reductions.
Meanwhile, the separate survey of households found that, in December, the civilian labor force decreased by 46,000 people from the previous month. Yet the working-age population continued to grow. Thus, the labor force participation rate fell. However, employment continued to rise. Thus, the unemployment rate fell from 4.5% in November to 4.4% in December.
Investor response to the latest report was relatively muted, with little movement in bond yields. However, the futures market implied probability of rate cuts in 2026 shifted slightly toward fewer cuts than previously expected.
- Another indication that the US job market is likely weakening comes from the latest Job Openings and Labor Turnover Survey (JOLTS), published by the US government. The last JOLTS report published in November found that the number of job openings had declined 11% from a year earlier, with the job opening rate (the share of available jobs that are unfilled) falling from 4.8% in November 2024 to 4.3% in November 2025.
Notably, there was a sharp decline in job openings in our industry, professional business services. The number of openings fell 23% from a year earlier (down by roughly 400,000) while the job opening rate for our industry fell from 7.1% to 5.6%. Still, at 5.6%, the professional services industry has the highest job opening rate of any industry. Manufacturing has the lowest.
Most industries saw a decline in the number of job openings, with some exceptions. There was an increase in openings in construction, wholesale trade, retail trade, and transportation, warehousing, and utilities. On the other hand, there was a decline in job openings in health care, which is surprising. After all, the health care industry has consistently grown and added workers for decades.
The decline in job openings points to a weakening labor demand. There is evidence that this had to do with the tariff policy. Moreover, Challenger & Grey report found that the number of job dismissals in 2025 rose 60% from the previous year, hitting the highest level since the pandemic. Meanwhile, labor supply has been weakening as well, largely because of the restrictive immigration policy. As both supply and demand have eased, the unemployment rate has remained relatively stable. Meanwhile, the ratio of job openings to the number of unemployed workers fell to 0.9. Excluding the pandemic, this was the lowest since 2017. With fewer job opportunities for unemployed people there could soon be further downward pressure on wages. If, as I expect, inflation accelerates this year due to tariffs, then we could see prices rise faster than wages, potentially reducing consumer purchasing power and dampening spending growth.
Southeast Asia’s economy has performed well despite headwinds
- In April, when the United States proposed large tariffs on imports from Southeast Asian countries, there was considerable angst in the region about future economic prospects. Ultimately, through negotiation, the United States reduced the proposed tariffs. However, it left in place historically high tariffs. For example, in the case of Vietnam, the initial proposal of a 49% tariff was cut to 20%.
Although 20% is a very high, Vietnam and other countries in the region have done well. For example, in the third quarter of 2025, goods exports from Southeast Asia to the United States were up 25% from a year earlier. Plus, foreign direct investment (FDI) into the region has been strong, with an especially large amount emanating from China and Hong Kong. Indeed, it is estimated that total FDI into Southeast Asia rose 9% in 2025 versus the previous year. For Vietnam, the biggest sources of FDI were China, Singapore, South Korea, Japan, and Taiwan.
What makes Southeast Asia so attractive? It is because there are even higher US tariffs on imports from China. In addition, there remains tension between the United States and China. Hence, Chinese manufacturers are keen to assemble goods in Southeast Asia for export to the United States, especially given lower tariffs and (in some cases) lower labor costs. On the other hand, Chinese companies will need to be careful given the 40% US tariff on imports from Southeast Asia that are deemed to be transshipped from China. Also, companies in other East Asian countries see Southeast Asia as a favorable place to assemble goods for export to the United States, despite the tariffs. The result was that, in 2025, Southeast Asian exports to the rest of the world were up 17% from a year earlier.
One consequence of all this activity is that Vietnam’s economy grew 8% in 2025, despite tariffs and tariff uncertainty. Moreover, in the fourth quarter, Vietnam’s real GDP rose 8.5% from a year earlier, with construction and industrial activity up 9%. Thus, it looks like the trade policy disruption initiated by the United States in 2025 did not lead to an economic crisis in Southeast Asia. Rather, it created conditions for improved export performance and increased inbound investment.
The US dollar has weakened considerably in the past year
- As a new year begins, it is worth noting that 2025 was one of the worst years for the US dollar since floating currencies began more than a century ago. The dollar depreciated sharply, especially against the euro. This likely reflected several factors including declining demand for dollars due to weakened US trade; an expectation that the interest rate gap with other major countries will widen; an expectation that the United States will have higher inflation than other countries; and an expectation that the role of the United States in the global economy will diminish. Moreover, following the initial announcement of US tariffs back in April, there was a brief period in which there was capital flight from the United States, reflecting declining confidence in the stability of US economic policy.
Yet despite declining demand for US dollars, there was strong overseas demand for US equities given the strong performance of US technology stocks. Yet evidence suggests that, in most cases, foreign investors engaged in hedging strategies meant to protect them from dollar depreciation. For unhedged non-US investors, the US equity market performed poorly.
Meanwhile, for US investors, equities performed extremely well. Interestingly, assets meant as a hedge against risk such as gold and silver also performed well. It is unusual for gold and equities to both perform well at the same time. Yet the flight to gold and silver was consistent with the view that the US dollar is a less safe asset than previously. And the strength of US equities simply reflected confidence in the burgeoning AI economy.
Inflation in the Eurozone remains subdued
- In the Eurozone, inflation decelerated in December to its lowest level since August. Moreover, overall inflation now stands at the 2% target of the European Central Bank (ECB). This likely confirms the ECB’s decision to keep its benchmark interest rate unchanged for the past four months and likely for the coming year. Let’s look at the details.
In December, the consumer price index for the 20-member Eurozone was up 2% from a year earlier, down from 2.1% in November and the lowest level since August. Prices rose a modest 0.2% from the previous month. When volatile food and energy prices are excluded, core prices were up 2.3% from a year earlier, also the lowest since August. Core prices rose 0.3% from the previous month. Notably, energy prices declined while food prices rose sharply. Also, prices of services rose 3.4% from a year earlier and 0.7% from the previous month. Thus, the service sector continues to be a source of inflationary pressure. Taken together, the details of the inflation report thereby justify the choice not to cut interest rates further.
By country, the year-over-year increase in consumer prices in December was 2% in Germany, 0.7% in France, 1.2% in Italy, 3% in Spain, 2.5% in the Netherlands, 2.2% in Belgium, 2.9% in Greece, 2.7% in Ireland, and 1.8% in Finland.
BY
Ira Kalish
Editorial: Rupesh Bhat, Arpan Saha, and Aparna Prusty
Audience development: Kelly Cherry
Cover image by: Sofia Sergi
Visit the Deloitte Global Economics Research Center
Access more insights for the consumer spending, housing, business investment, globalization & international trade, fiscal & monetary policy, sustainability, equity, & climate, labor markets and prices & inflation sectors.