Networks deliver more for less as consumer choice expands
Deloitte’s latest publication of its communications infrastructure index shows 92% of US homes have high-speed access, hitting record connectivity
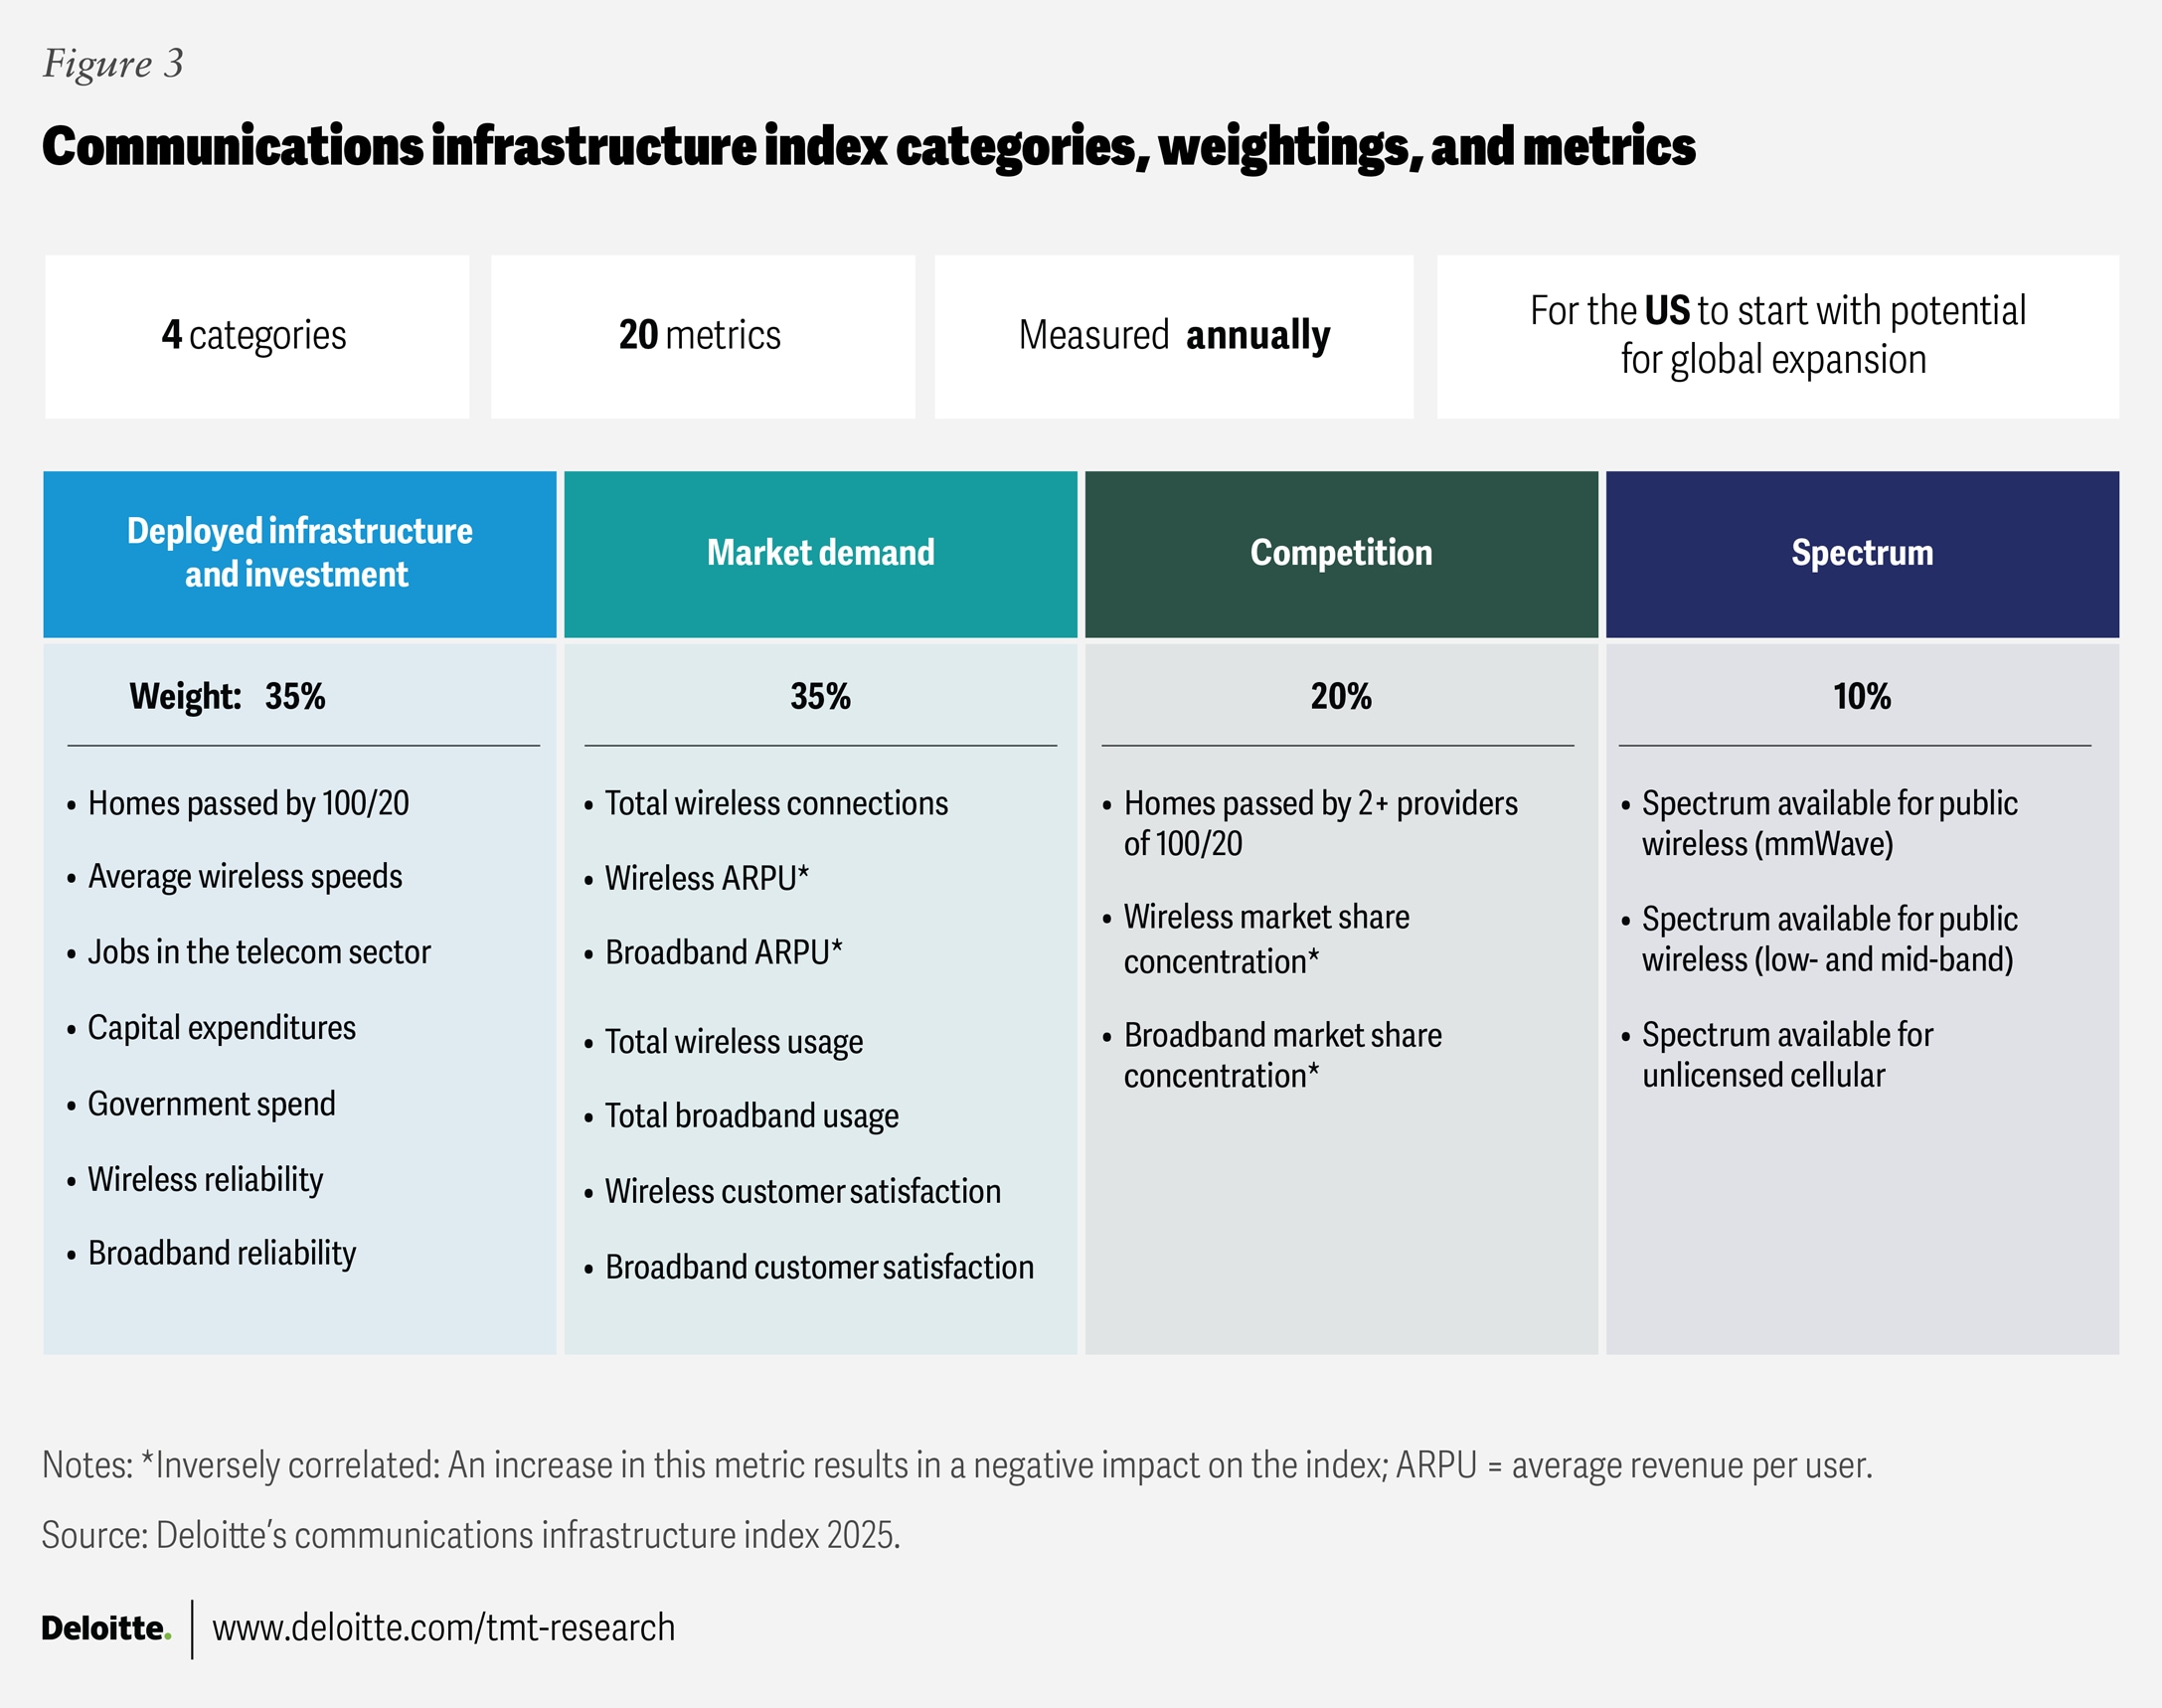
In a year dominated by headlines on artificial intelligence, it can be easy to lose track of advances in the communications infrastructure required to link users to AI innovations: Network connectivity is as important as chips to the widespread adoption of AI. Therefore, Deloitte’s telecommunications practice, in conjunction with the Deloitte Center for Technology, Media & Telecommunications, has published the latest edition of its communications infrastructure index (CII) providing an annual metric to track progress in the US communications industry. Deloitte’s CII tracks 20 metrics across four categories, including deployed infrastructure and investment, market demand, competition, and spectrum (for details regarding the CII methodology, refer to the methodology).
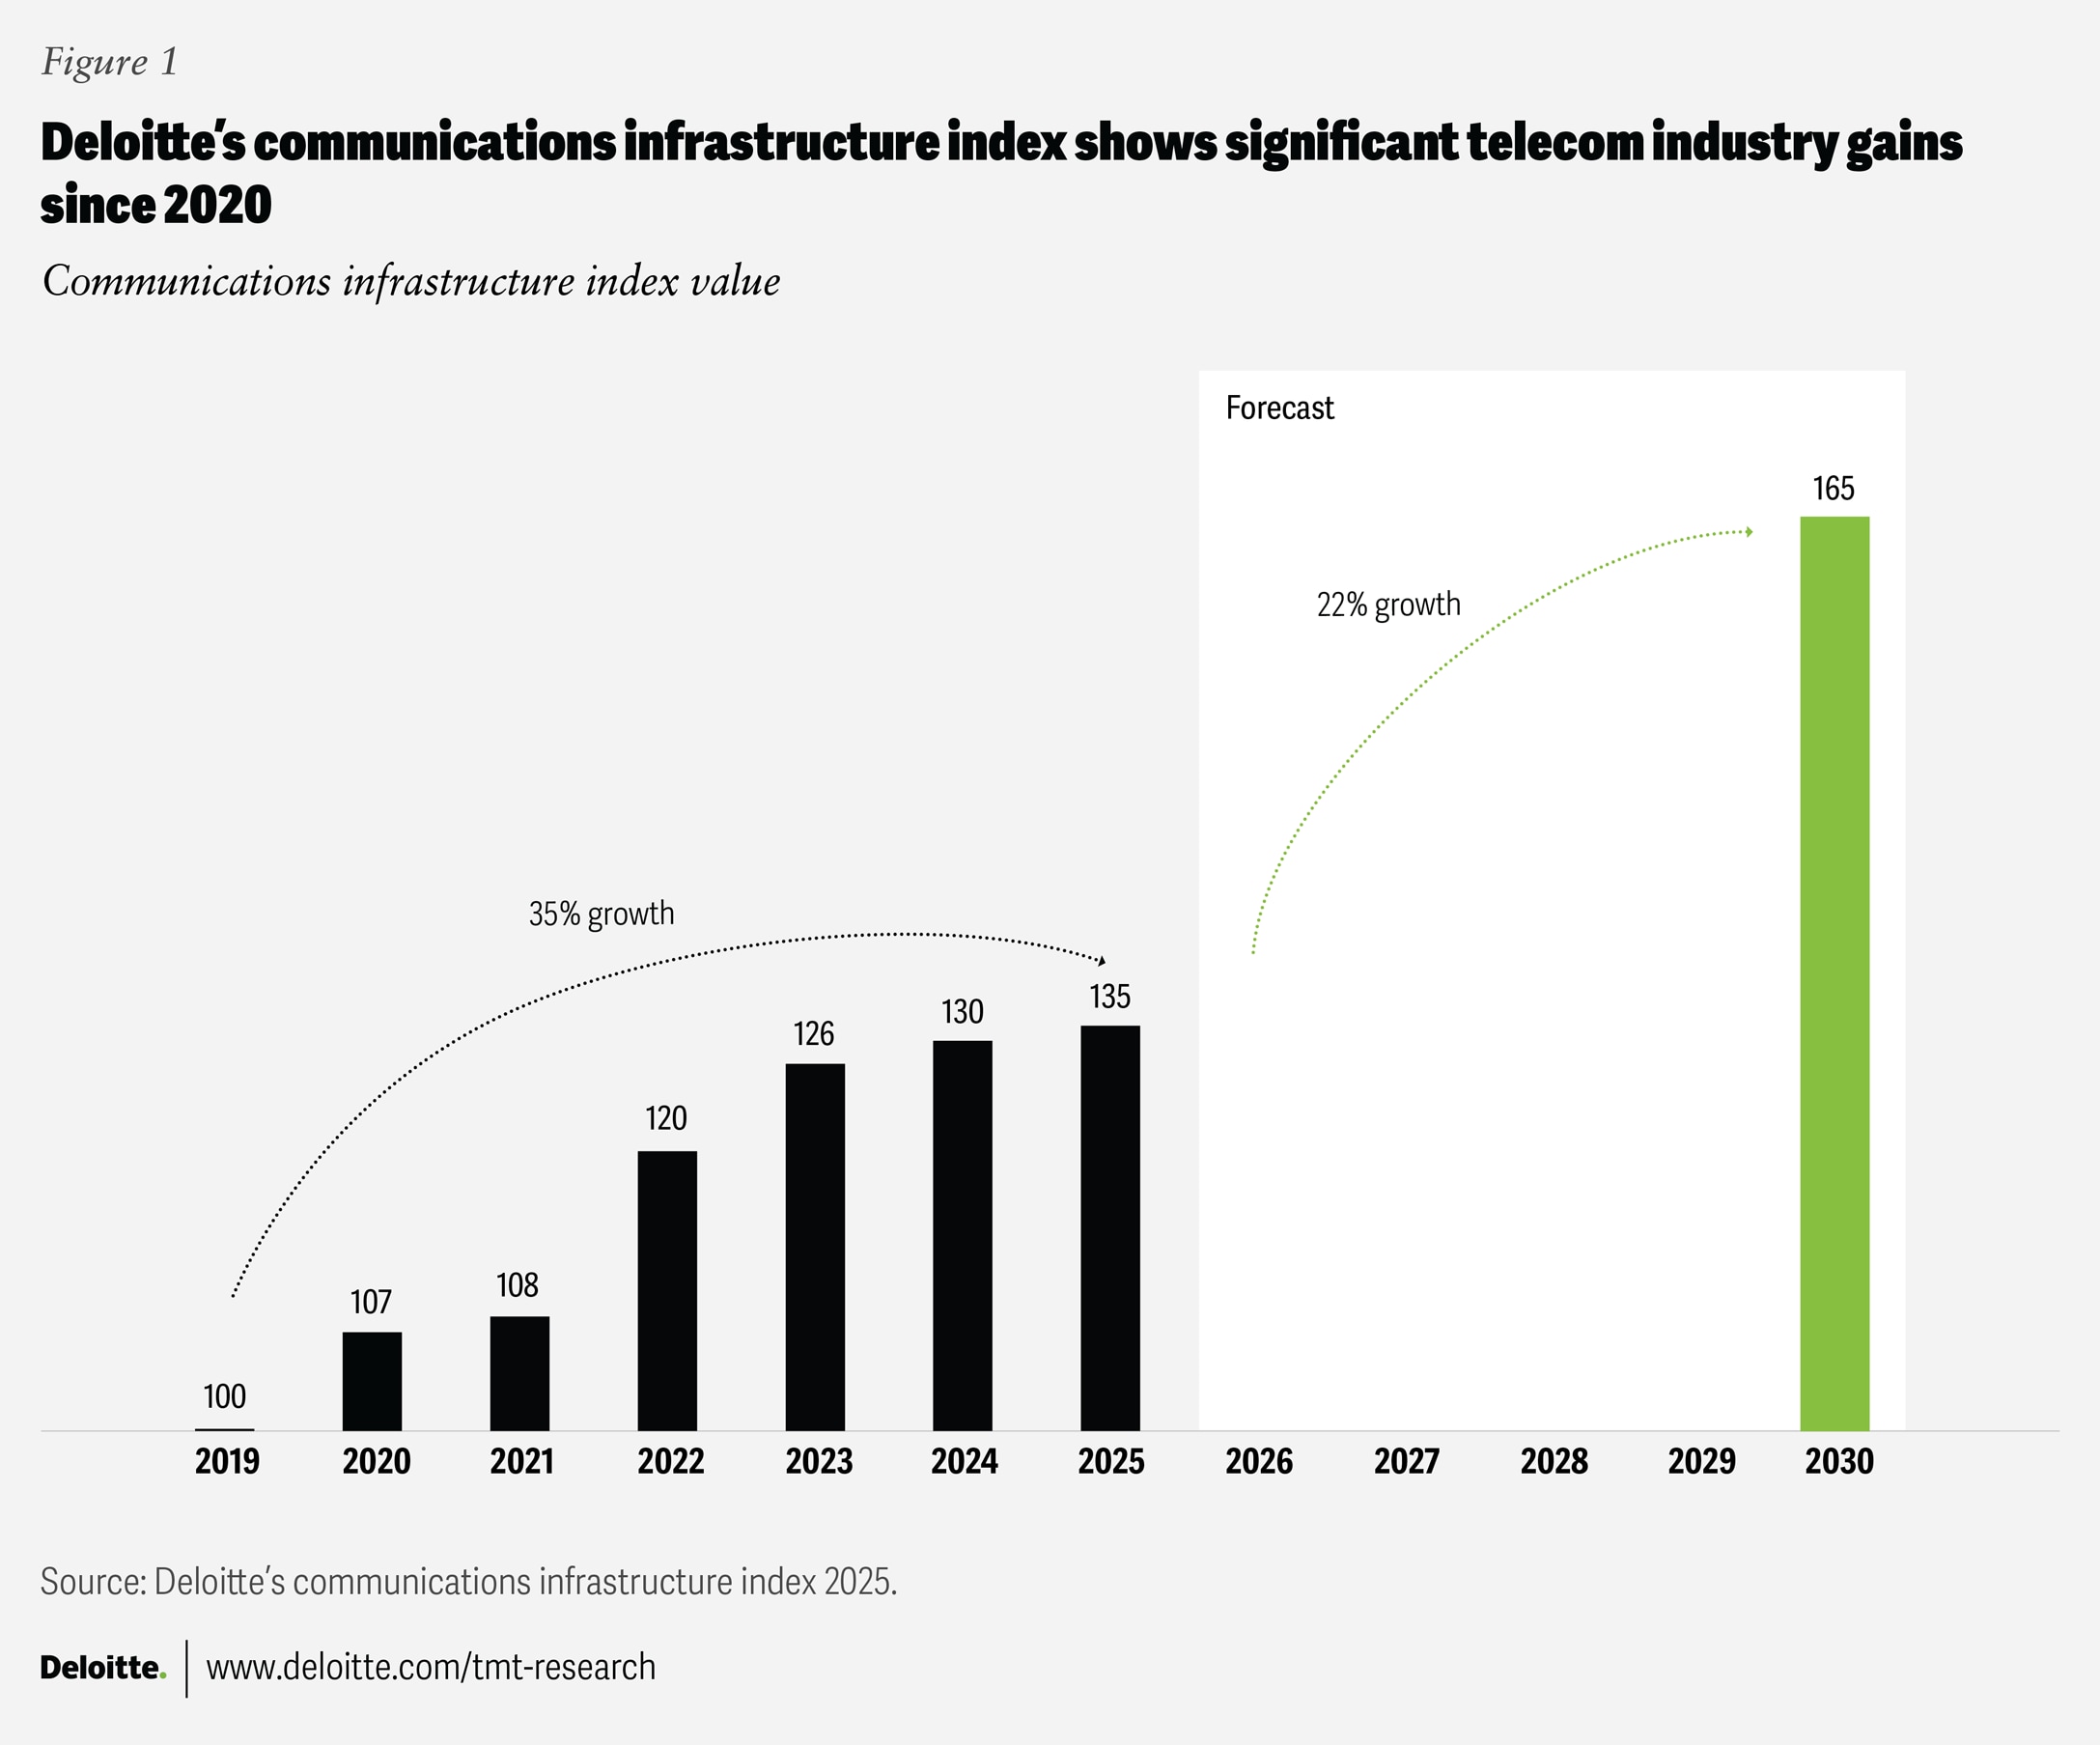
Increased competition and stable broadband and wireless prices helped the CII reach another record level of 130 in 2024, with an expected value of 135 for 2025 (figure 1). Deloitte’s CII shows carriers are increasing network speed, capacity, and coverage, but raises tough questions about how they will be able to sustain profits and drive future innovation. Previous strategies of deep-device promotions and bundled discounts likely won’t work in tomorrow’s world. Instead, long-term success may hinge on relentless automation and a renewed focus on customer experience powered by agentic automation and network intelligence to keep reinvesting in our digital foundation.
The 2024 value represents 3.2% growth versus 2023’s value of 126. This year’s results depict a communications industry that continues its track record of scaling to meet evolving connectivity demands, including rapidly growing usage and an expanding population of connected users and devices. However, a closer examination of the 20 metrics that comprise the CII demonstrates that this positive trajectory may be at risk of changing direction without business-model and cost-structure changes. Stable prices, higher competitive intensity, and higher usage helped drive CII gains in 2024, as well as forecasted gains for 2025.
Meanwhile, measures of investment and deployed infrastructure, such as capital expenditures, government spending on telecom infrastructure, and spectrum availability, were either flat or exerted downward pressure on the index.1
While an increasing CII driven by lower prices and greater competition can benefit consumers, it could also raise questions regarding the future health of the industry if advancements in deployed infrastructure and spectrum don’t take place.
- Could lower prices and greater competitive intensity reduce margins and limit carriers’ future ability to invest in network infrastructure?
- Now that network coverage and reliability are rated highly, how might carriers differentiate beyond prices or add-ons?
- As AI agents lower customer-acquisition costs for carriers and make it easier for consumers to switch providers, can carriers still afford legacy pricing and promotions that assume a 10-year average customer lifespan?
A closer look at the forces driving CII gains and some risks ahead
Within the market or demand category, index growth was supported by a flattening of wireless average revenue per user (ARPU) growth in 2024, which continued into 2025.2 Broadband ARPU continued to be flat as competition intensified, especially from fixed wireless access (FWA).3 Meanwhile, customers continued to get more for the same or less money as both wireless and broadband usage grew at historical rates.4
Increased competition also factors into CII growth: Aggressive fiber deployments from the major carriers and overbuilders (that is, start-ups or small carriers deploying their own infrastructure at the same location as major telcos or cable providers) drove an increase in the number of homes passed by two or more broadband providers capable of delivering 100 Mbps upstream and 20 Mbps downstream.
By June 2025, more than 100 million US households enjoyed competition from two or more broadband providers—an increase of approximately 7 million households in 12 months.5 We expect this trend to continue as fiber builds and FWA coverage expand. Moreover, we expect that broadband provided by low Earth orbit satellites could become an even larger factor into future versions of CII as capacity continues to increase, driven by more satellites, especially more advanced ones from multiple providers.
Metrics in the deployed infrastructure and spectrum categories factored less into CII growth, with some metrics exerting downward pressure. Within the deployed infrastructure category, CII gains were driven by moderate increases in the number of homes passed by 100/20 broadband and increased wireless speed as carriers deployed more spectrum to augment their extensive 5G networks.6 Wireless and broadband reliability also showed gains.7
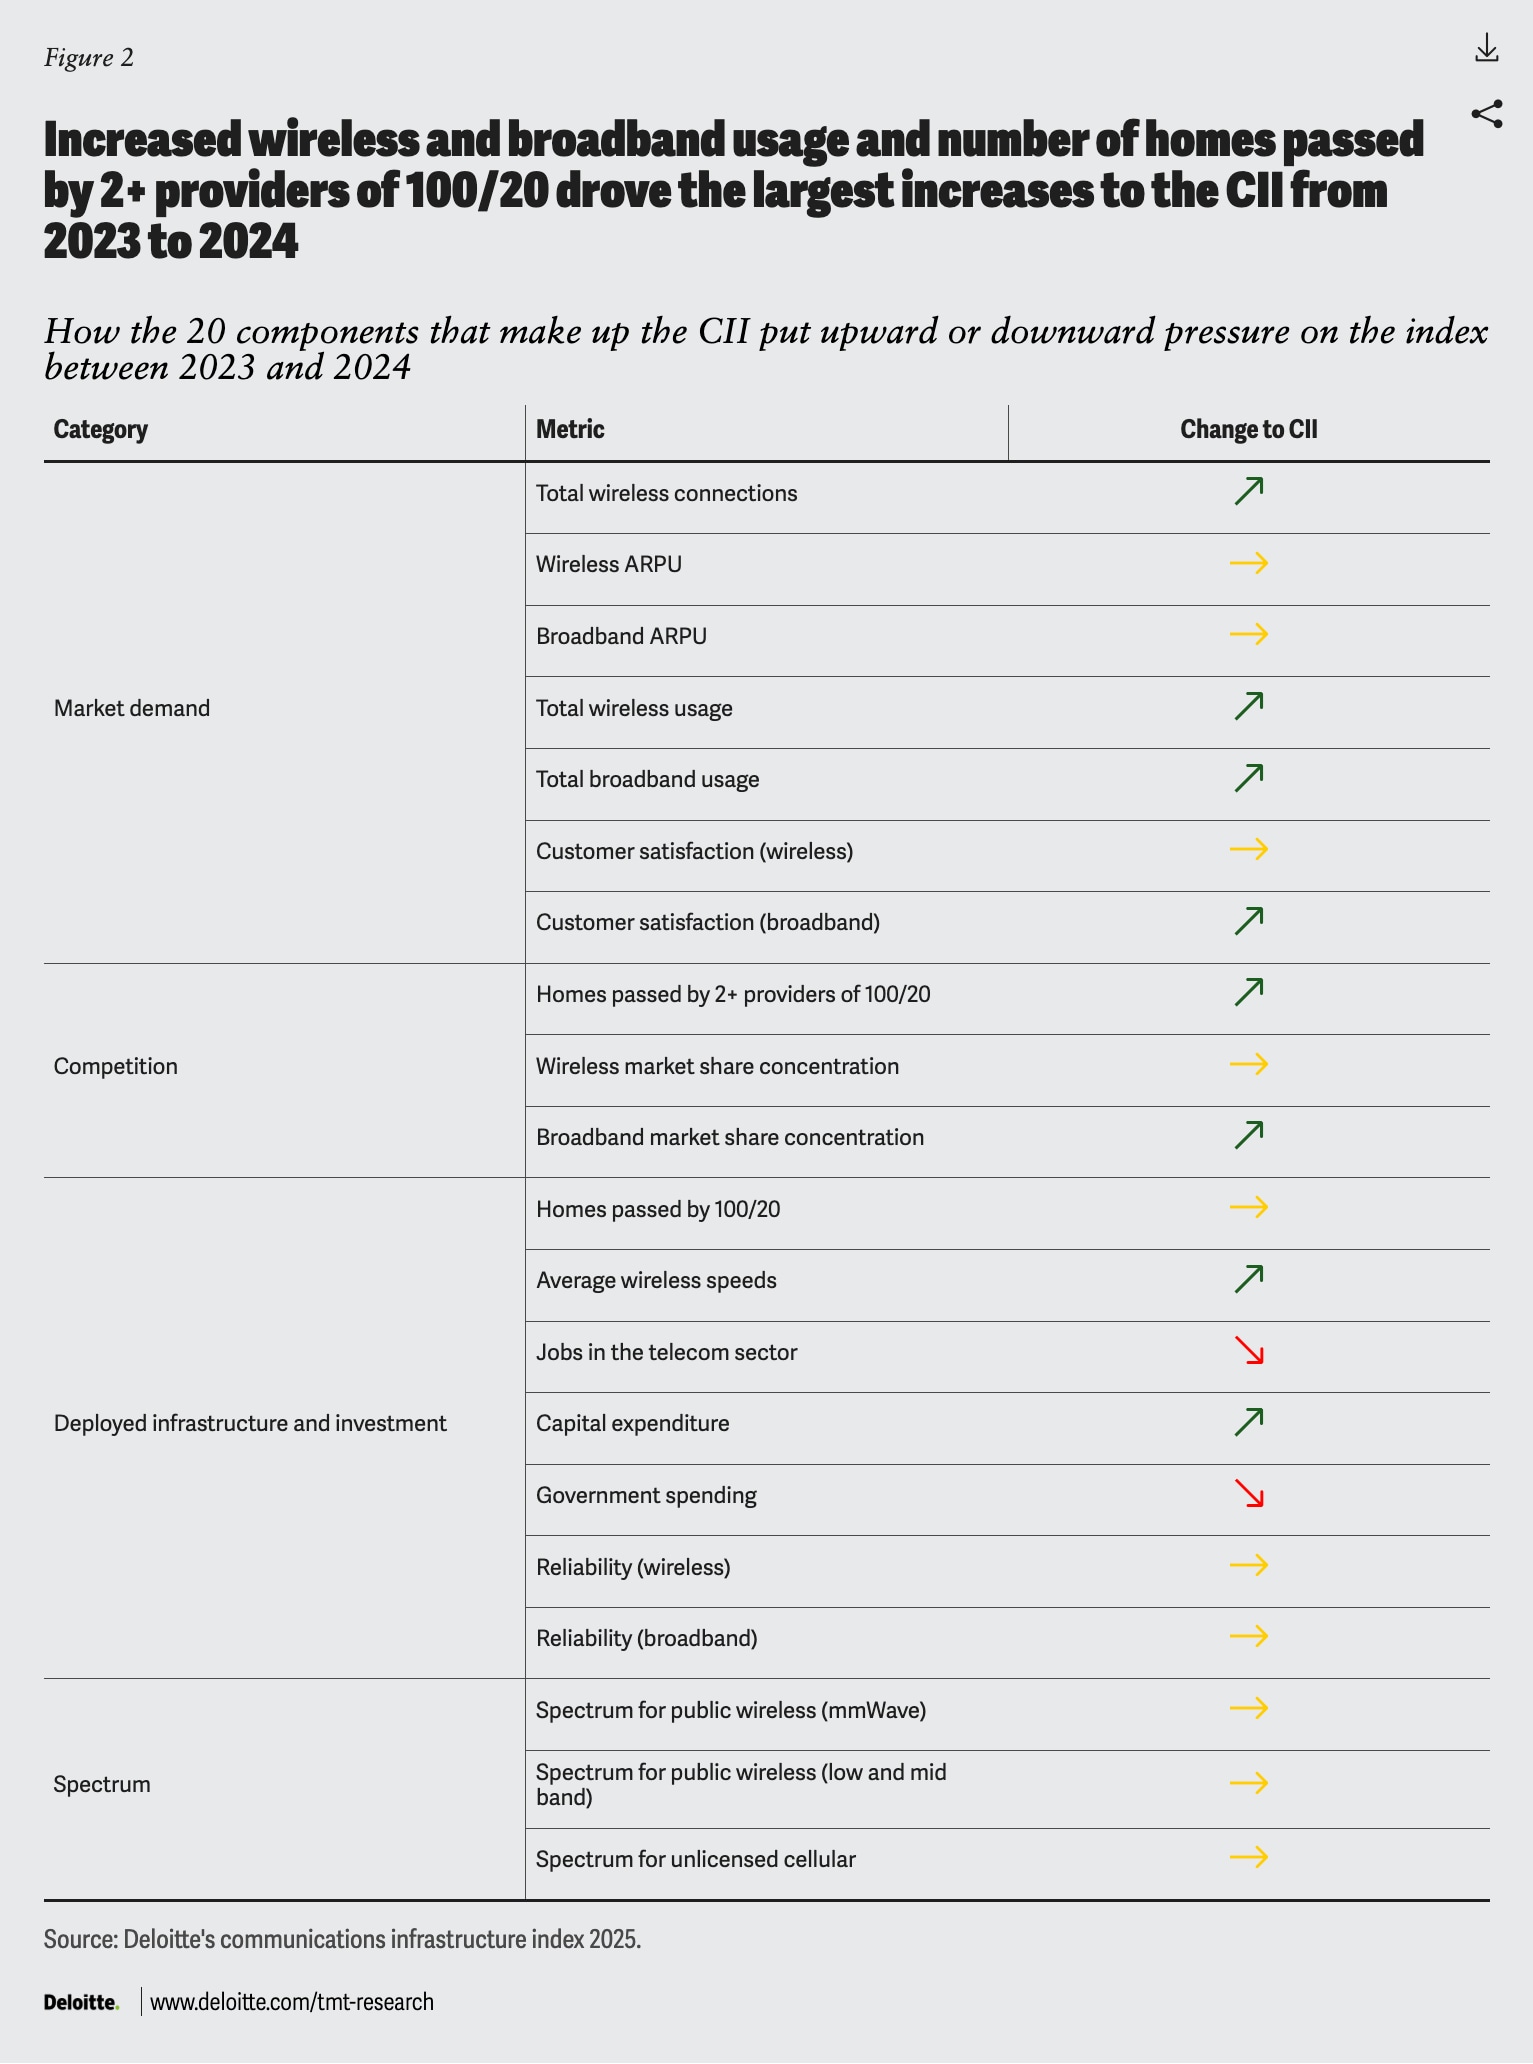
However, many metrics within the deployed-infrastructure category remained relatively flat since 2023. Capital expenditures by carriers was slightly higher and government spend decreased—although both are at historically high levels.8 Aside from direct government spending, additional tax incentives may help accelerate communications infrastructure investment in future years. For the fourth straight year, spectrum also remained flat as no new spectrum became available in 2024 or 2025.9 We expect that this may change with auctions in mid-2026 and beyond. Jobs in the telecom sector continue to decline, with an overall loss of approximately 50,000 jobs since 2022.10 The loss of jobs exerts downward pressure on the CII even as labor shortages threaten to impact the pace of fiber deployment. See figure 2 for relative contribution of each of the 20 metrics to CII growth from 2023 to 2024.
Figure 2
Increased wireless and broadband usage and number of homes passed by 2+ providers of 100/20 drove the largest increases to the CII from 2023 to 2024
How the 20 components that make up the CII put upward or downward pressure on the index between 2023 and 2024

Implications for carriers: Profitability, reinvestment, and AI-driven automation
Over the past five years, CII results show an industry that continues to build capacity and service ever-increasing demand while maintaining relatively flat infrastructure investments. For example, despite modest growth in capital expenditures and declining government investment, the CII shows gains in average wireless speeds and the number of US homes passed by at least 100/20 Mbps broadband (92% US households in 2024).11
Moreover, the CII shows that carriers have been effective in implementing solutions that have allowed for a 13% decline in industry workforce since 2019 while still increasing network reliability and servicing growing usage that has increased 131% on wireless networks and 122% on broadband networks.12 CII data shows that US carriers have succeeded in doing more with less.
Given this drive for increased automation and efficiency, the industry, in many ways, still operates as it did 10 or even 20 years ago. Historically, attracting customers with expensive device promotions and discounted bundled pricing relied on relatively low and stable churn rates to generate customer lifetime values that maintained margins. However, in 2026, customers may be moving on from this historical paradigm.
Succeeding in an industry marked by network parity, lower prices, greater competition, and lower customer switching costs may be about more than product differentiation or launching more expensive promotions. Instead, continually reinvesting in the nation’s communications infrastructure requires generating profits, which, in turn, includes focusing on customer satisfaction and a cost structure fit for the future.
This evolution may not be able to wait for a traditional large-scale transformation program lasting years. Instead, technology enablers, led by AI agents, eSIM, and network automations could dramatically reduce cost structures in the short term. Agentic software development, delivery management, sales, order management, and network operations can generate dramatic savings in service delivery and service assurance costs. Such savings can help carriers lower cost per bit, simplify the customer experience, and generate margins that create a feedback loop for network reinvestment.
Methodology
The communications infrastructure index, compiled by Deloitte’s telecom practice in conjunction with the Deloitte Center for Technology, Media & Telecommunications, is a composite index derived from 20 metrics from sources including government agencies, Deloitte analysis of telecom company filings, and industry reports. The underlying metrics were grouped into four overarching categories, each weighted to reflect their importance to long-term infrastructure performance.
Continue the conversation
Meet the industry leaders
Jeff Loucks
Dan Littmann
Jack Fritz
Duncan Stewart
Tim Krause
Carleigh Joiner
by
Jeff Loucks
Dan Littmann
Jack Fritz
Duncan Stewart
Tim Krause
Carleigh Joiner
The authors would like to thank Prashant Raman from Deloitte’s Center for Technology, Media & Telecommunications for helping with project management; Colleen O'Donnell for her contributions and insights; the MiNDS team, namely Sandeep Vellanki and Akshay Jadhav for their support in developing the index; and Alison Zink, Amy Booth, Carolyn Werner, and Faith Hotchkiss for marketing and PR support.
Editorial (including production and copyediting): Andy Bayiates, Prodyut Borah, Sayanika Bordoloi, Annalyn Kurtz, and Arpan Kr. Saha
Design: Molly Piersol
Cover artist: Sanaa Saifi
Knowledge Services: Vanapalli Viswa Teja
Visit the Deloitte Center for Technology, Media & Telecommunications
Access more insights for the technology, media, and entertainment; semiconductor; telecommunication; and sports sectors.