
The resilience reset: Five shifts reshaping the oil and gas industry
As disruption becomes increasingly structural, oil and gas companies can strengthen their competitive edge by acting faster, sensing change earlier, and building more adaptive operations
The oil and gas industry is often operating in an evolving environment shaped by policy actions, supply chain dynamics, tariffs, and geopolitical conditions. The levers that drove competitive advantage for the industry in the past decade (such as cost per barrel, digitization, and value-chain optimization) remain important, but they create reliable value when the operating environment is stable, which is less frequently the case.
Today, the value of a barrel, a gallon, or a cubic foot depends on the ability to move, price, contract, and deliver it reliably. And while recent conflicts and escalations may have rewired global oil and liquefied natural gas around new routes,1 several factors—ranging from cyber events and technology shifts to talent constraints and an unpredictable market—are all driving disruption in the industry.2
Amid this backdrop, five shifts are contributing to a new competitive landscape.
1. The demand curve is diverging across fuel type, geography, and end-use segments.
2. The competitive edge is increasingly shifting from asset ownership to acting on intelligence.
3. Demand driven by the artificial intelligence infrastructure is another source of pressure on supplies of important equipment and spares.
4. Resilience is evolving from amassing redundancy to accessing it quickly.
5. Advanced AI is accelerating access to insights, but organizational processes can impact the speed of decision-making.
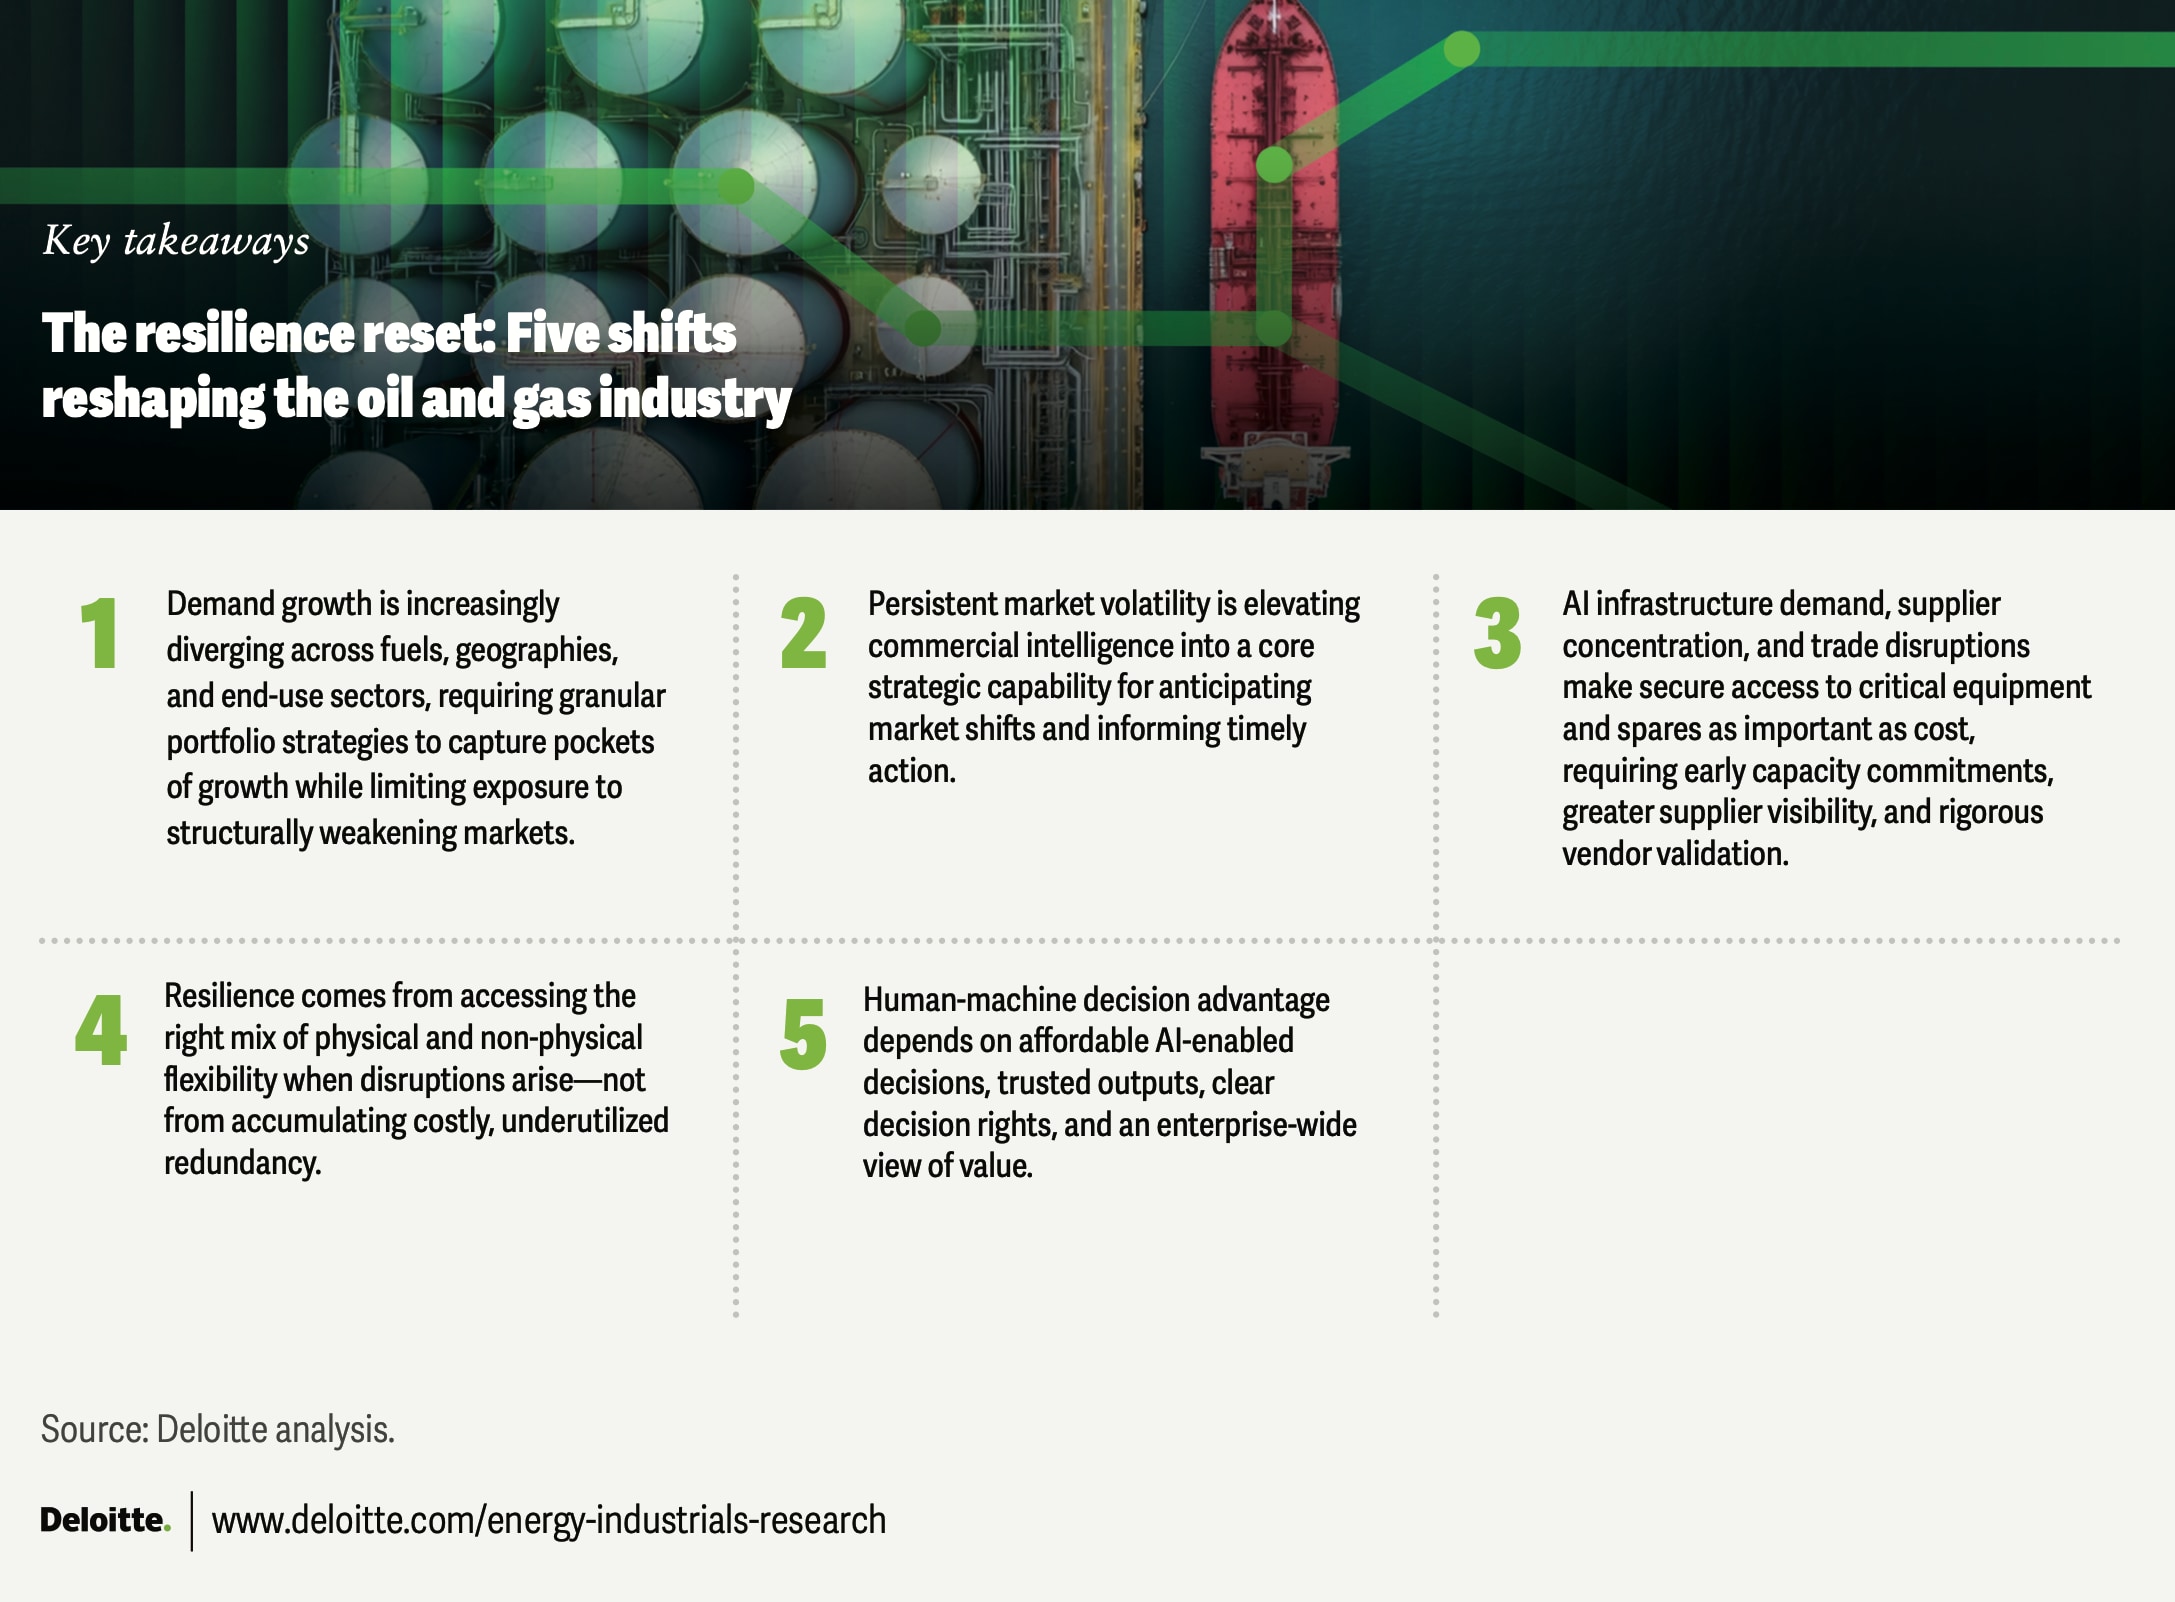
The first four shifts point to where the industry appears to be headed, although the degree of their impact varies across the value chain. All four require the same response: faster, better-informed decisions that can keep pace with each change. The fifth shift is an important enabler: Timely and effective leadership decisions can help determine whether companies can act on the other four.
1. Positioning for demand divergence
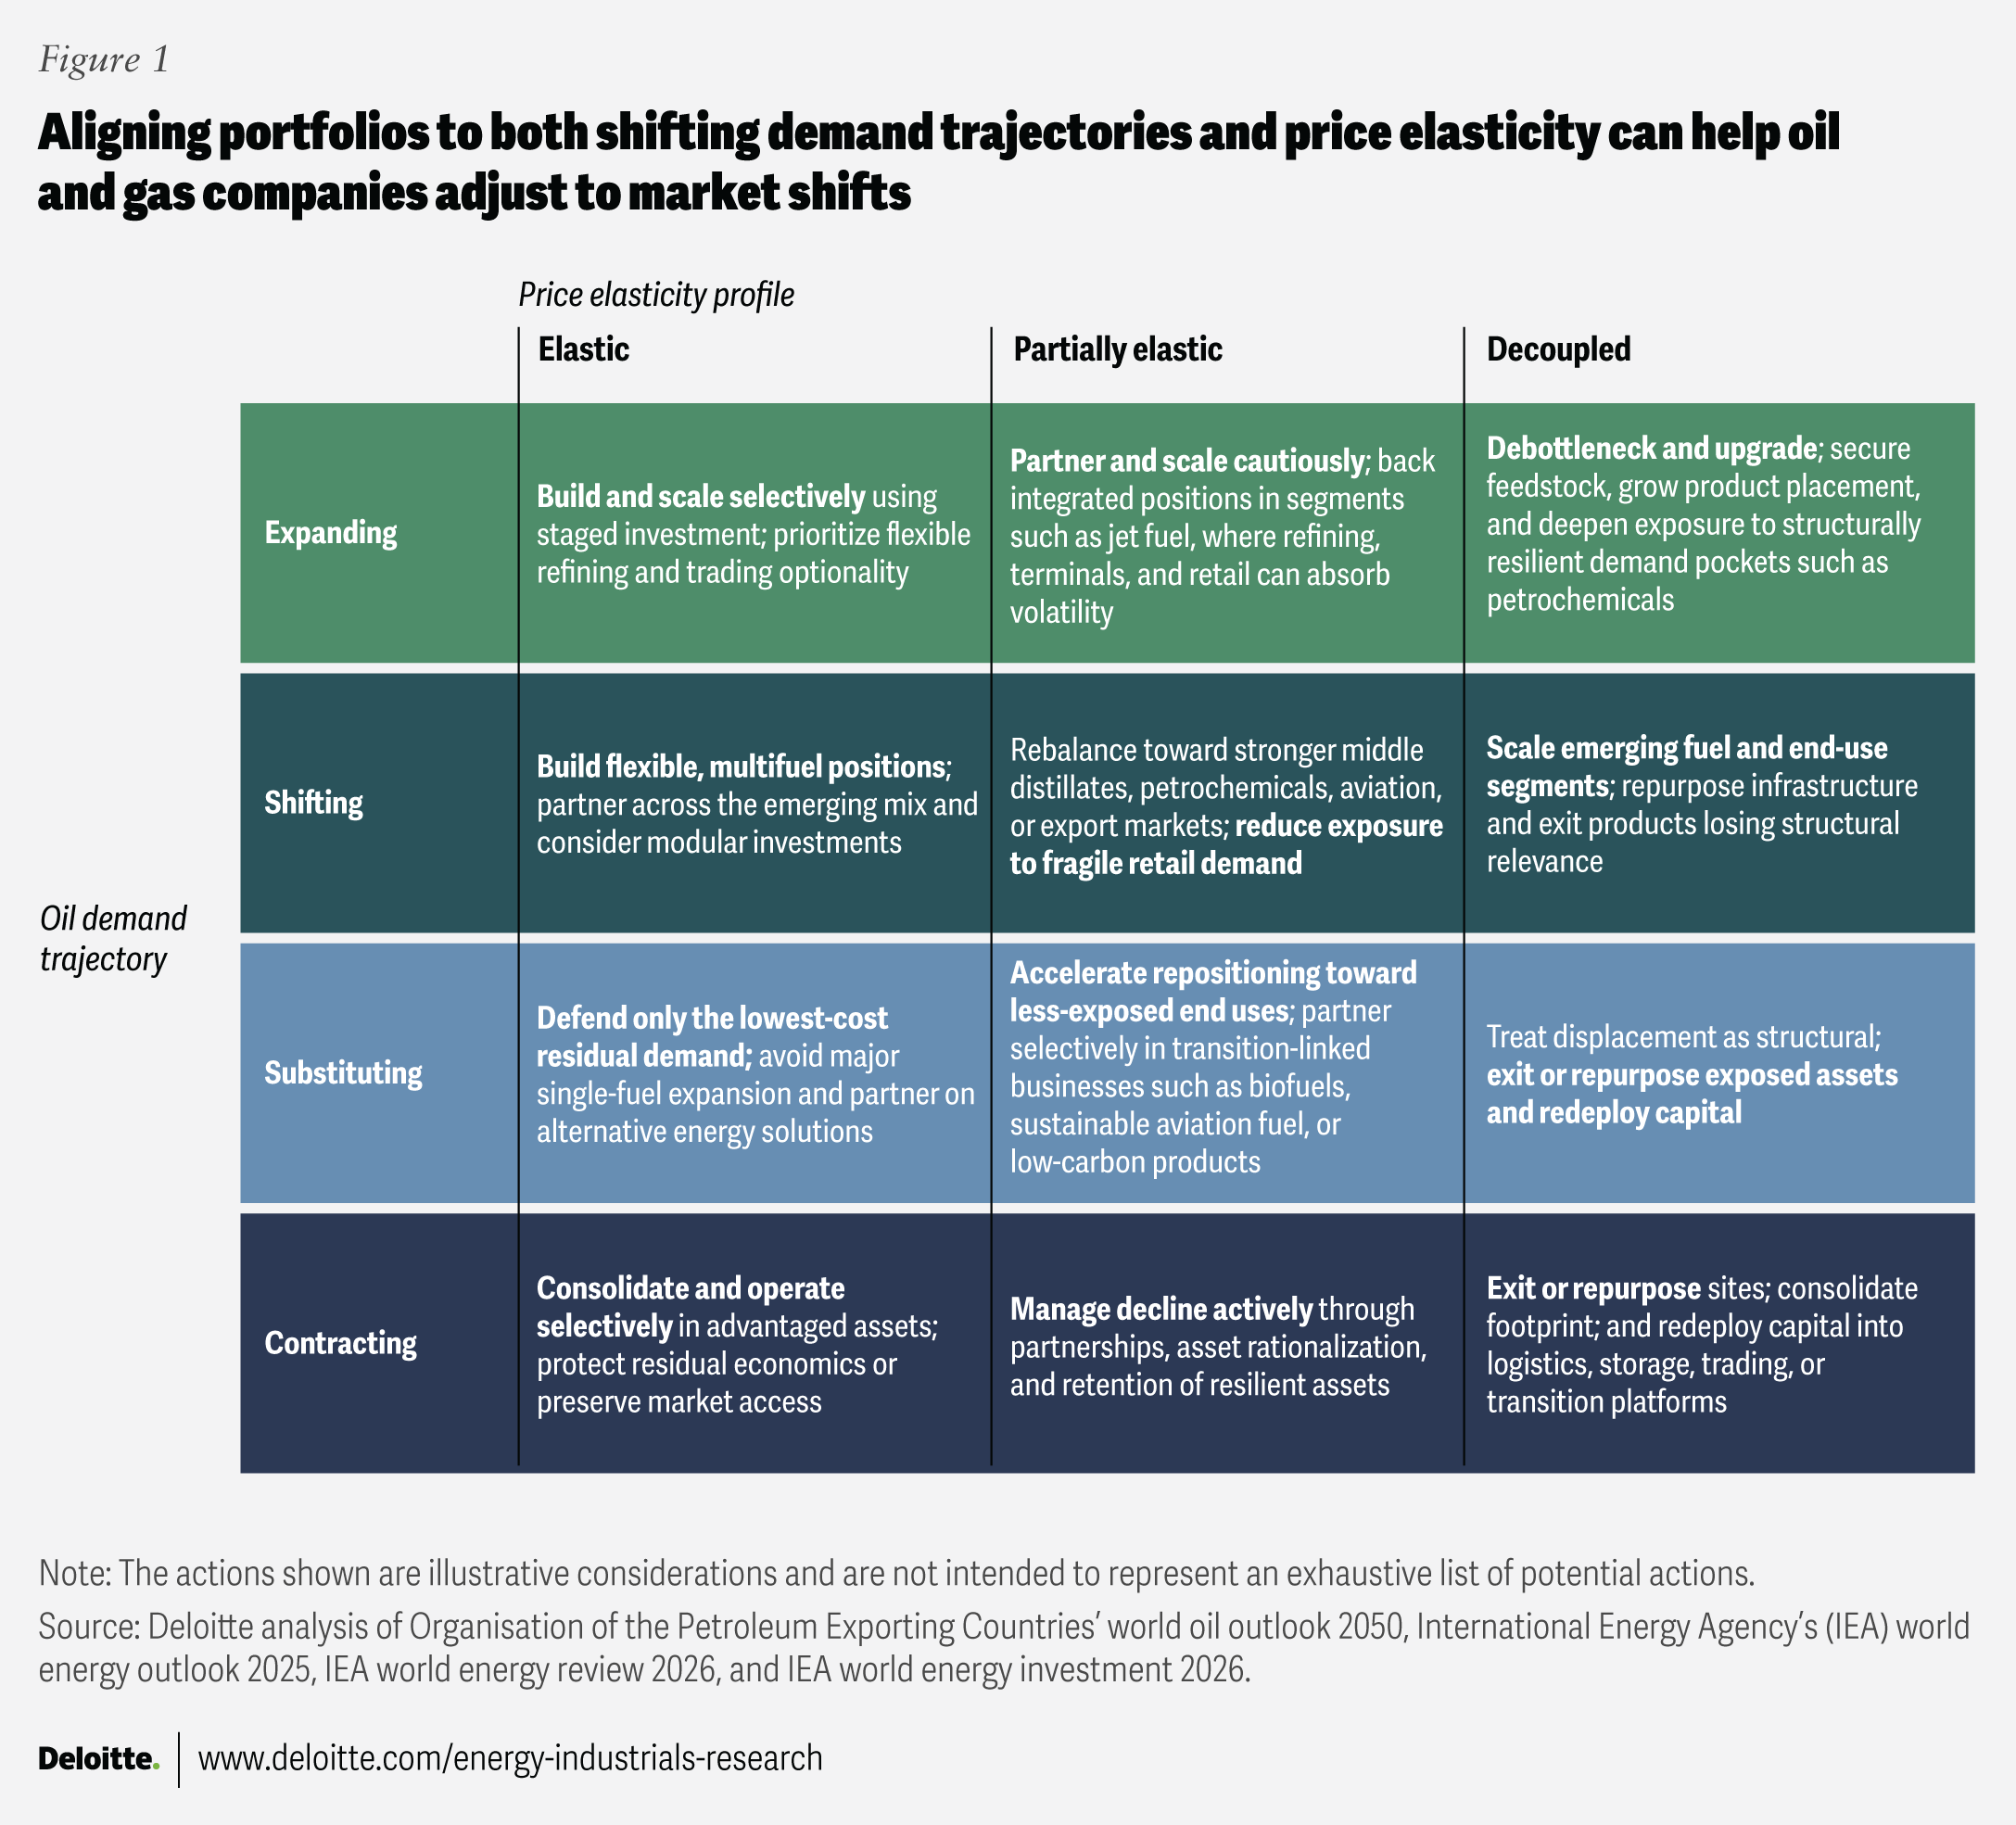
One strategic question for oil and gas (O&G) companies is: Where will demand grow, erode, or become unpredictable? Oil demand can be better understood through two additional lenses: regional or segment trends and shifting price elasticities. A growing segment can remain fragile if demand is highly price-sensitive, while a shrinking segment may be defensible if demand has decoupled from price movements.
- Global petrochemical feedstock demand is projected to grow nearly twice as fast as transport fuel demand between 2025 and 2030, rising from 16.1 million barrels per day (mb/d) in 2025 to 18.0 mb/d by 2030.3 This shift is clear among the European members of the Organisation for Economic Co-operation and Development (OECD) and now in OECD Asia-Pacific, where petrochemical demand is expected to rise by 10% over the same period.4
- Transport fuel demand growth is slowing, but it still accounts for nearly 60% of global oil demand.5 Road transport once dominated O&G demand modeling, but electrification and efficiency gains are structurally making transportation demand more price-sensitive by giving buyers alternatives when fuel costs rise.6 Between 2015 and 2024, substitution offset close to 1 mb/d of oil demand a year, cutting road transport's gross growth of over 1.5 mb/d.7 Between 2025 and 2030, oil demand from road transport in OECD Asia-Pacific could fall by 4%.8
- Natural gas demand from AI and semiconductors is growing.9 Significant demand is also expected from the buildout of artificial intelligence-related infrastructure, creating a new demand dimension beyond traditional oil consumption.10
Companies can have segment-specific playbooks—build, partner, scale, reposition, or exit—based on demand trajectory and price elasticity. Figure 1 shows actions to consider for each combination of demand trajectory and price elasticity, while reinforcing the need for demand sensing that captures shifts by fuel and region quarterly, not annually.
2. Accelerating value capture from market signals through commercial intelligence
During periods of volatility, margins tend to migrate from O&G companies to large commodity traders, as reflected in their record profits in early 2026.11 One leading commodity trader, for instance, booked its entire 2025 gross profit in a single quarter of 2026.12 That migration is not inevitable, but may reflect a capability gap.
Commercial performance in the industry increasingly depends on market sensing and acting at speed and scale. Yet this capability remains unevenly distributed—in 2025, realized oil and natural gas prices varied by up to US$9 per barrel and over US$1.4 per metric million British thermal units among the top 15 US O&G companies by market capitalization.13 While some variation may reflect hedging strategies, the wide price spread could indicate unrealized value. As capital discipline and shareholder returns constrain production growth, majors’ next returns could come from optimizing the barrels they already produce or refine, making commercial intelligence an important lever for generating alpha (figure 2).
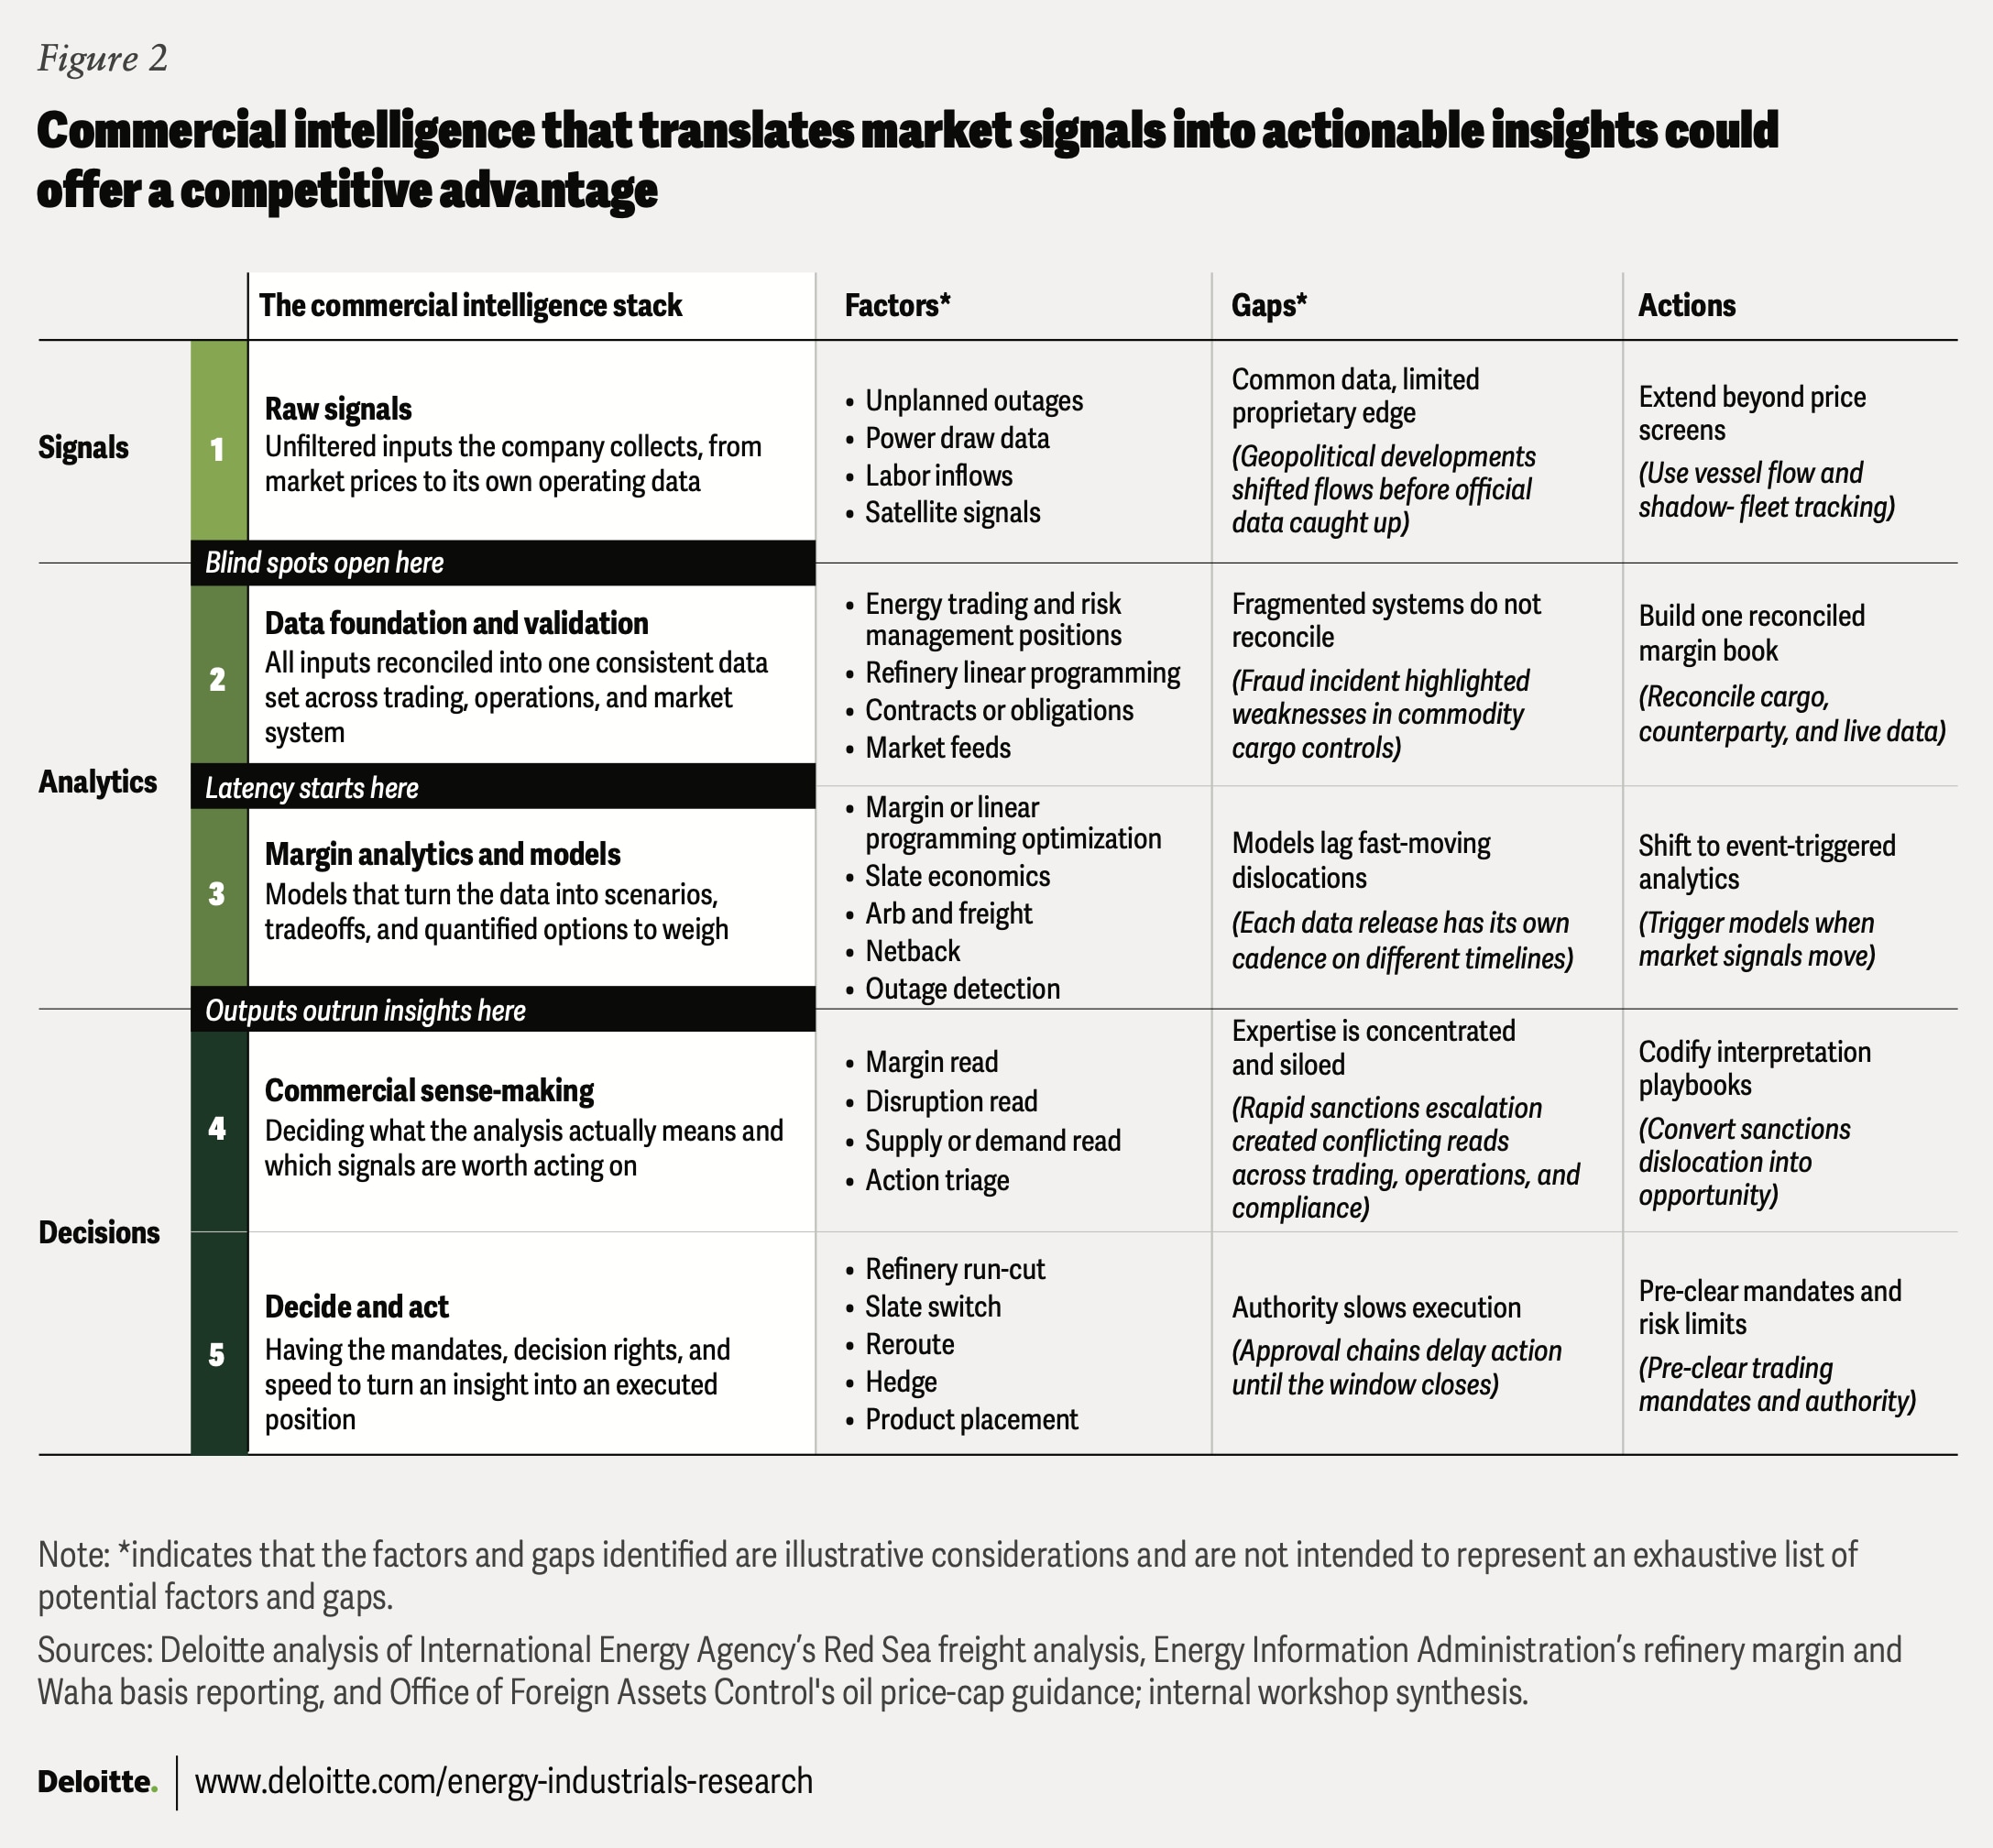
- Signals: Alpha often lies beneath commoditized price and spread views, in raw physical signals such as unplanned outages, thermal or flaring satellite feeds, utility or Independent System Operator (ISO) data for power draw, contractor labor inflows, etc. Fusing these signals with operational data can create a proprietary competitive edge. For example, as plants electrify, a drop in a competitor refinery’s grid-node power use could reveal a run cut or outage hours before it appears in market prices.
- Analytics: A signal can only be as good as its foundation. The competitive edge now is having a validated data layer that connects trading, operations, and market systems into one view. Without it, blind spots can open and decision latency can increase. Signals have their own cadence: power by the minute, cargoes by the day, and market statistics by the month, among others. So, a single refresh rate or a standard analytical model can either lag fast signals or overreact to slow ones.
- Decision latency as operational downtime: The commercial team should agree on which signals justify action, which to set aside for now, and which need triangulated review, with these classifications evolving as market conditions change. Equally important are clear authority and decision rights from management: who can move a position, hedge, or divert a cargo; what limits apply; and when escalation is required. Independent trading houses and vertically integrated majors with large in-house trade books could have a competitive edge here, as their traders often act within a pre-set risk mandate, helping them capture a larger share of the volatility-driven profits during 2025 and 2026.14
Closing the gap in commercial performance involves integrating signal sourcing, a validated analytics layer, and clear decision rights into a single capability, rather than as discrete initiatives. An integrated operating model, supported by fit-for-purpose commodity trading and risk management capabilities, data, and targeted expertise, can help companies translate market intelligence into measurable business value.
3. Building supply certainty amid market volatility
Lead times for important spares and equipment already stretch from months to several years: Compression engines take roughly 30 to 35 months to deliver, and heavy-duty gas turbines now carry lead times of three to seven years.15 This scarcity appears to be structural, not temporary. Disciplined capital allocation and industry cyclicality have given suppliers little reason to add capacity. Margin unpredictability has deterred new entrants, and certification can add years to the qualification process. AI infrastructure development has triggered a scramble for some of the same turbines, transformers, and castings that the O&G industry relies on, further narrowing an already thin vendor pool.16 With assets now running harder, higher utilization leads to more frequent outages and shorter turnaround times, so a missing repair part can take a unit offline rather than simply delay it.17
Procurement teams can no longer optimize for cost alone. They should also address availability, considering tariffs and other conditions that can impact pricing and routing decisions. Companies can negotiate this balance by considering the following.
- Solve for certainty (top-half of figure 3). The critical equipment supply chain has long faced uncertainty.18 Supply certainty may be assumed when multiple suppliers exist, but readiness should include regular checks, not simply counting qualified suppliers in the database. Where few suppliers exist, procurement should secure a position well ahead of need. When capacity can’t be secured ahead of time, the fallback is often internal: Procurement can redirect equipment already secured for lower-priority projects to the most urgent need.
- Solve through diversity and visibility (bottom-half of figure 3). For less critical equipment, cost reduction often remains a priority, and supplier competition can unlock savings. However, a broad supplier base can create a false sense of comfort, as industry consolidation has left many distinct vendors under common ownership.19 Even where ownership is separate, risk may sit several tiers down in a shared, capacity-constrained source. Switching suppliers, therefore, may not be helpful if they depend on the same point of failure. Risk intensifies when competing demand redirects shared capacity toward higher-margin orders, often becoming visible only after delivery delays emerge. Addressing this gap requires visibility beyond immediate vendors and treating supplier independence as something to verify rather than assume.
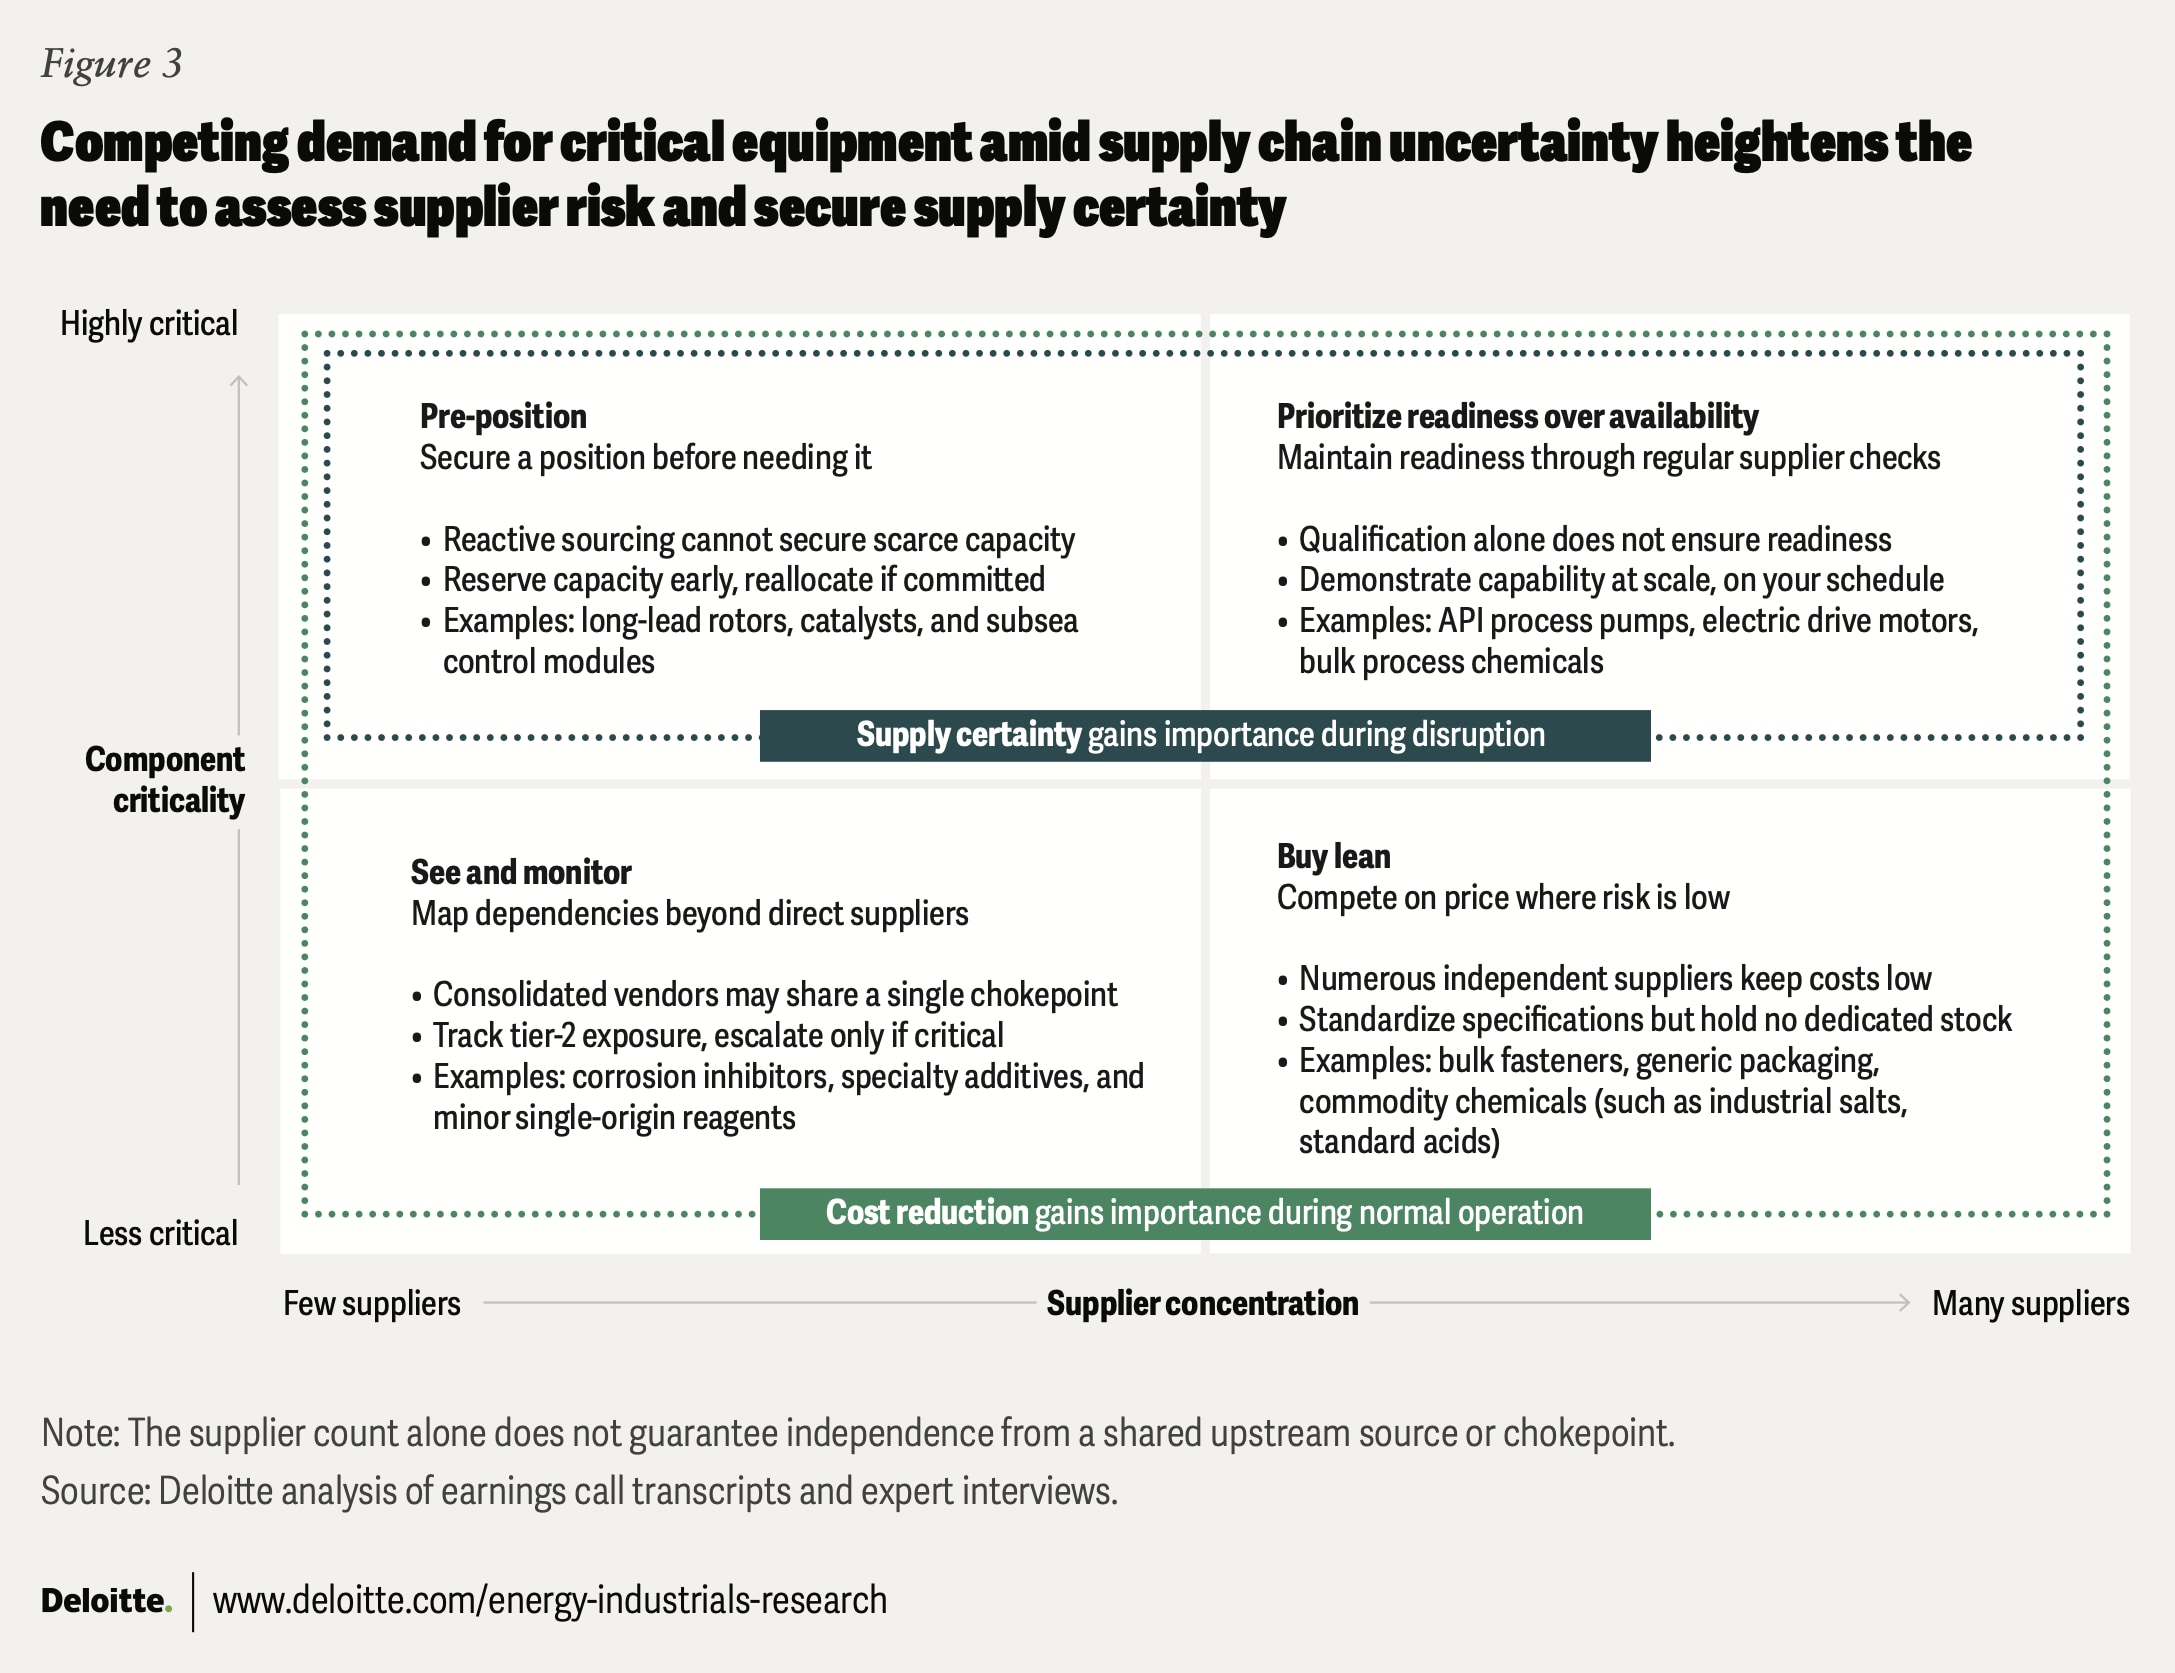
Tariffs and trade policy are influencing supply, pricing, and availability alongside longer-term shifts such as AI infrastructure demand and industry consolidation. This elevates procurement’s role from cost reduction to continuity assurance, enabling teams that embed verification into sourcing decisions to secure supply even when competitors face allocation constraints.
4. Moving from owning redundancy to accessing it on demand
Disruptions over the last few years have underscored the importance of resilience. The instinct might be to rebuild the physical redundancy that a decade of capital discipline, asset rationalization, and lean systems reduced. In 2025, physical redundancy as a share of total assets stood at 10% for large integrated oil companies, roughly 24 basis points below the seven-year average.20
But redundancy can come at a cost, as each percentage-point increase in a company’s redundancy share carries an estimated return on assets drag of roughly 91 basis points in 2025.21 In an uncertain environment, prices can quickly swing in both directions: Crude fell 22% in June 2026 to US$75 per barrel before prices were above US$105 per barrel by mid-September.22 Refiners holding inventories acquired at elevated prices could face markdown losses. Thus, the goal may not be to maximize redundancy but to right-size it and leverage a full portfolio of physical and non-physical levers. Much of this capability may exist inside operators’ trading desks and supply chain teams. It may not have been managed as a resilience portfolio (figure 4).
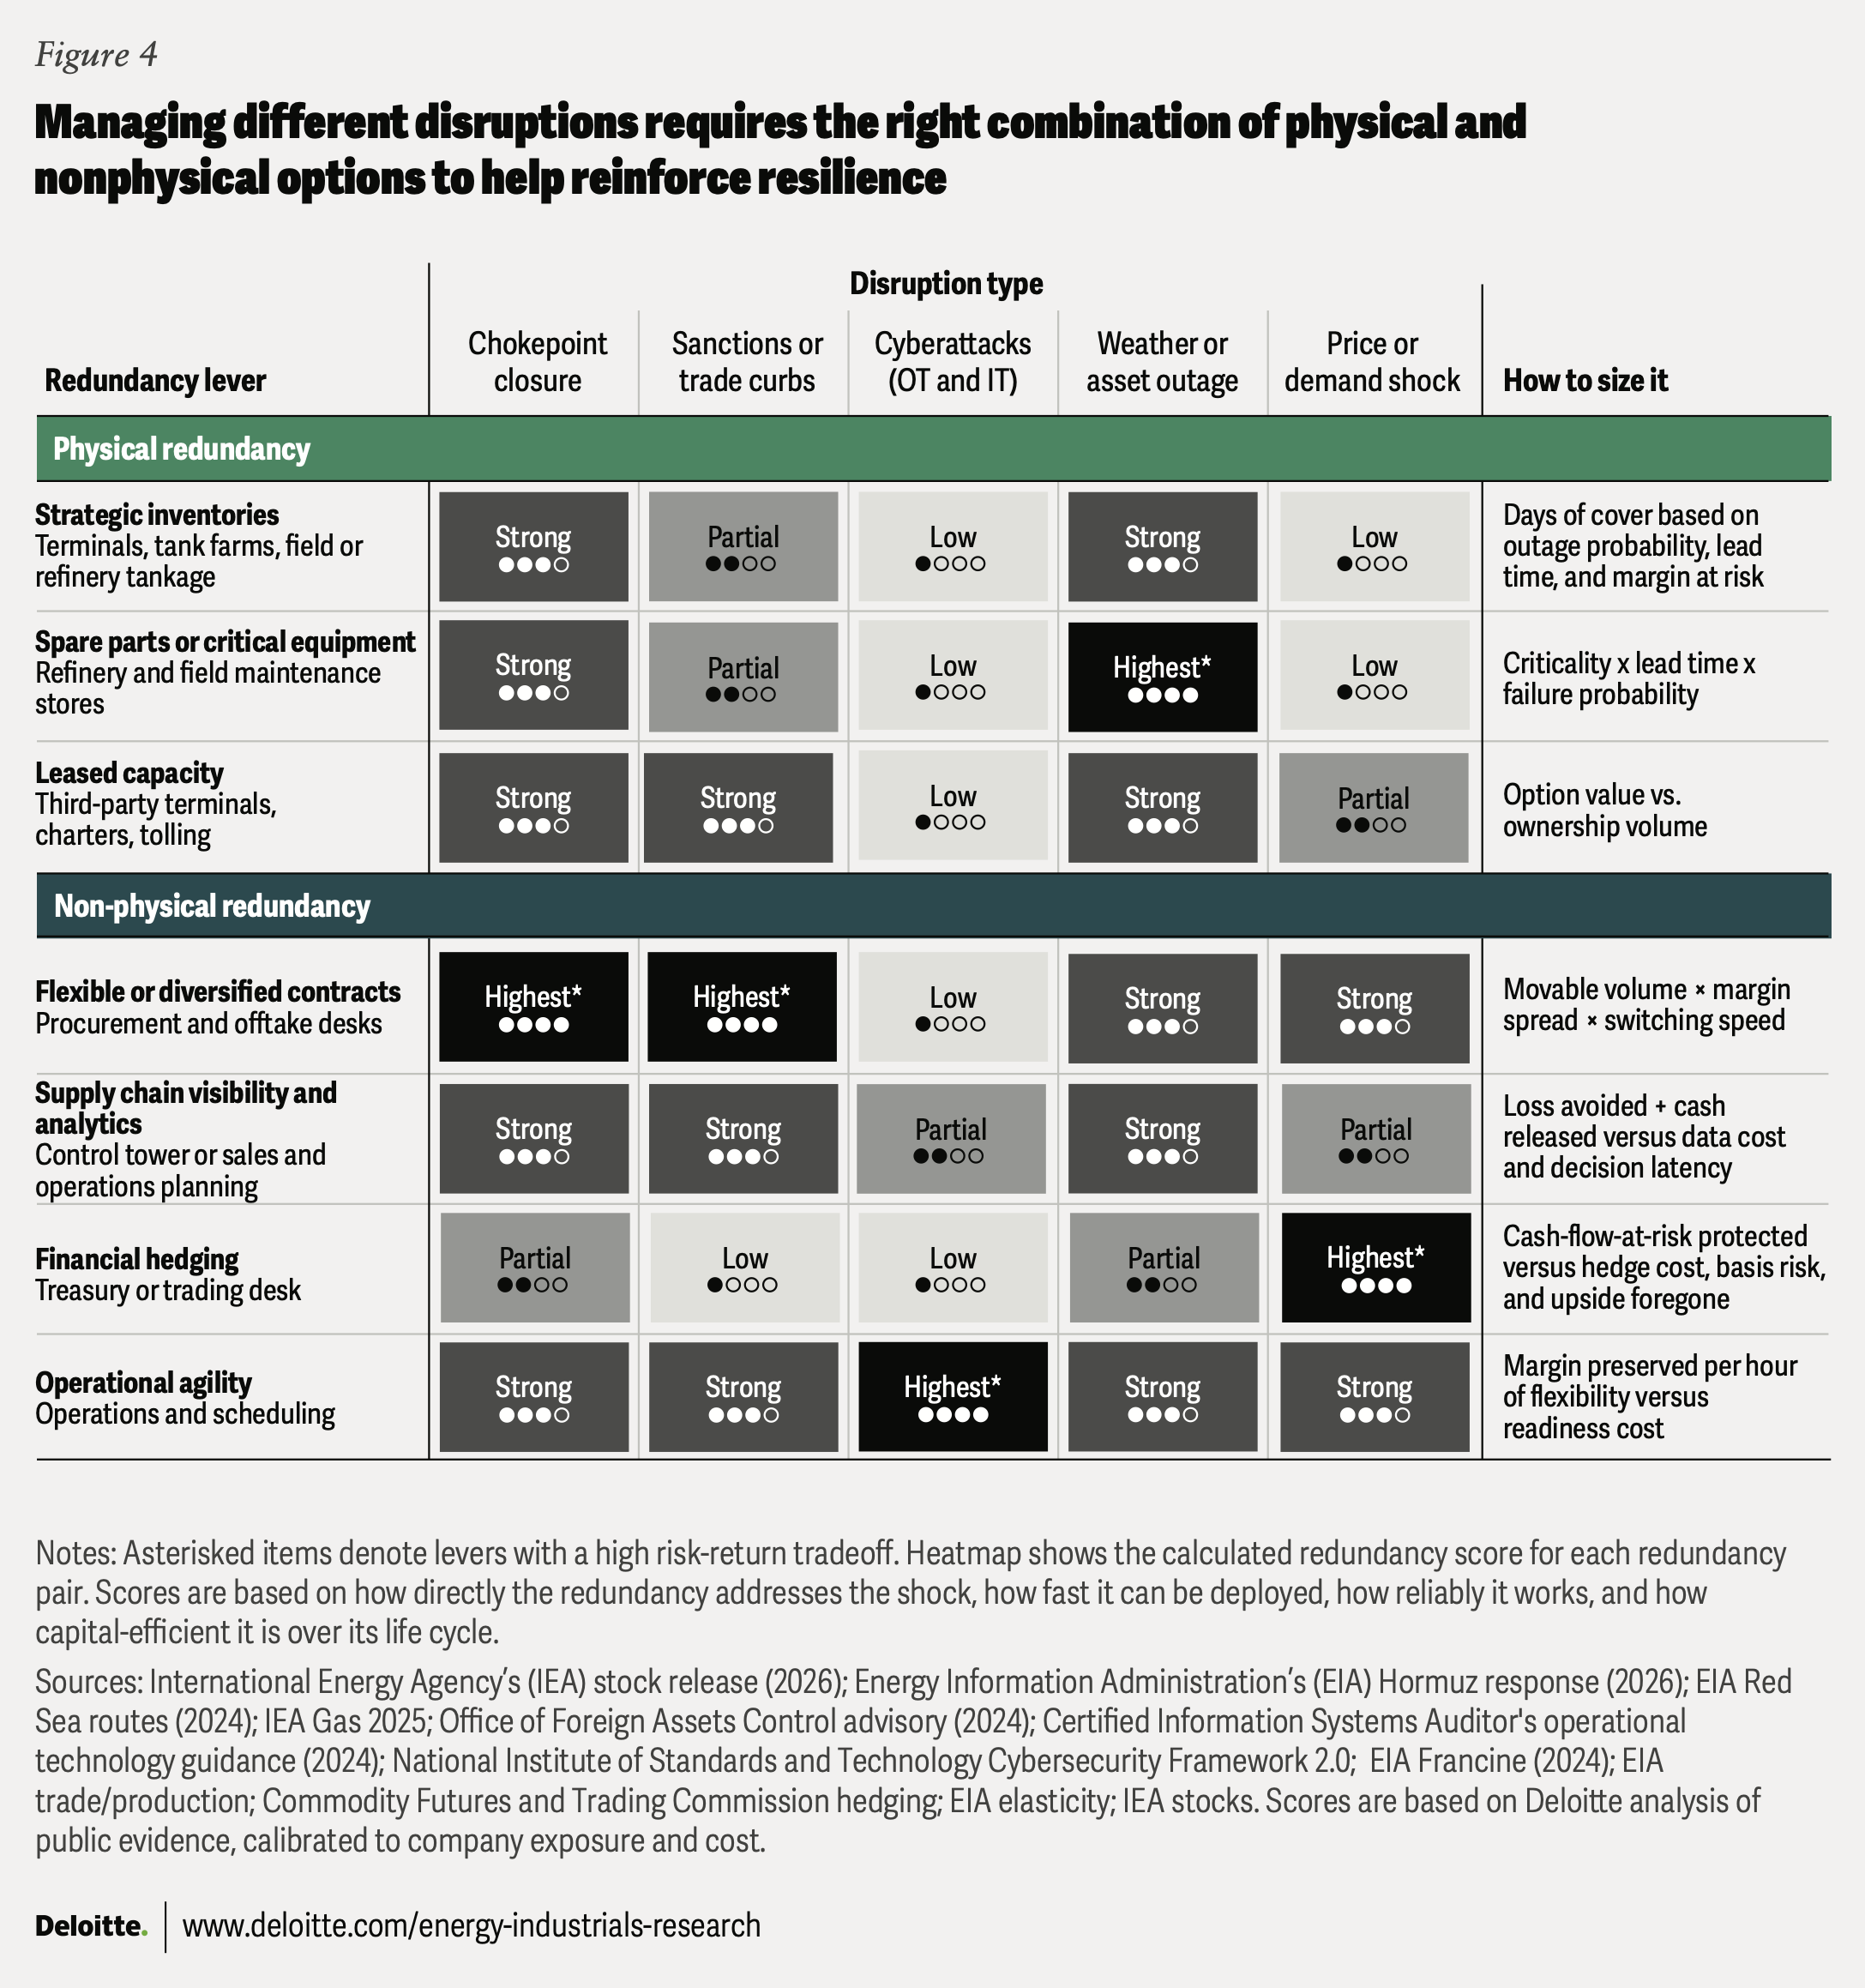
Matching the right redundancy lever to the right disruption can provide protection. Price shocks may require operational flexibility and financial hedging, while a chokepoint closure requires flexible contracts, supply chain visibility for quick rerouting, and pre-positioned inventory, and not a financial hedge alone. No single physical or non-physical redundancy lever covers the full threat set.
Sizing these levers can be a challenge. Rather than buying broad protection against “chokepoint risk,” companies can tailor coverage to a specific corridor or voyage and adjust as conditions evolve, including when a bypass route is disrupted.23 That approach means the company pays for the exposure that exists today, not a blanket premium for risks that may never materialize.
The realizable value, however, comes from activating these levers in time—which is more cultural than structural. This means pushing decision rights to the operational edge, with clear guardrails, so the trader or supply planner closest to the signal can act directly.
5. Resolving the decision-making paradox
Despite unprecedented access to computing power and gen AI, only 13% of energy executives trust AI-generated outputs.24 Humans, meanwhile, are trusted but stretched thinner than ever: The number of employees relative to O&G production (in terms of barrels of oil equivalent per day) fell by 50% in a decade, while 1 in 5 O&G workers is now over 55 years.25 The result is a double squeeze on organizational decision-making, creating four priority areas for consideration (figure 5).
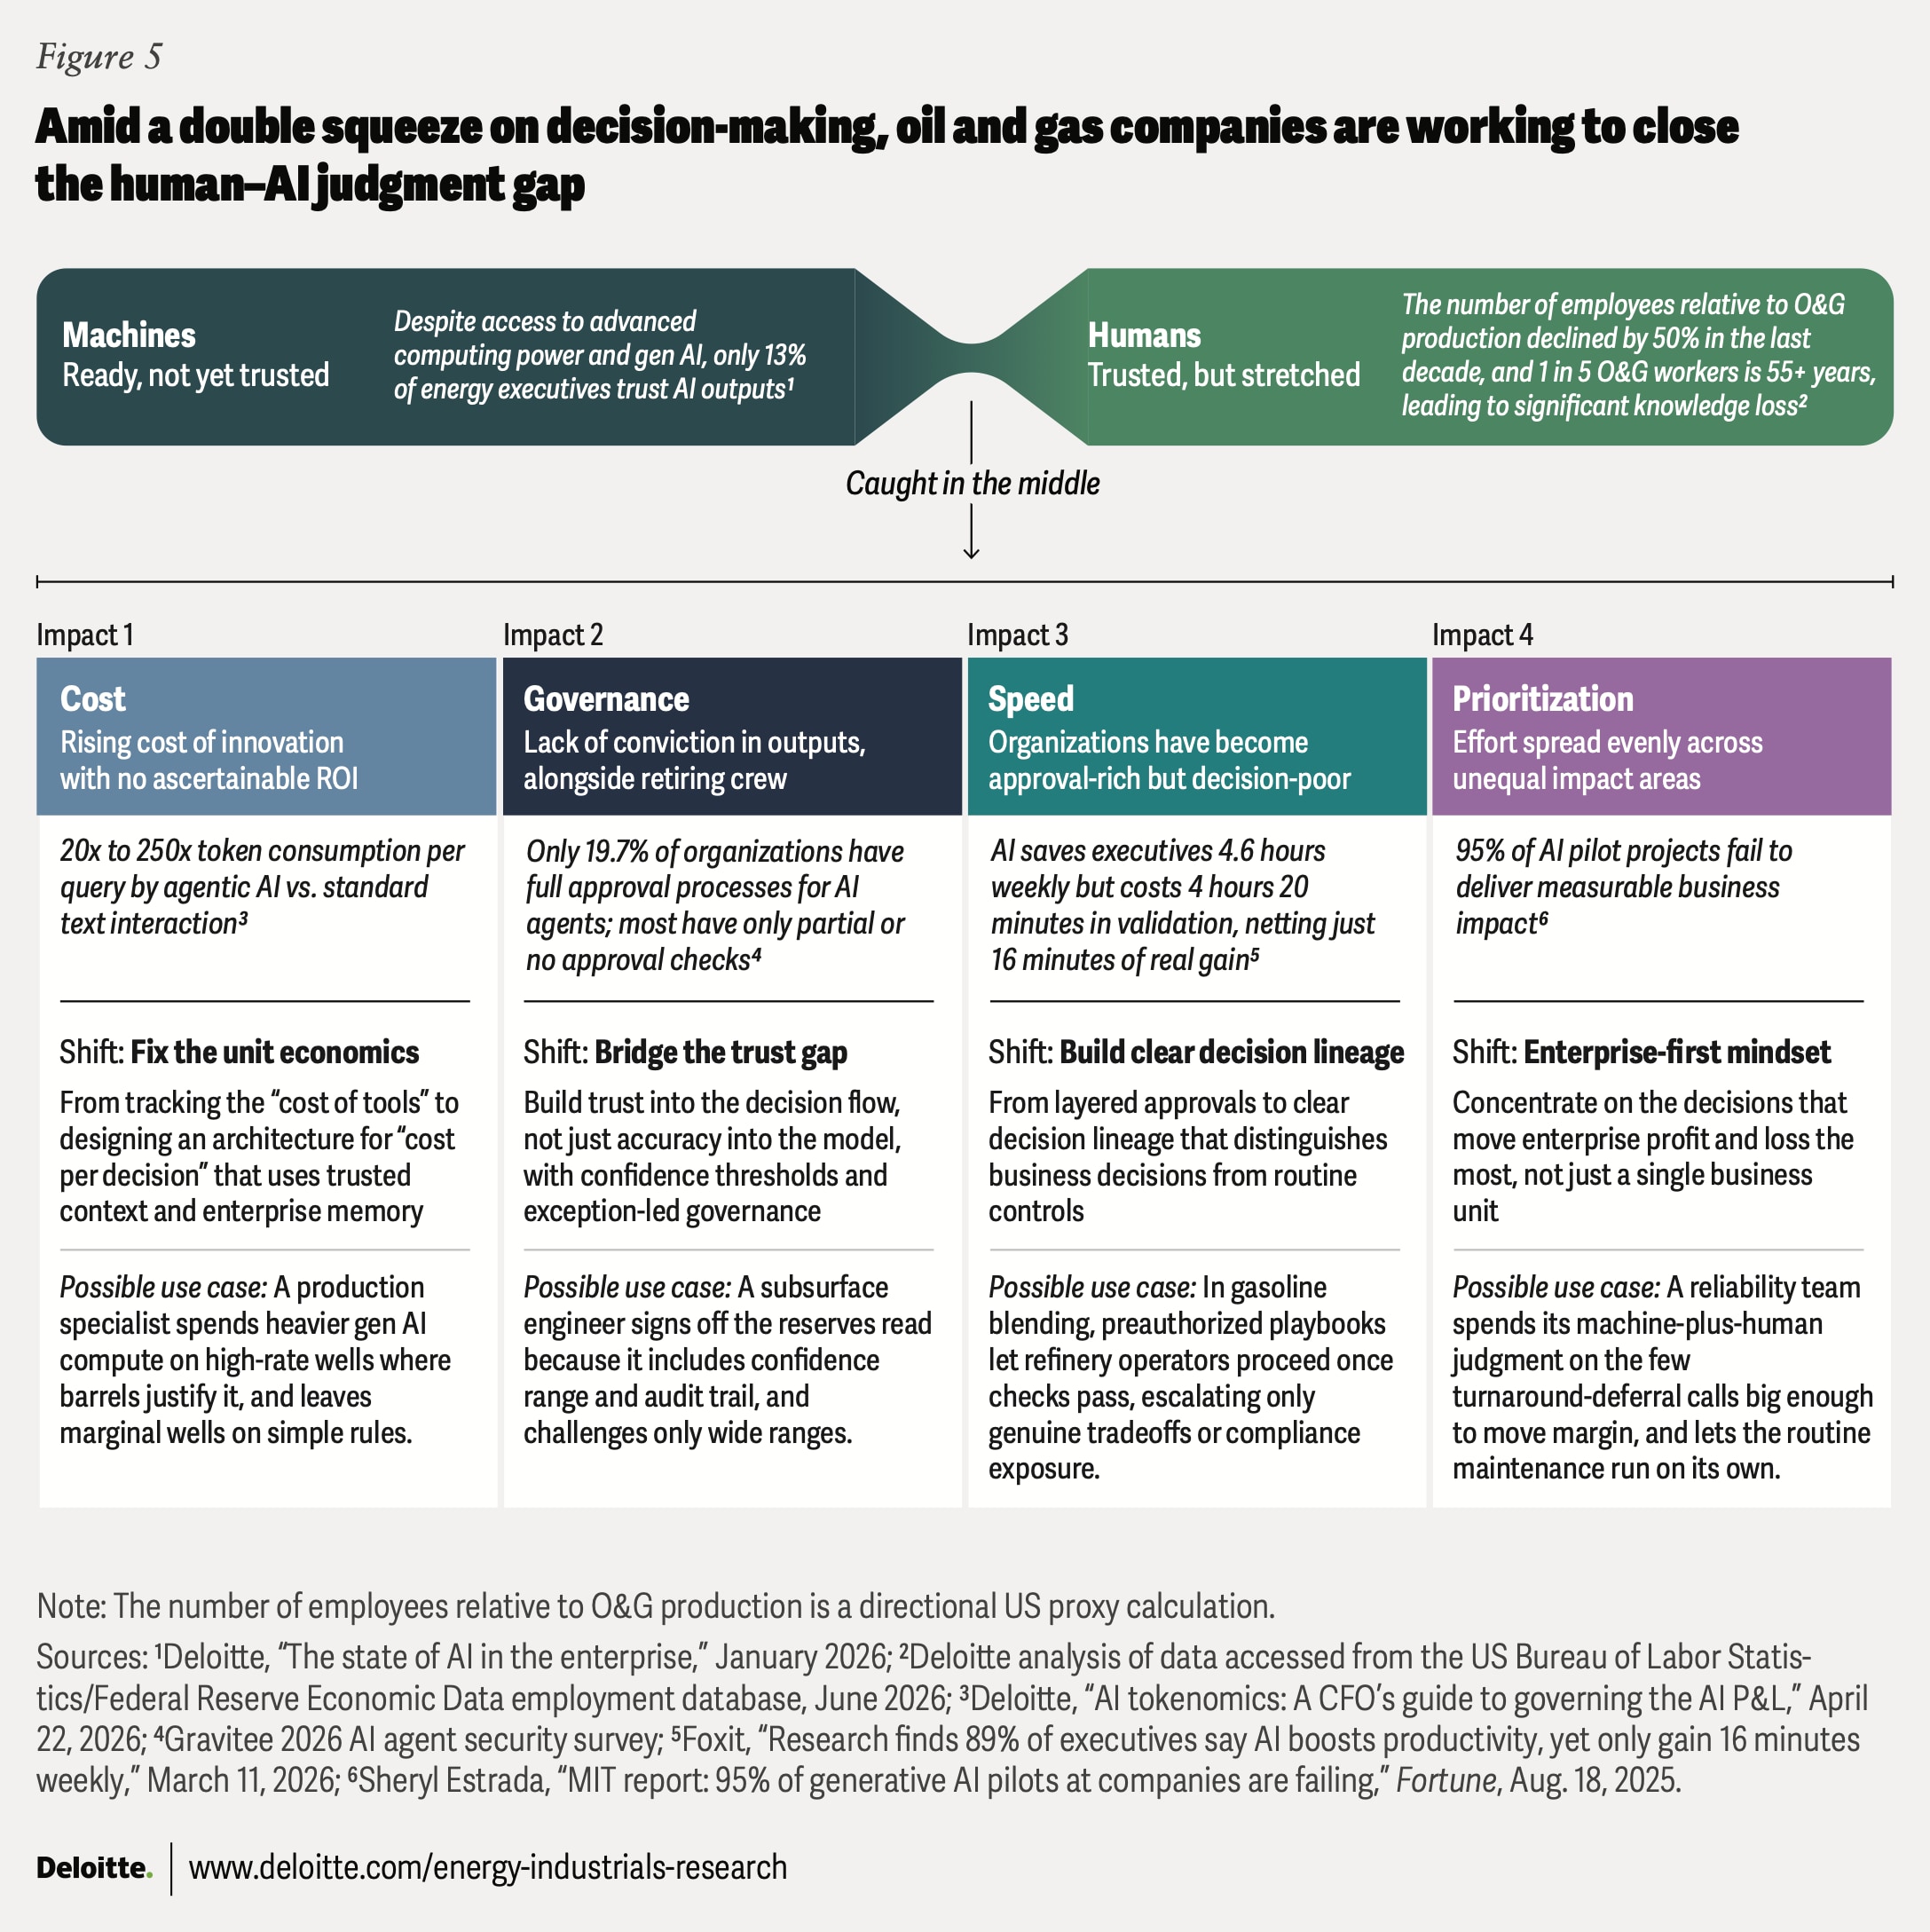
1. Reduce the cost-per-decision cycle. As gen AI shifts from low-volume pilots to always-on, agentic workflows across systems, token consumption and inference costs could rise faster than token prices fall.26 Rising analytics spend can appear to be pure cost inflation without visible value, fueling confusion about return on investment. A cost-per-decision framework captures the full cost and value of an AI-enabled decision, including compute cost and the human expertise required to train models and act on their outputs. Training, guided interfaces, reusable prompt templates, and repurposing preexisting, validated outputs across the organization can improve ROI by helping users generate consistent, actionable outputs without refining prompts from scratch.
2. Act with confidence and bridge the trust gap. Gen AI outputs are not yet fully trusted because historical models cannot self-certify results in a changing environment, potentially adding reviews and slowing decisions. Building trust, rather than simply aiming for accuracy, should include treating AI models like any other workforce component: setting confidence thresholds, assigning clear accountability by linking reviews to decision quality, and monitoring for drift. As experienced workers retire, involving them in validating and training models can preserve institutional knowledge and build leadership confidence in outputs validated by internal experts.
3. Act with speed, but don’t mistake approvals for decisions. Research suggests executives gain only 16 minutes weekly from AI after accounting for validation time.27 Faster approvals could seem like progress while quietly pulling management away from the decisions that matter. Clear decision lineage—who decides, validates, and delegates—helps establish accountability and separates leadership judgment from business controls. The greatest gains may come from assigning AI high-volume, low-complexity decisions, such as approving purchases within limits from approved vendors. This frees executives to focus on complex decisions requiring judgment, using AI as an analytical, not decision-making, tool.
4. Prioritize enterprise value, not local optimization. As gen AI generates more recommendations across assets, functions, and business units, local optimization can come at the expense of enterprisewide profit and loss impact. The priority should be to concentrate on cross-enterprise trade-offs where value intersects with risks and constraints. Resolving conflicts between local and enterprise objectives requires significant organizational authority, so top management should own and govern these decisions.
Market events are outpacing incumbent decision-making, while the accelerating wave of retirements threatens to outpace the transfer of institutional knowledge. Organizations, therefore, risk losing the judgment needed to make gen AI outputs trustworthy just as AI investment increases. Preserving this “human premium” requires exposing successors to high-stakes decisions, capturing institutional knowledge, establishing clear accountability, and integrating human judgement and AI into redesigned workflows. Making validated knowledge available at the point of decision can help turn individual expertise into a scalable enterprise capability. That shift is where internal transformation can begin.
Considerations for getting started: The internal transformation
As the external environment remains uncertain, companies’ most controllable advantage is likely the speed and quality of their decisions. Realizing that advantage often requires operating discipline and an organizational culture in which gen AI and human judgment reinforce one another. Without that alignment, flexibility and agility remain concepts on paper rather than capabilities the market demands. Consider two initiatives that could help companies close that gap.
- Extend operating and capital discipline to gen AI governance. Apply procedural rigor to generating and acting on intelligence—the same rigor traditionally used for determining capital allocation and dividend payouts. Govern AI models through inspection and certification cycles; set clear escalation authority for AI-driven decisions, as with hazardous fieldwork; and size organizational redundancy as part of the resilience portfolio.
- Modernize culture to close the speed-trust gap. Move decision rights closer to the signal, with clear validation and escalation protocols that can help teams act quickly without sacrificing confidence. Targeted training and executive adoption support can build confidence and close the perception gap among users who do not see the tools as relevant to their work. According to a Deloitte TrustID Workforce Index, 28% of energy and manufacturing workers say AI doesn’t fit their work, while high-trust workers are 4.6x more likely to use gen AI daily.28
Continue the conversation
Meet the industry leaders
Zillah Austin
Earl Stone
Kevin Gregory
Kate Hardin
By
Zillah Austin
Earl Stone
Kevin Gregory
Kate Hardin
Anshu Mittal
The authors would like to thank Abhinav Purohit and Vamshi Guguloth for their extensive contributions to this report, including their extensive research, in-depth analysis, and narrative development.
The authors would also like to thank Mike Orton, Ivan Kozaks, Sam Stuckey, Samrat Das, Krishna Raghavan, James Toups, Kristen Hooks, David Mallon, Jason Geller, Mackenzie Wilson, and Ade Olayinka for their subject matter input and review.
Finally, the authors would like to acknowledge the support of Clayton Wilkerson for orchestrating resources related to the report; Katrina Drake Hudson and Dario Failla for driving the marketing strategy and related assets to bring the story to life; Kaitlin Pellerin leading public relations; Rithu Thomas, Aparna Prusty and Pubali Dey from the Deloitte Insights team for editing the report and supporting its publication; and Harry Wedel for developing the visual design.
Editorial (including production and copyediting): Rithu Mariam Thomas, Aparna Prusty, and Pubali Dey
Design: Harry Wedel and Sana Saifi
Cover image by: Sanaa Saifi and Jim Slatton
Knowledge services: Rishitha Bichapogu
Visit the Deloitte Center for Energy & Industrials
Access more insights for the aerospace and defense, chemicals and specialty materials, engineering and construction, industrial manufacturing, mining and metals, oil and gas, power and utilities, and renewable energy sectors.