If we have selected the wrong experience for you, please change it above.
Travel Emissions Calculator Forecast and reduce travel emissions from a project, event, or single trip
For many organisations, including Deloitte, business travel represents one of the largest carbon footprint contributions. Understanding the climate impacts of travel choices and the levers available to reduce them is vital for achieving net zero ambitions.This Travel Emissions Calculator supports you to forecast the approximate travel-related emissions associated with your project or event, explore ways to reduce emissions, and provide data to support conversations with key stakeholders about your plans.
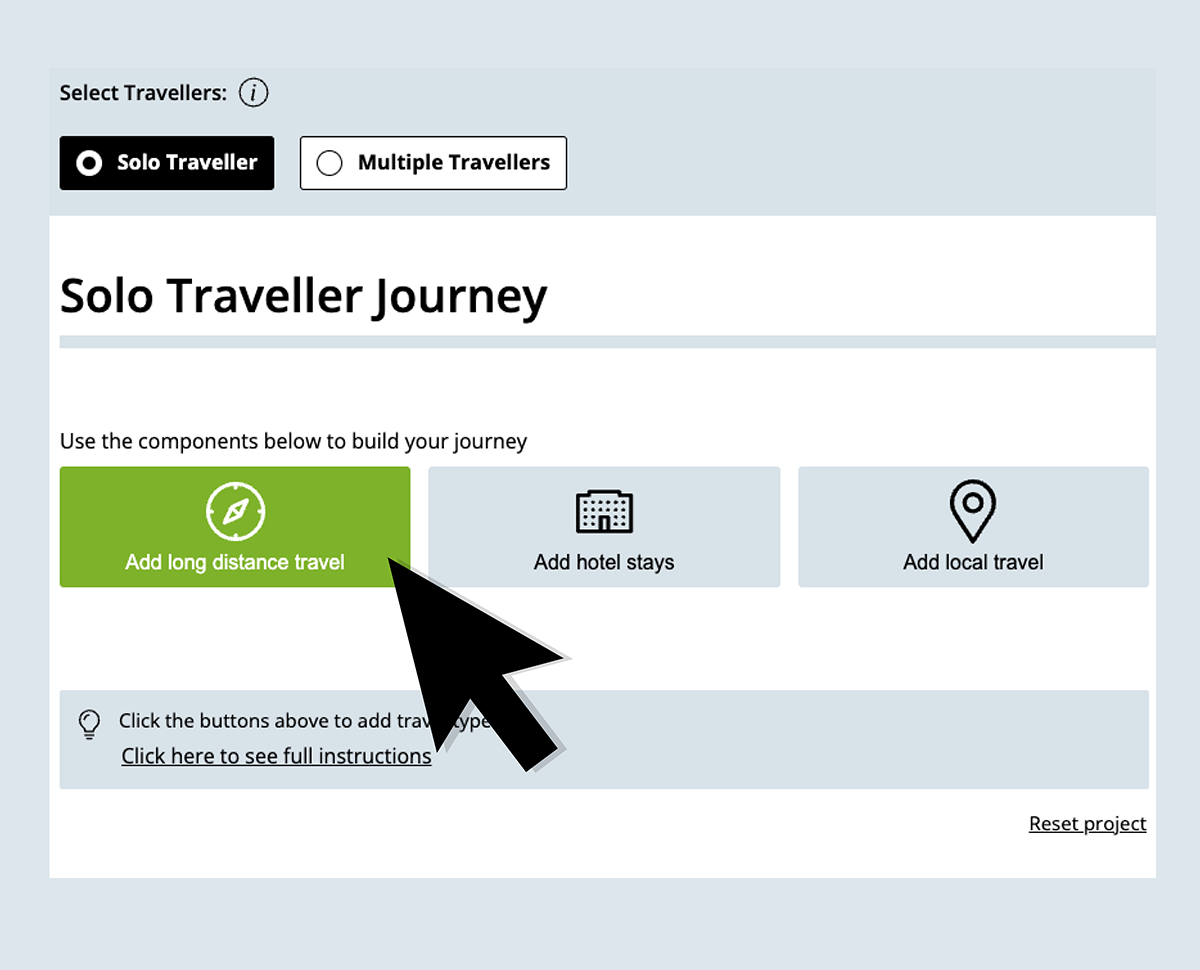
Solo Traveller Journey
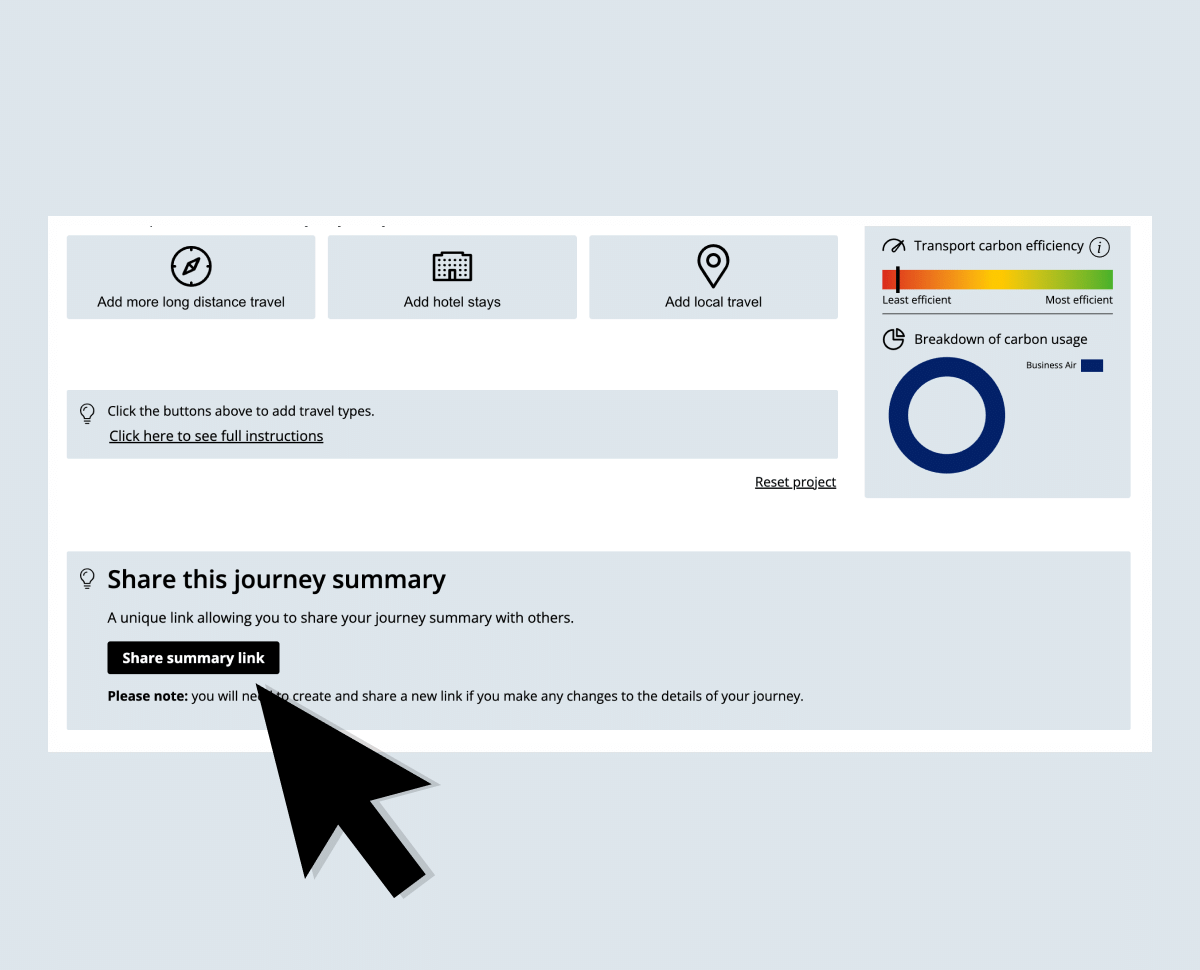
Click the buttons above to add travel types.Click here to see full instructions
Reset project
Emissions calculator instructions
Start by choosing an option from the components "long distance travel", "hotel stays" and "local travel" depending on the order in which you would like to input the travel plans.
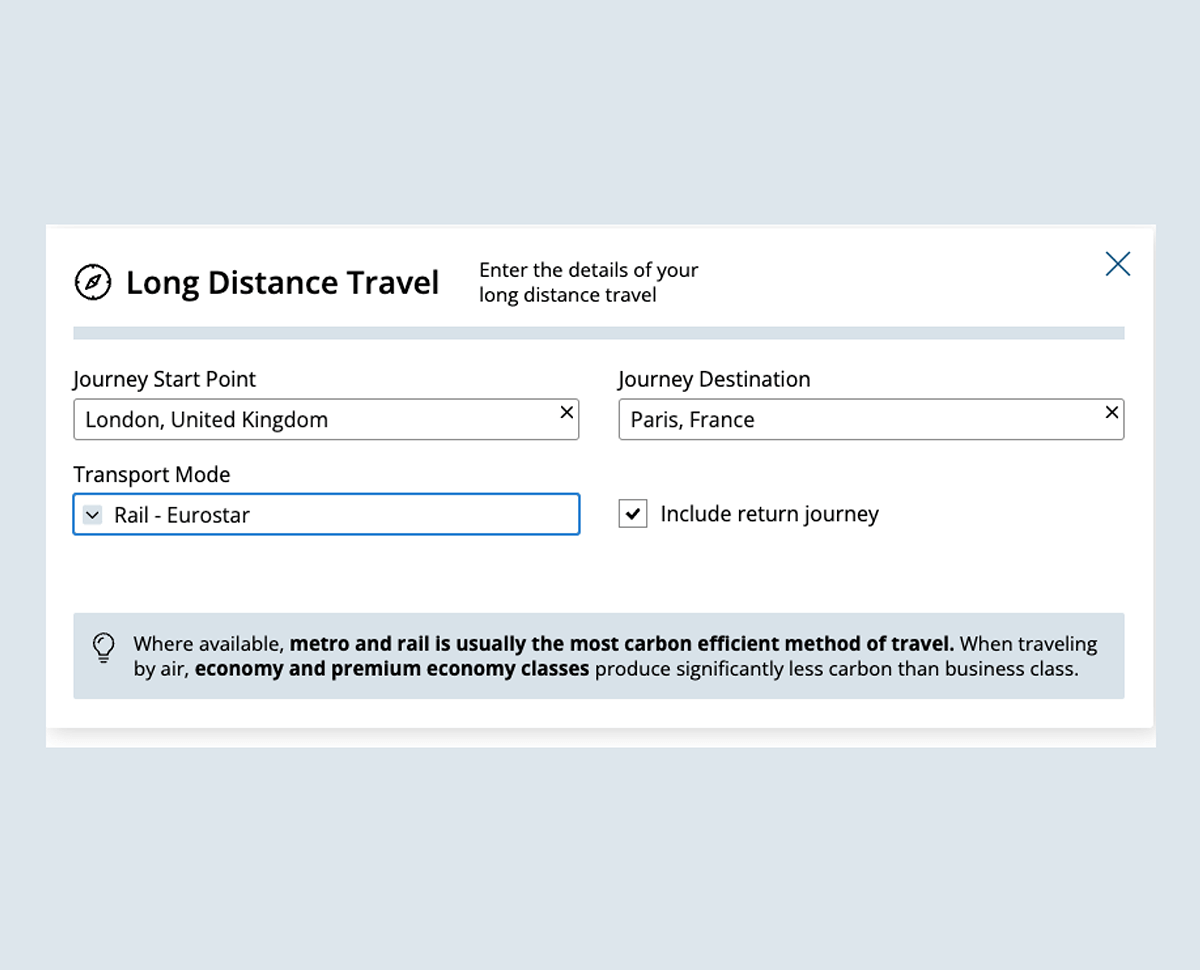
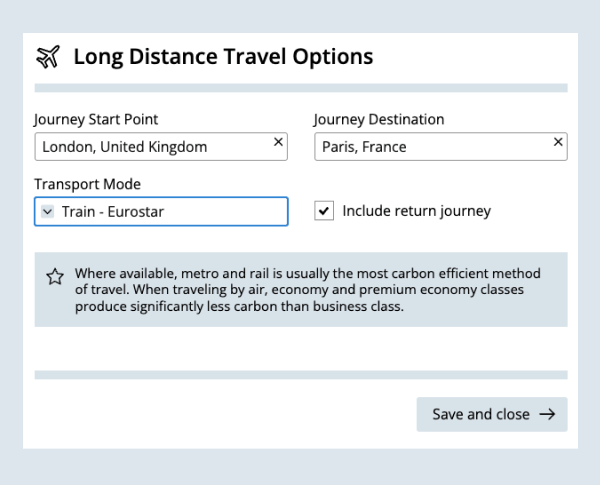
For long distance travel, begin to type the start point and destination into the boxes. Choose the transport type and whether this is a return journey.
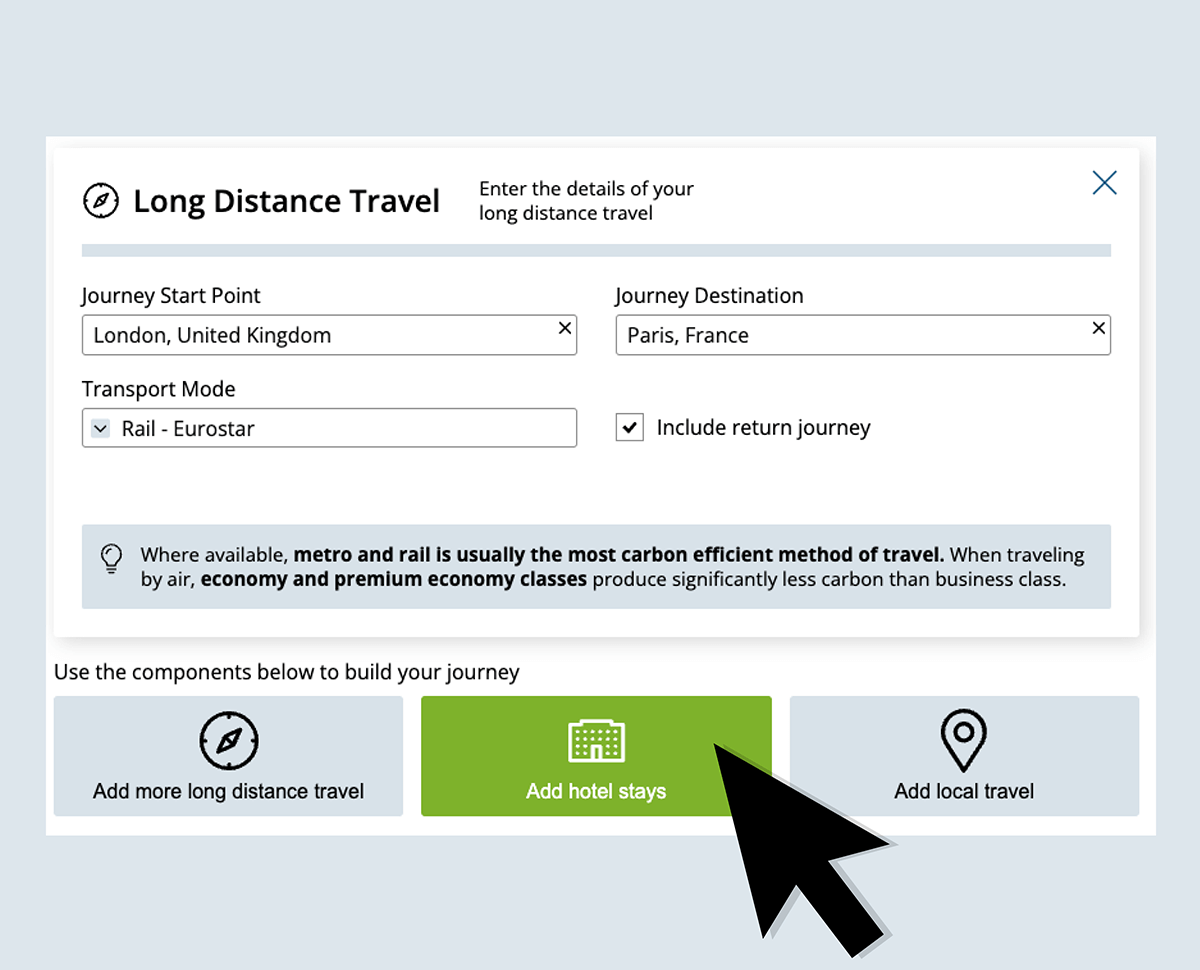
Once the information is entered, choose the next option, if required, from the components below the box depending on the order in which you would like to input the travel plans.
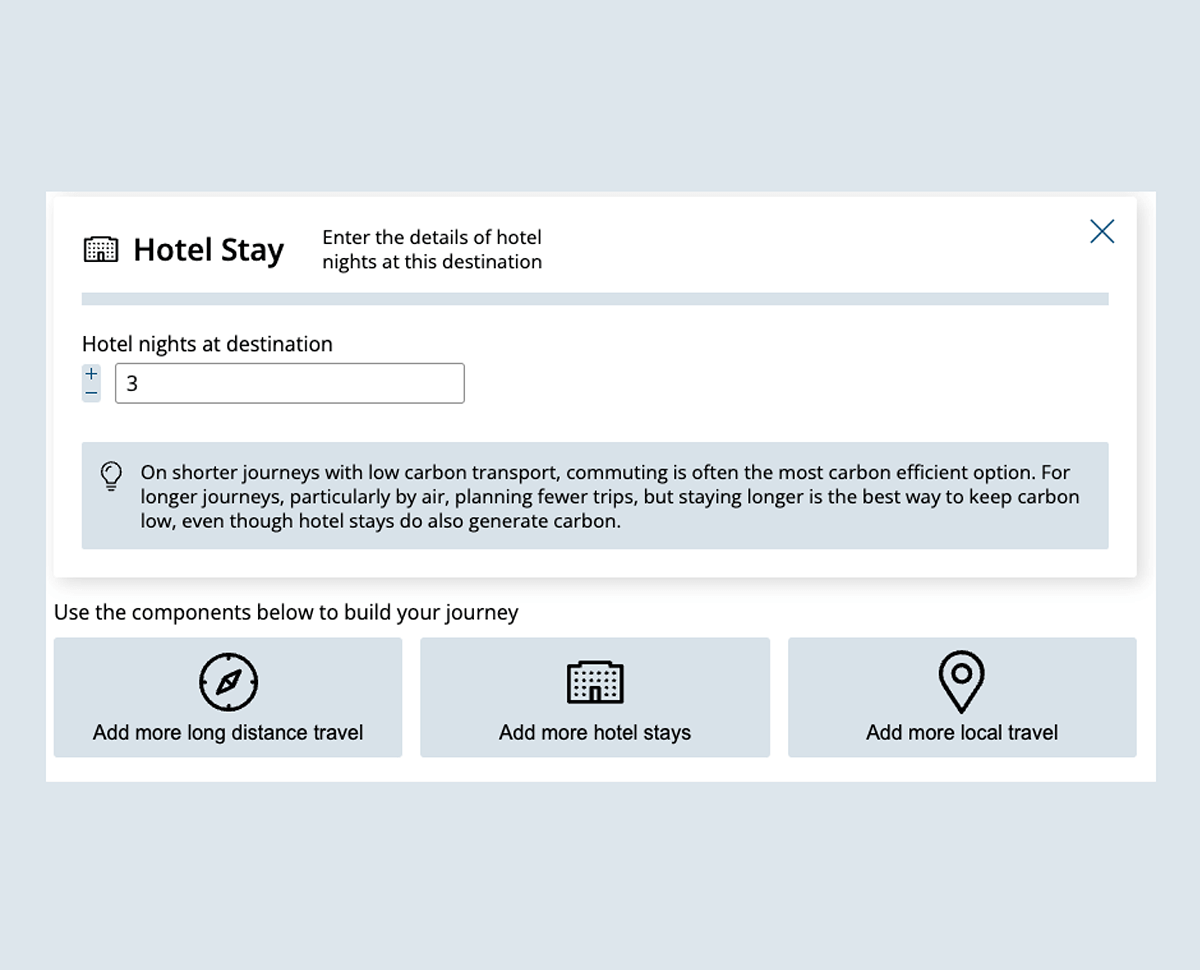
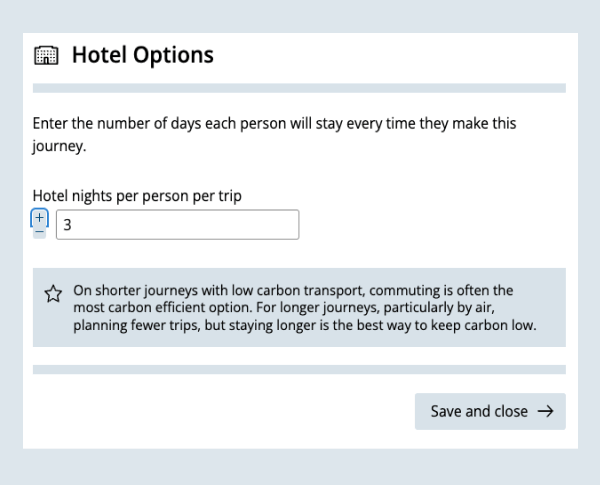
For hotel stays, choose the number of nights the traveller will be staying. Once the information has been entered choose the next option, if required, from the components below the box.
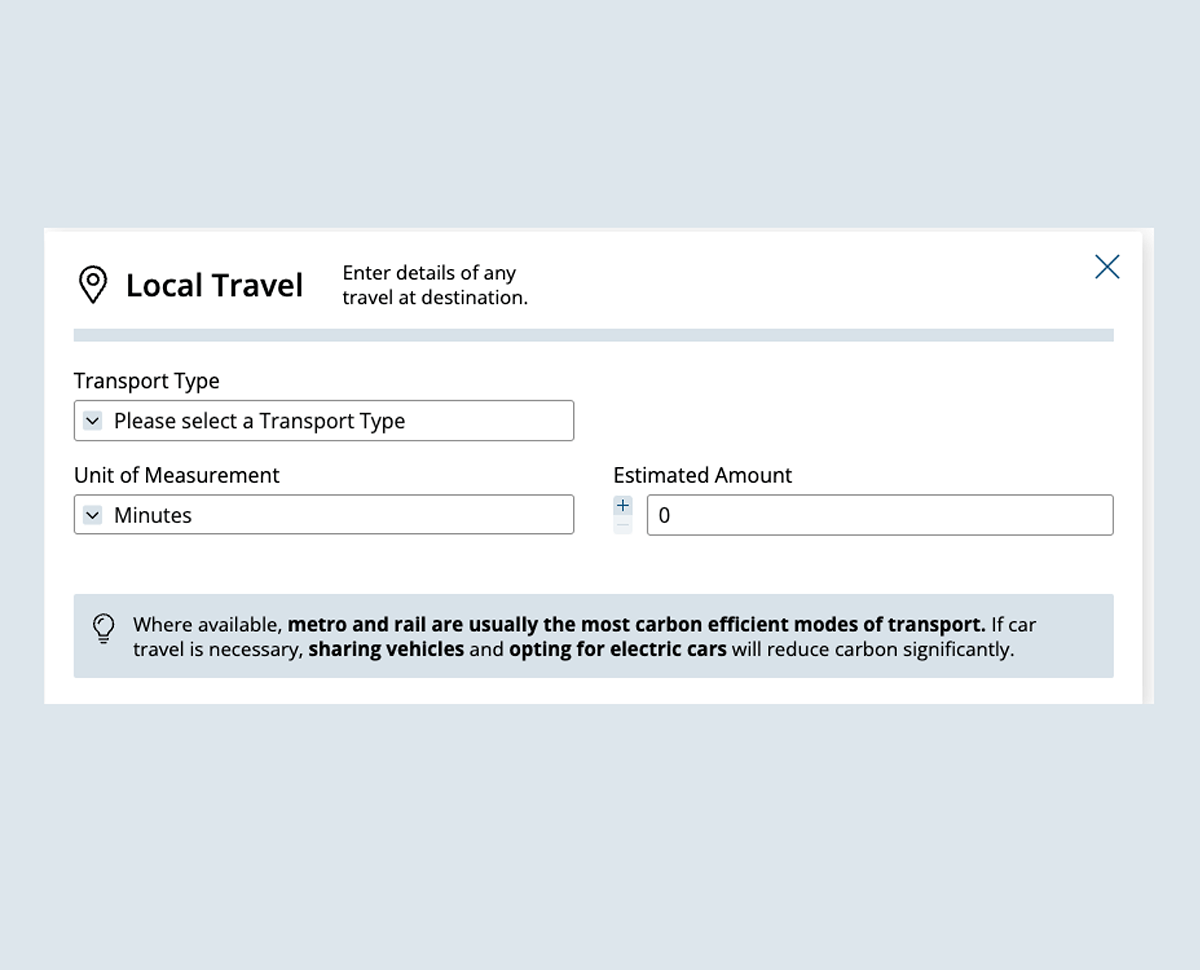
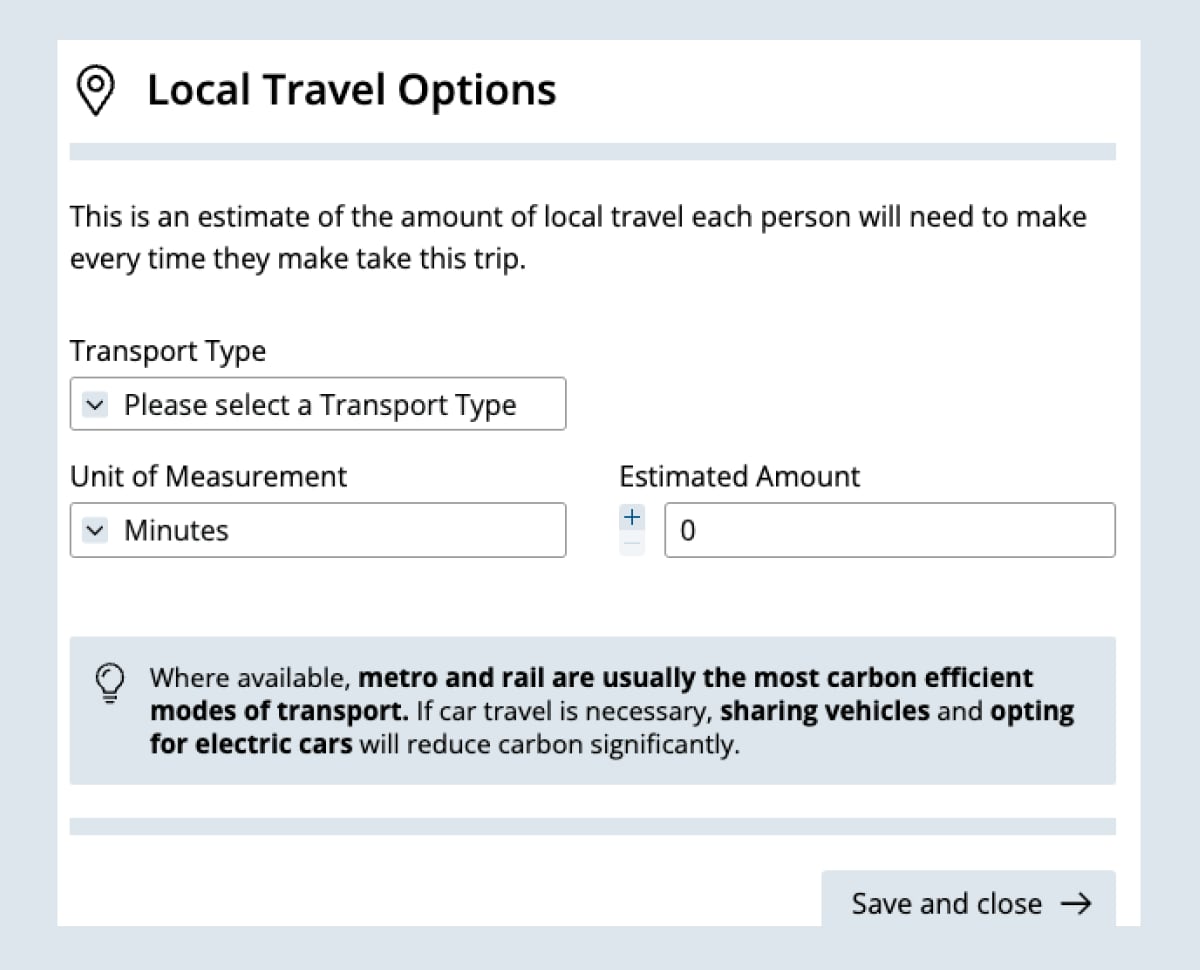
For local travel, estimate total amount of travel over the duration of the trip. Select the local travel option multiple times to cover all instances if using multiple types of transport.
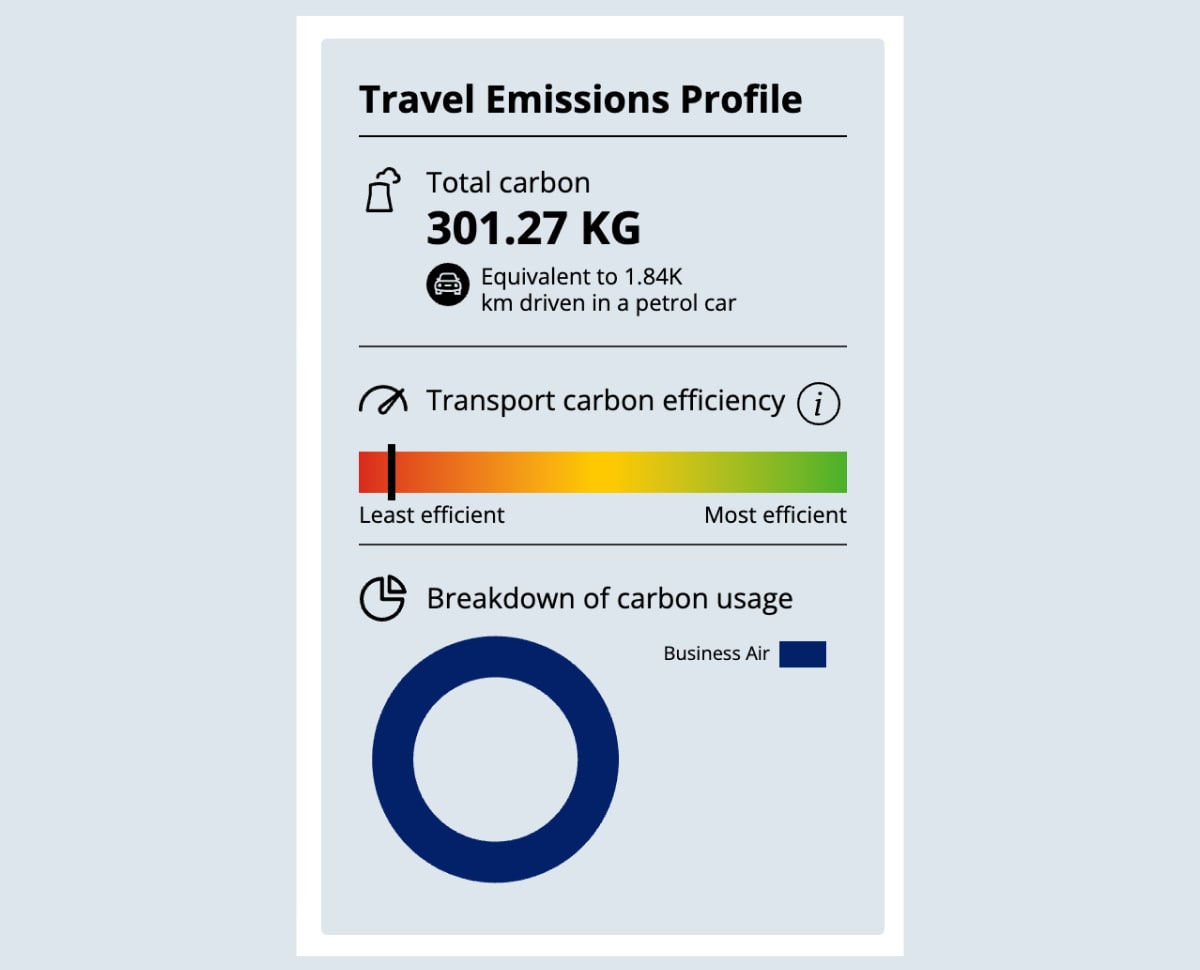
The carbon efficiency results are displayed in real time within the Travel Emissions Profile. The carbon efficiency scale shows where the transport options chosen sit compared to the most efficient version of this journey.
Upon completion, if required, click the "share summary link" button to create a unique link allowing the project to be shared. Please note: if you make any further changes, you will need to create and share a new link.
Check any queries against the Frequently Asked Questions section below.
Share this journey summaryA unique link allowing you to share your journey summary with others.Please note: you will need to create and share a new link if you make any changes to the details of your journey.
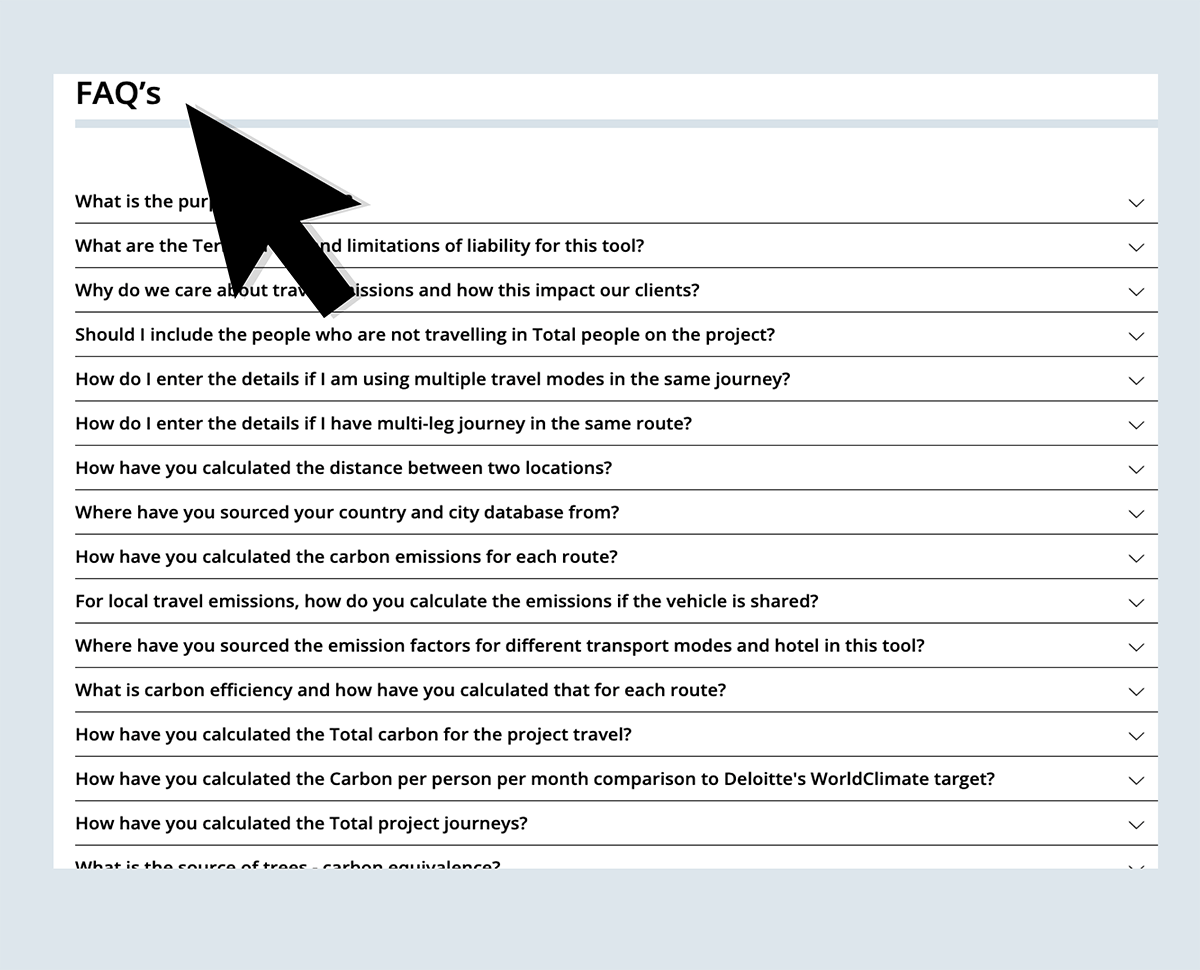
FAQ’s
For many organisations including Deloitte, business travel represents one of the largest contributors to our carbon footprint. Understanding the climate impacts of our travel choices and the levers available to us to reduce them is vital if we are to achieve our net zero ambitions. This tool supports you to forecast the approximate travel-related emissions associated with your project, explore ways to reduce them, and have conversations with key stakeholders about your plans. NB: This tool has been built to encourage more informed and sustainable travel behaviours. It is not intended to serve as the basis of carbon disclosure or reporting.This website (including without limitation any content or other part thereof) contains general information only, and we are not, by means of this website, rendering professional advice or services and do not accept any liability for use or reliance on the contents of this website. Before making any decision or taking any action, you should consult a qualified professional advisor for your own purposes.Deloitte has a global commitment to become net zero. For many organisations including Deloitte, business travel represents one of the largest contributors to our carbon footprint. That is why Deloitte set a short-term, science-based emissions reduction target which includes reducing travel emissions by 50% per FTE from an FY19 baseline by 2030. In addition to meeting our own public targets, our business travel represents a scope 3 ('value chain') emissions - as well as cost - burden for our clients, and there is increasing interest from clients and wider stakeholders in what we are doing to decarbonise our operations. Using this tool and the wider Sustainable Delivery Framework (SDF) when planning and delivering engagements helps to demonstrate how we are placing sustainability at the forefront of our work.Yes. Add the total people on the project, including those that are not travelling, for a more accurate per person emissions. Each 'route' is a journey that one or more people will take during the project; either as a one-off or periodically during the engagement.Add a new route for each travel mode or different travel frequency to build a comprehensive picture of your project's expected travel-related emissions. As an example, if I have a team of 20 people travelling using two different transport modes from London to Manchester; 15 are going by national rail and 5 by electric vehicle. Of those travelling by national rail, 10 are going once every month, and the other 5 once every week. I would therefore add a total of 3 routes: 10 people x once every month x London to Manchester; National Rail 5 people x once every week x London to Manchester; National Rail5 people x once every month x London to Manchester; Car EVClick on the “+” sign to the right of 'click to add travel at destination' and select “add new journey” to add additional journeys within the same route. For example, if I have a number of people travelling from Belfast to Brighton with the same frequency; I could add the following journeys in the same route: Belfast to London; Flight - EconomyLondon to Brighton; National Rail Air, rail and driving distances are approximate calculations. The distance is calculated 'as the crow flies', using the co-ordinates of the start and destination city and the haversine formula.For each route, we first calculate the carbon emissions of each attribute listed below and then sum it up: Journey emissions: multiplying distance travelled by transport mode-specific emissions factors.Hotel emissions: multiplying the number of hotel night stays with a hotel emissions factor.Local travel emissions: multiplying distance with the transport mode-specific emissions factors. We've assumed 20 miles per hour to convert time to distance.We then multiply the above emissions by the number of people who will be using the route and their frequency of the travel to reach total emissions for the route.If users select “Vehicles will be shared” for local travel, then we assume a single car will occupy 2 people in our emissions calculation.Air, Rail, Bus, Car and Ferry emission factors have been sourced from
Greenhouse gas reporting: conversion factors 2023 - GOV.UK (www.gov.uk). The table below shows the details of the emission factors used in
the tool. Hotel emissions are calculated in line with DTTL (Deloitte Global) reporting practice, assuming 38.78 kg CO2e emissions per hotel night as per the Cornell University Benchmarking Tool.*passenger.km - passenger per km*vehicle.km - vehicle per km
Journey Emissions Factors
Transport mode/class
Total CO2e per unit
Unit
Rail - Eurostar
0.004459
kg/pkm
Rail
0.035463
kg/pkm
Electric Car
0.054796
kg/pkm
Hybrid Car
0.118979
kg/pkm
Petrol Car
0.163909
kg/pkm
Diesel Car
0.169826
kg/pkm
Air - (if distance is less than 500 kms)
0.16099
passenger.km
Air - Economy (if distance is less than 3700 kms)
0.10794
passenger.km
Air - Business (if distance is less than 3700 kms)
0.16191
passenger.km
Air - Economy (if distance is greater than 3700 kms)
0.11812
passenger.km
Air - Premium Economy (if distance is greater than 3700 kms)
0.18898
passenger.km
Air - Business (if distance is greater than 3700 kms)
0.34253
passenger.km
Air - First Class (if distance is greater than 3700 kms)
0.47246
passenger.km
Local Rail (inc. Metro, Subway, Tram)
0.0282025
kg/pkm
Bus
0.10215
kg/vkm
Taxi
0.148615
kg/vkm
Ferry
0.1127
kg/pkm
Hotel
38.78
kg/night
Local Travel Emissions Factors
Transport mode/class
Total CO2e per unit
Unit
Rail: Metro / Subway
0.02781
passenger.km
Rail: Local Rail / Tram
0.02861
passenger.km
Road: Taxi/Hire Car Electric
0.0514
vehicle.km
Road: Taxi/Hire Car Hybrid
0.10676
vehicle.km
Road: Taxi/Hire Car Petrol
0.17048
vehicle.km
Road: Taxi/Hire Car Diesel
0.17082
vehicle.km
Road: Bus
0.0965
passenger.km
Road: Taxi
0.20826
vehicle.km
Water: Ferry
0.112862
passenger.km
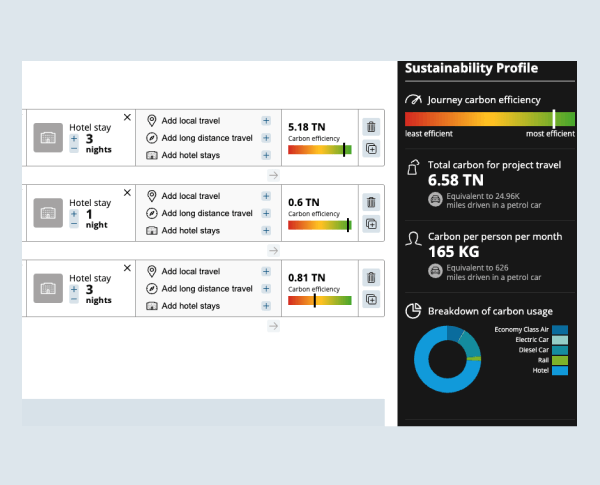
Carbon efficiency provides an indication of the carbon intensity of transport mode choices associated with each route. The scale compares the carbon emissions associated with the transport mode(s) chosen for i) the main journey(s) and ii) travel at destination to the lowest and highest carbon-emitting options.There are 3 carbon values generated based on the emission factors of available transport modes and classes for that journey:Carbon - most efficient: This is the lowest carbon emitting factor i.e. Eurostar (where applicable) OR rail.Carbon - least efficient: This is the highest carbon emitting factor i.e. 'Air – First Class'.Carbon choices defined by the user: This will change based on the transport mode and class selected by the user and will shift towards most efficient or least efficient on the carbon efficiency dial for the route.This is the sum of the carbon emissions calculated for all routes.Deloitte has made a public commitment to reduce business travel emissions by 55% per person by 2030 on FY19 levels as we work towards net zero emissions. To be consistent with this commitment, the monthly per person emissions of your project should be 0.08 Tonnes or less; half of the average Deloitte NSE employee's monthly footprint in FY19.NB: the comparison of performance against target in this tool is indicative, and assumes that the travel people will be doing for this project is their only business travel for the duration of the project. In practise emissions differ by geography and by service line.The total project journey is the sum of total routes. This is calculated by dividing the carbon value by the emissions per km value for an average petrol car.Please refer to the Travel Emissions Checklist which provides hints and tips to reduce your travel emissions.There are two ways to share the output of your project travel emissions with your client or other project members:Download your project summary: you can download the project summary which will provide you with an image that can be included in relevant documents and slide decks (Multiple traveller mode only).Copy link: the copy link button will create a unique link that you can send to a client or other key stakeholders. Anyone with that link can view the project travel choices and overall emissions profile exactly as you inputted in the tool.
Project or Event Profile
Breakdown of travel
Click here to see full instructions
If you wish to use multi traveller mode please use a wider screen.
Emissions calculator instructions
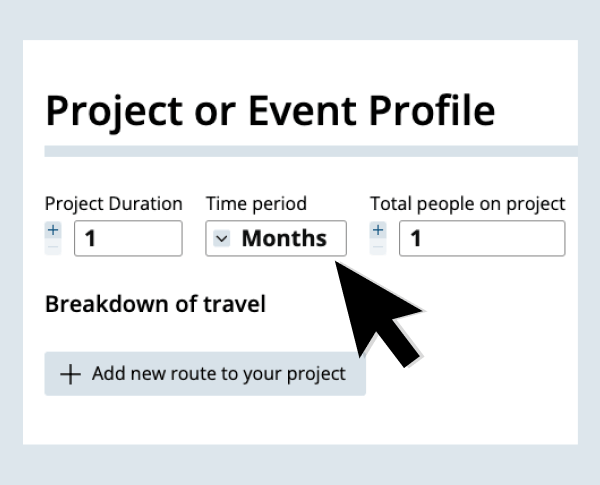
Start by filling in the Project duration box and then choosing either days, weeks, months or years in the Time period drop down menu.Next add the number of full time equivalent people on the project- including those who are not travelling.
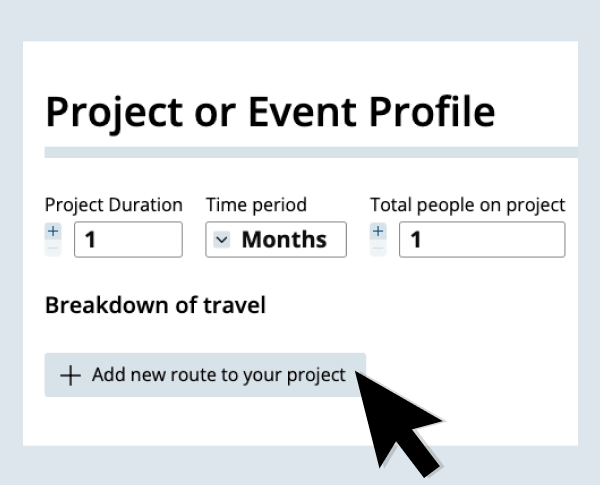
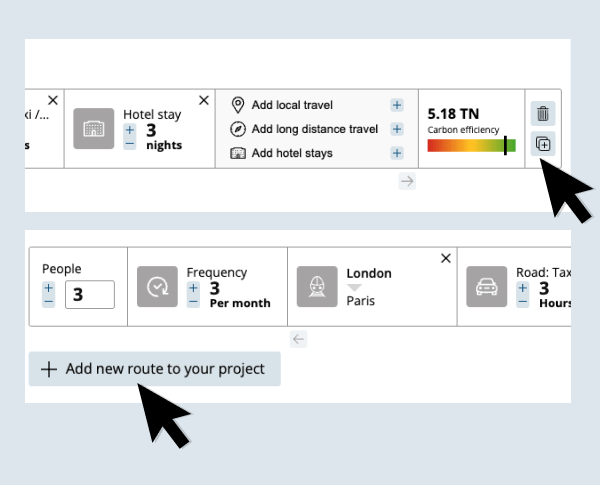
To start entering your route details, click the +Add new route button.
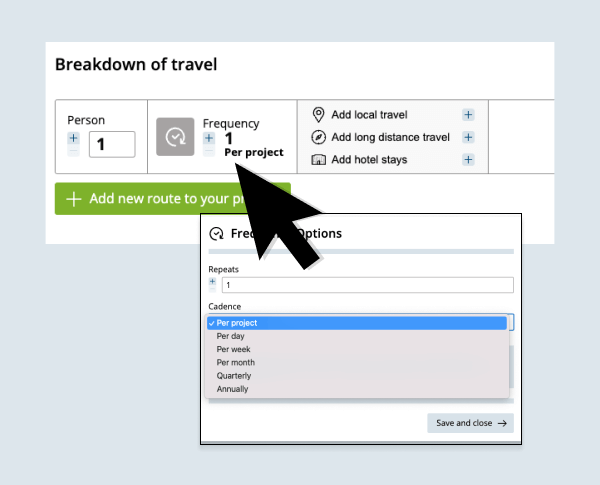
In the breakdown of travel section select the number of people making the journey and select the Frequency option. In the pop up box add the number of times this journey will repeat selecting the cadence in days, weeks, months, years or per project.
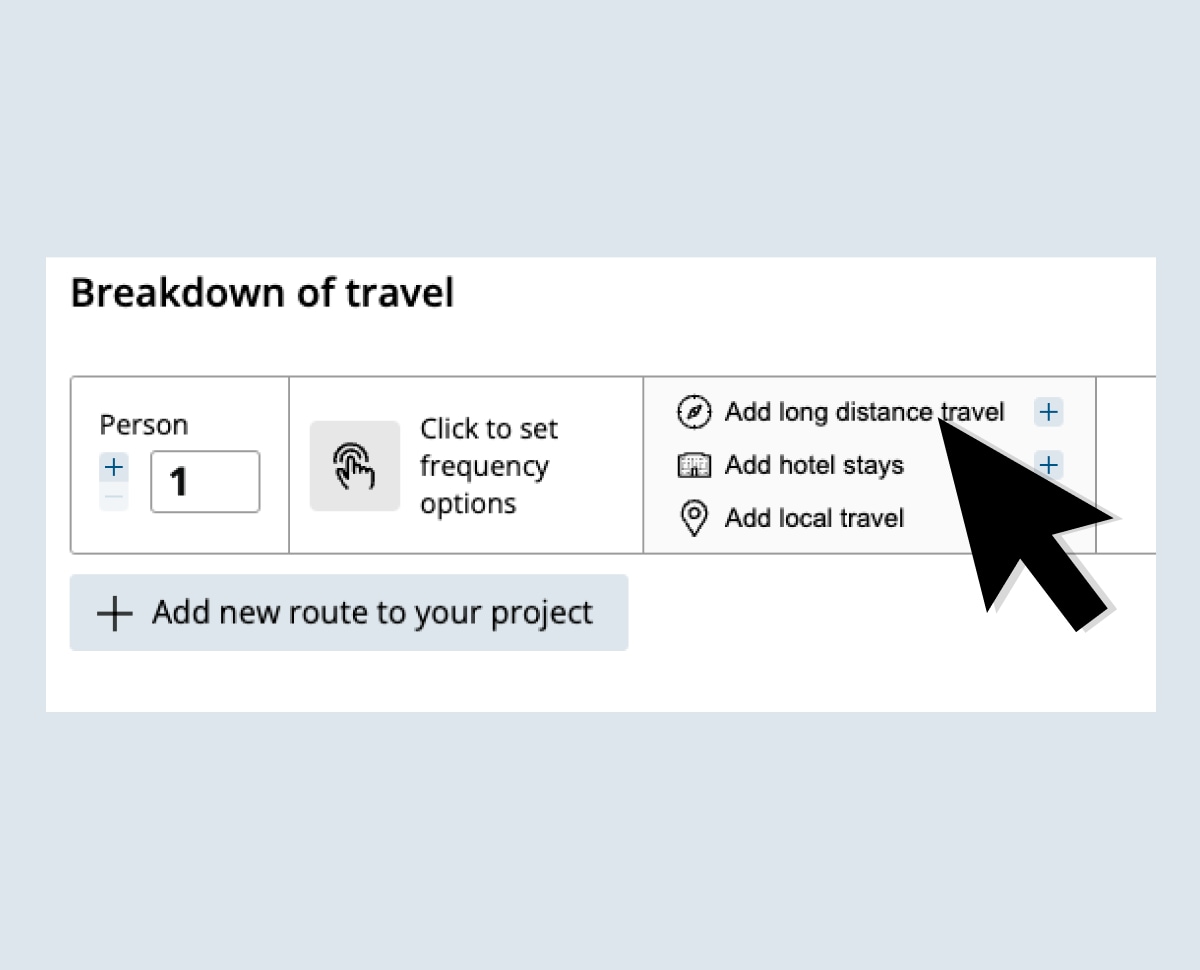
Choose option from "local travel" "long distance travel" and "hotel stays" depending on the order in which you would like to input the travel plans.
For long distance travel, begin to type the start point and destination into the boxes. Choose the transport type and whether this is a return journey.
For local travel, estimate total amount of travel for each person over the duration of the trip.Select the local travel option multiple times to cover all instances if using multiple types of transport.
For hotel stays, choose the number of nights each person will be staying.
To add a new journey, either duplicate the current journey by clicking the button at the right of your journey bar, or click the "add new route" button underneath.
The project or event’s carbon efficiency results are displayed in real time on the Sustainability Profile bar. The journey carbon efficiency scale shows where your travel plans sit compared to the most efficient version of this journey.
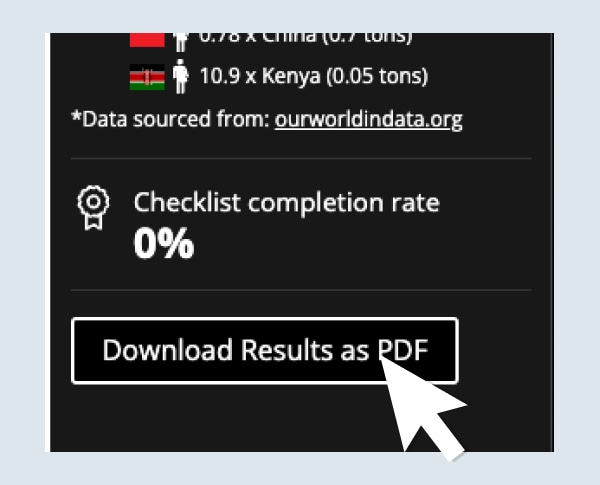
Check off each item on the Travel Emissions Checklist to ensure the most carbon efficient journey has been considered.The project details can be shared via a link by clicking on the Summary link button.
Download a pdf of the Carbon efficiency results using the "Download results as PDF" button on the Sustainability profile bar.
Check any queries against the Frequently Asked Questions section situated below the checklist.
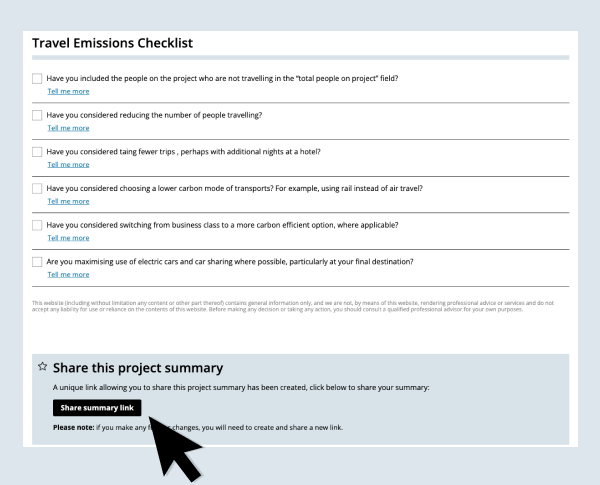
Travel Emissions Checklist
Have you included the people on the project who are not travelling in the “total people on project” field?
Add the total number of people working on the project, including those that are not travelling, for an accurate per person value.
Tell me more
Have you considered reducing the number of people travelling?
A recent study published in (the journal) Nature demonstrated how the participants of the 2020 American Center for Life Cycle Assessment lowered the carbon footprint of their annual conference by 94% and energy use by 90% by switching from in-person to virtual. Does such a large proportion of your team need to travel? And might people be able to travel less frequently, prioritising the moments that matter?
Tell me more
Have you considered taking fewer trips, perhaps with additional nights at a hotel or (serviced) apartment?
Avoiding unnecessary travel altogether has the greatest impact on project-related emissions.Reducing the frequency of travel and instead extending the length of time at destination when you do make the journey can have a significant impact on emissions - particularly on international projects involving air travel.Might you be able to avoid extra journeys by extending the length of the trip?
Tell me more
Have you considered choosing a lower carbon mode of transport? For example, using rail instead of air travel?
The mode of transport chosen has a significant impact on your project's emissions. For example, compared with driving a petrol car from London to Glasgow in the UK, taking the train emits approximately 3.3 times less carbon per passenger, whilst flying causes 75% more carbon (GOV.UK). Would a train or electric vehicle be a feasible alternative where you have chosen to fly?
Tell me more
Have you considered switching from business class to a more carbon efficient option, where applicable?
Did you know that the class of travel you choose has a material impact too, not just the mode of transport chosen? Air passengers seated in business class are responsible for between 2.6 and 4.3 times the emissions of someone flying in economy (ICCT). Could you fly economy if taking a flight is necessary?
Tell me more
Are you maximising use of electric cars and car sharing where possible, particularly at your final destination?
Significant reductions in carbon emissions can be achieved by sharing vehicles when travelling by road. Use electric vehicles where possible.
Tell me more
This website (including without limitation any content or other part thereof) contains general information only, and we are not, by means of this website, rendering professional advice or services and do not accept any liability for use or reliance on the contents of this website. Before making any decision or taking any action, you should consult a qualified professional advisor for your own purposes.
Share this project summaryA unique link allowing you to share your journey summary with others.Please note: you will need to create and share a new link if you make any changes to the details of your journey.
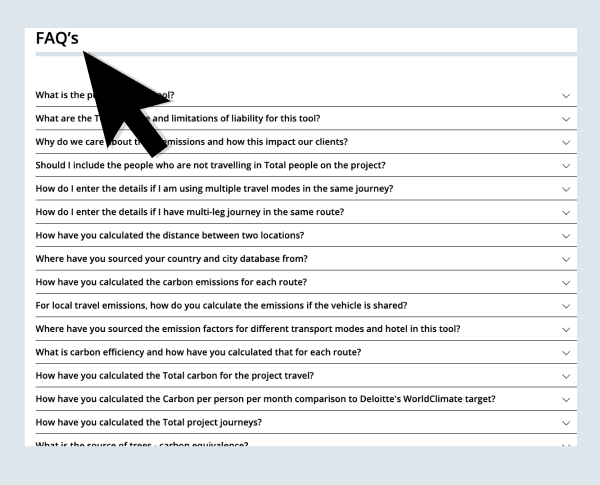
FAQ’s
For many organisations including Deloitte, business travel represents one of the largest contributors to our carbon footprint. Understanding the climate impacts of our travel choices and the levers available to us to reduce them is vital if we are to achieve our net zero ambitions. This tool supports you to forecast the approximate travel-related emissions associated with your project, explore ways to reduce them, and have conversations with key stakeholders about your plans. NB: This tool has been built to encourage more informed and sustainable travel behaviours. It is not intended to serve as the basis of carbon disclosure or reporting.This website (including without limitation any content or other part thereof) contains general information only, and we are not, by means of this website, rendering professional advice or services and do not accept any liability for use or reliance on the contents of this website. Before making any decision or taking any action, you should consult a qualified professional advisor for your own purposes.Deloitte has a global commitment to become net zero. For many organisations including Deloitte, business travel represents one of the largest contributors to our carbon footprint. That is why Deloitte set a short-term, science-based emissions reduction target which includes reducing travel emissions by 50% per FTE from an FY19 baseline by 2030. In addition to meeting our own public targets, our business travel represents a scope 3 ('value chain') emissions - as well as cost - burden for our clients, and there is increasing interest from clients and wider stakeholders in what we are doing to decarbonise our operations. Using this tool and the wider Sustainable Delivery Framework (SDF) when planning and delivering engagements helps to demonstrate how we are placing sustainability at the forefront of our work.Yes. Add the total people on the project, including those that are not travelling, for a more accurate per person emissions. Each 'route' is a journey that one or more people will take during the project; either as a one-off or periodically during the engagement.Add a new route for each travel mode or different travel frequency to build a comprehensive picture of your project's expected travel-related emissions. As an example, if I have a team of 20 people travelling using two different transport modes from London to Manchester; 15 are going by national rail and 5 by electric vehicle. Of those travelling by national rail, 10 are going once every month, and the other 5 once every week. I would therefore add a total of 3 routes: 10 people x once every month x London to Manchester; National Rail 5 people x once every week x London to Manchester; National Rail5 people x once every month x London to Manchester; Car EVClick on the “+” sign to the right of 'click to add travel at destination' and select “add new journey” to add additional journeys within the same route. For example, if I have a number of people travelling from Belfast to Brighton with the same frequency; I could add the following journeys in the same route: Belfast to London; Flight - EconomyLondon to Brighton; National Rail Air, rail and driving distances are approximate calculations. The distance is calculated 'as the crow flies', using the co-ordinates of the start and destination city and the haversine formula.For each route, we first calculate the carbon emissions of each attribute listed below and then sum it up: Journey emissions: multiplying distance travelled by transport mode-specific emissions factors.Hotel emissions: multiplying the number of hotel night stays with a hotel emissions factor.Local travel emissions: multiplying distance with the transport mode-specific emissions factors. We've assumed 20 miles per hour to convert time to distance.We then multiply the above emissions by the number of people who will be using the route and their frequency of the travel to reach total emissions for the route.If users select “Vehicles will be shared” for local travel, then we assume a single car will occupy 2 people in our emissions calculation.Air, Rail, Bus, Car and Ferry emission factors have been sourced from
Greenhouse gas reporting: conversion factors 2023 - GOV.UK (www.gov.uk). The table below shows the details of the emission factors used in
the tool. Hotel emissions are calculated in line with DTTL (Deloitte Global) reporting practice, assuming 38.78 kg CO2e emissions per hotel night as per the Cornell University Benchmarking Tool.*passenger.km - passenger per km*vehicle.km - vehicle per km
Journey Emissions Factors
Transport mode/class
Total CO2e per unit
Unit
Rail - Eurostar
0.004459
kg/pkm
Rail
0.035463
kg/pkm
Electric Car
0.054796
kg/pkm
Hybrid Car
0.118979
kg/pkm
Petrol Car
0.163909
kg/pkm
Diesel Car
0.169826
kg/pkm
Air - (if distance is less than 500 kms)
0.16099
passenger.km
Air - Economy (if distance is less than 3700 kms)
0.10794
passenger.km
Air - Business (if distance is less than 3700 kms)
0.16191
passenger.km
Air - Economy (if distance is greater than 3700 kms)
0.11812
passenger.km
Air - Premium Economy (if distance is greater than 3700 kms)
0.18898
passenger.km
Air - Business (if distance is greater than 3700 kms)
0.34253
passenger.km
Air - First Class (if distance is greater than 3700 kms)
0.47246
passenger.km
Local Rail (inc. Metro, Subway, Tram)
0.0282025
kg/pkm
Bus
0.10215
kg/vkm
Taxi
0.148615
kg/vkm
Ferry
0.1127
kg/pkm
Hotel
38.78
kg/night
Local Travel Emissions Factors
Transport mode/class
Total CO2e per unit
Unit
Rail: Metro / Subway
0.02781
passenger.km
Rail: Local Rail / Tram
0.02861
passenger.km
Road: Taxi/Hire Car Electric
0.0514
vehicle.km
Road: Taxi/Hire Car Hybrid
0.10676
vehicle.km
Road: Taxi/Hire Car Petrol
0.17048
vehicle.km
Road: Taxi/Hire Car Diesel
0.17082
vehicle.km
Road: Bus
0.0965
passenger.km
Road: Taxi
0.20826
vehicle.km
Water: Ferry
0.112862
passenger.km
Carbon efficiency provides an indication of the carbon intensity of transport mode choices associated with each route. The scale compares the carbon emissions associated with the transport mode(s) chosen for i) the main journey(s) and ii) travel at destination to the lowest and highest carbon-emitting options.There are 3 carbon values generated based on the emission factors of available transport modes and classes for that journey:Carbon - most efficient: This is the lowest carbon emitting factor i.e. Eurostar (where applicable) OR rail.Carbon - least efficient: This is the highest carbon emitting factor i.e. 'Air – First Class'.Carbon choices defined by the user: This will change based on the transport mode and class selected by the user and will shift towards most efficient or least efficient on the carbon efficiency dial for the route.This is the sum of the carbon emissions calculated for all routes.Deloitte has made a public commitment to reduce business travel emissions by 50% per person by 2030 on FY19 levels as we work towards net zero emissions. To be consistent with this commitment, the monthly per person emissions of your project should be 0.08 Tonnes or less; half of the average Deloitte NSE employee's monthly footprint in FY19.NB: the comparison of performance against target in this tool is indicative, and assumes that the travel people will be doing for this project is their only business travel for the duration of the project. In practise emissions differ by geography and by service line.The total project journey is the sum of total routes. This is calculated by dividing the carbon value by the emissions per km value for an average petrol car.Please refer to the Travel Emissions Checklist which provides hints and tips to reduce your travel emissions.There are two ways to share the output of your project travel emissions with your client or other project members:Download your project summary: you can download the project summary which will provide you with an image that can be included in relevant documents and slide decks (Multiple traveller mode only).Copy link: the copy link button will create a unique link that you can send to a client or other key stakeholders. Anyone with that link can view the project travel choices and overall emissions profile exactly as you inputted in the tool.
Journey carbon efficiencyCarbon efficiency provides an indication of the carbon intensity of transport mode choices associated with each route. The scale compares the carbon emissions associated with the transport mode(s) chosen for i) the main journey(s) and ii) travel at destination to the lowest and highest carbon-emitting options.There are 3 carbon values generated based on the emission factors of available transport modes and classes for that journey:Carbon - most efficient: This is the lowest carbon emitting factor i.e. Eurostar (where applicable) OR rail.Carbon - least efficient: This is the highest carbon emitting factor i.e. 'Air – First Class'.Carbon choices defined by the user: This will change based on the transport mode and class selected by the user and will shift towards most efficient or least efficient on the carbon efficiency dial for the route.
Select TravellersSolo traveller mode is for one traveller planning a journey. For example, travel for one person to an event or meeting.Multiple travellers is a more advanced mode that allows you to add as many travellers and trips as you need. You can build a travel emission profile for complex trips or for an entire project.