AI is driving economic growth and productivity gains without impacting jobs, yet
The June 2026 Economics Insider analyzes the AI-driven tech investment boom and the impact it has had so far on the US economy
Artificial intelligence is now a central theme in discussions on the US economy—especially its potential impact on investment, productivity, and employment. That’s because earlier waves of technological progress influenced significant structural changes in the economy: In the early 2000s, rapid progress in information technology led to strong productivity gains, which, in turn, supported faster economic growth and helped keep inflation in check. It also contributed to a structural shift in the labor market in favor of high-wage occupations like those in computer and mathematical sciences. So, what has the advent of AI changed so far?
Although it’s still early days, three trends stand out. First, AI-fueled tech investments have become one of the key drivers of economic growth, accounting for about half of the growth in real gross domestic product since 2025.1 Second, productivity growth has picked up compared with the previous decade.2 These productivity gains, however, have been mostly concentrated in tech-related industries till now. Finally, employment in these industries has declined since 2023, but it is unclear whether this reflects AI-driven displacement or “rightsizing” after the post-pandemic hiring surge.3 Occupational data also offers limited evidence of any broad-based job losses due to AI, so far.
table of contents
- The tech investment boom
- Tech investments have lifted productivity, but unevenly
- Productivity gains haven’t translated to broad job losses
- Keep an eye out for the longer term
The tech investment boom powering the US economy
There is no official data that tracks AI-related business spending in the United States. But two categories of business investment in national accounts data from the US Bureau of Economic Analysis—information-processing equipment and software—collectively provide a useful proxy for total “tech investment” in the economy.4 This measure is not comprehensive, though: While spending on servers, networking equipment, and software is captured in the metric, construction of data centers is not, as it falls under the “structures” component of business investment.
According to the US Bureau of Economic Analysis, real or inflation-adjusted tech investment5 has grown 2.6% per quarter on average since 2023, at more than twice the 1.2% growth recorded in total business investment. The pace of growth in tech investment has also accelerated over the past year. Within tech, investment in information-processing equipment has risen by 3.2% per quarter, while software investment has increased by 2.1% per quarter during the same period. Overall, since 2023, tech investment growth has been higher than the 1.9% average quarterly gain recorded between 2010 and 2019 (figure 1).
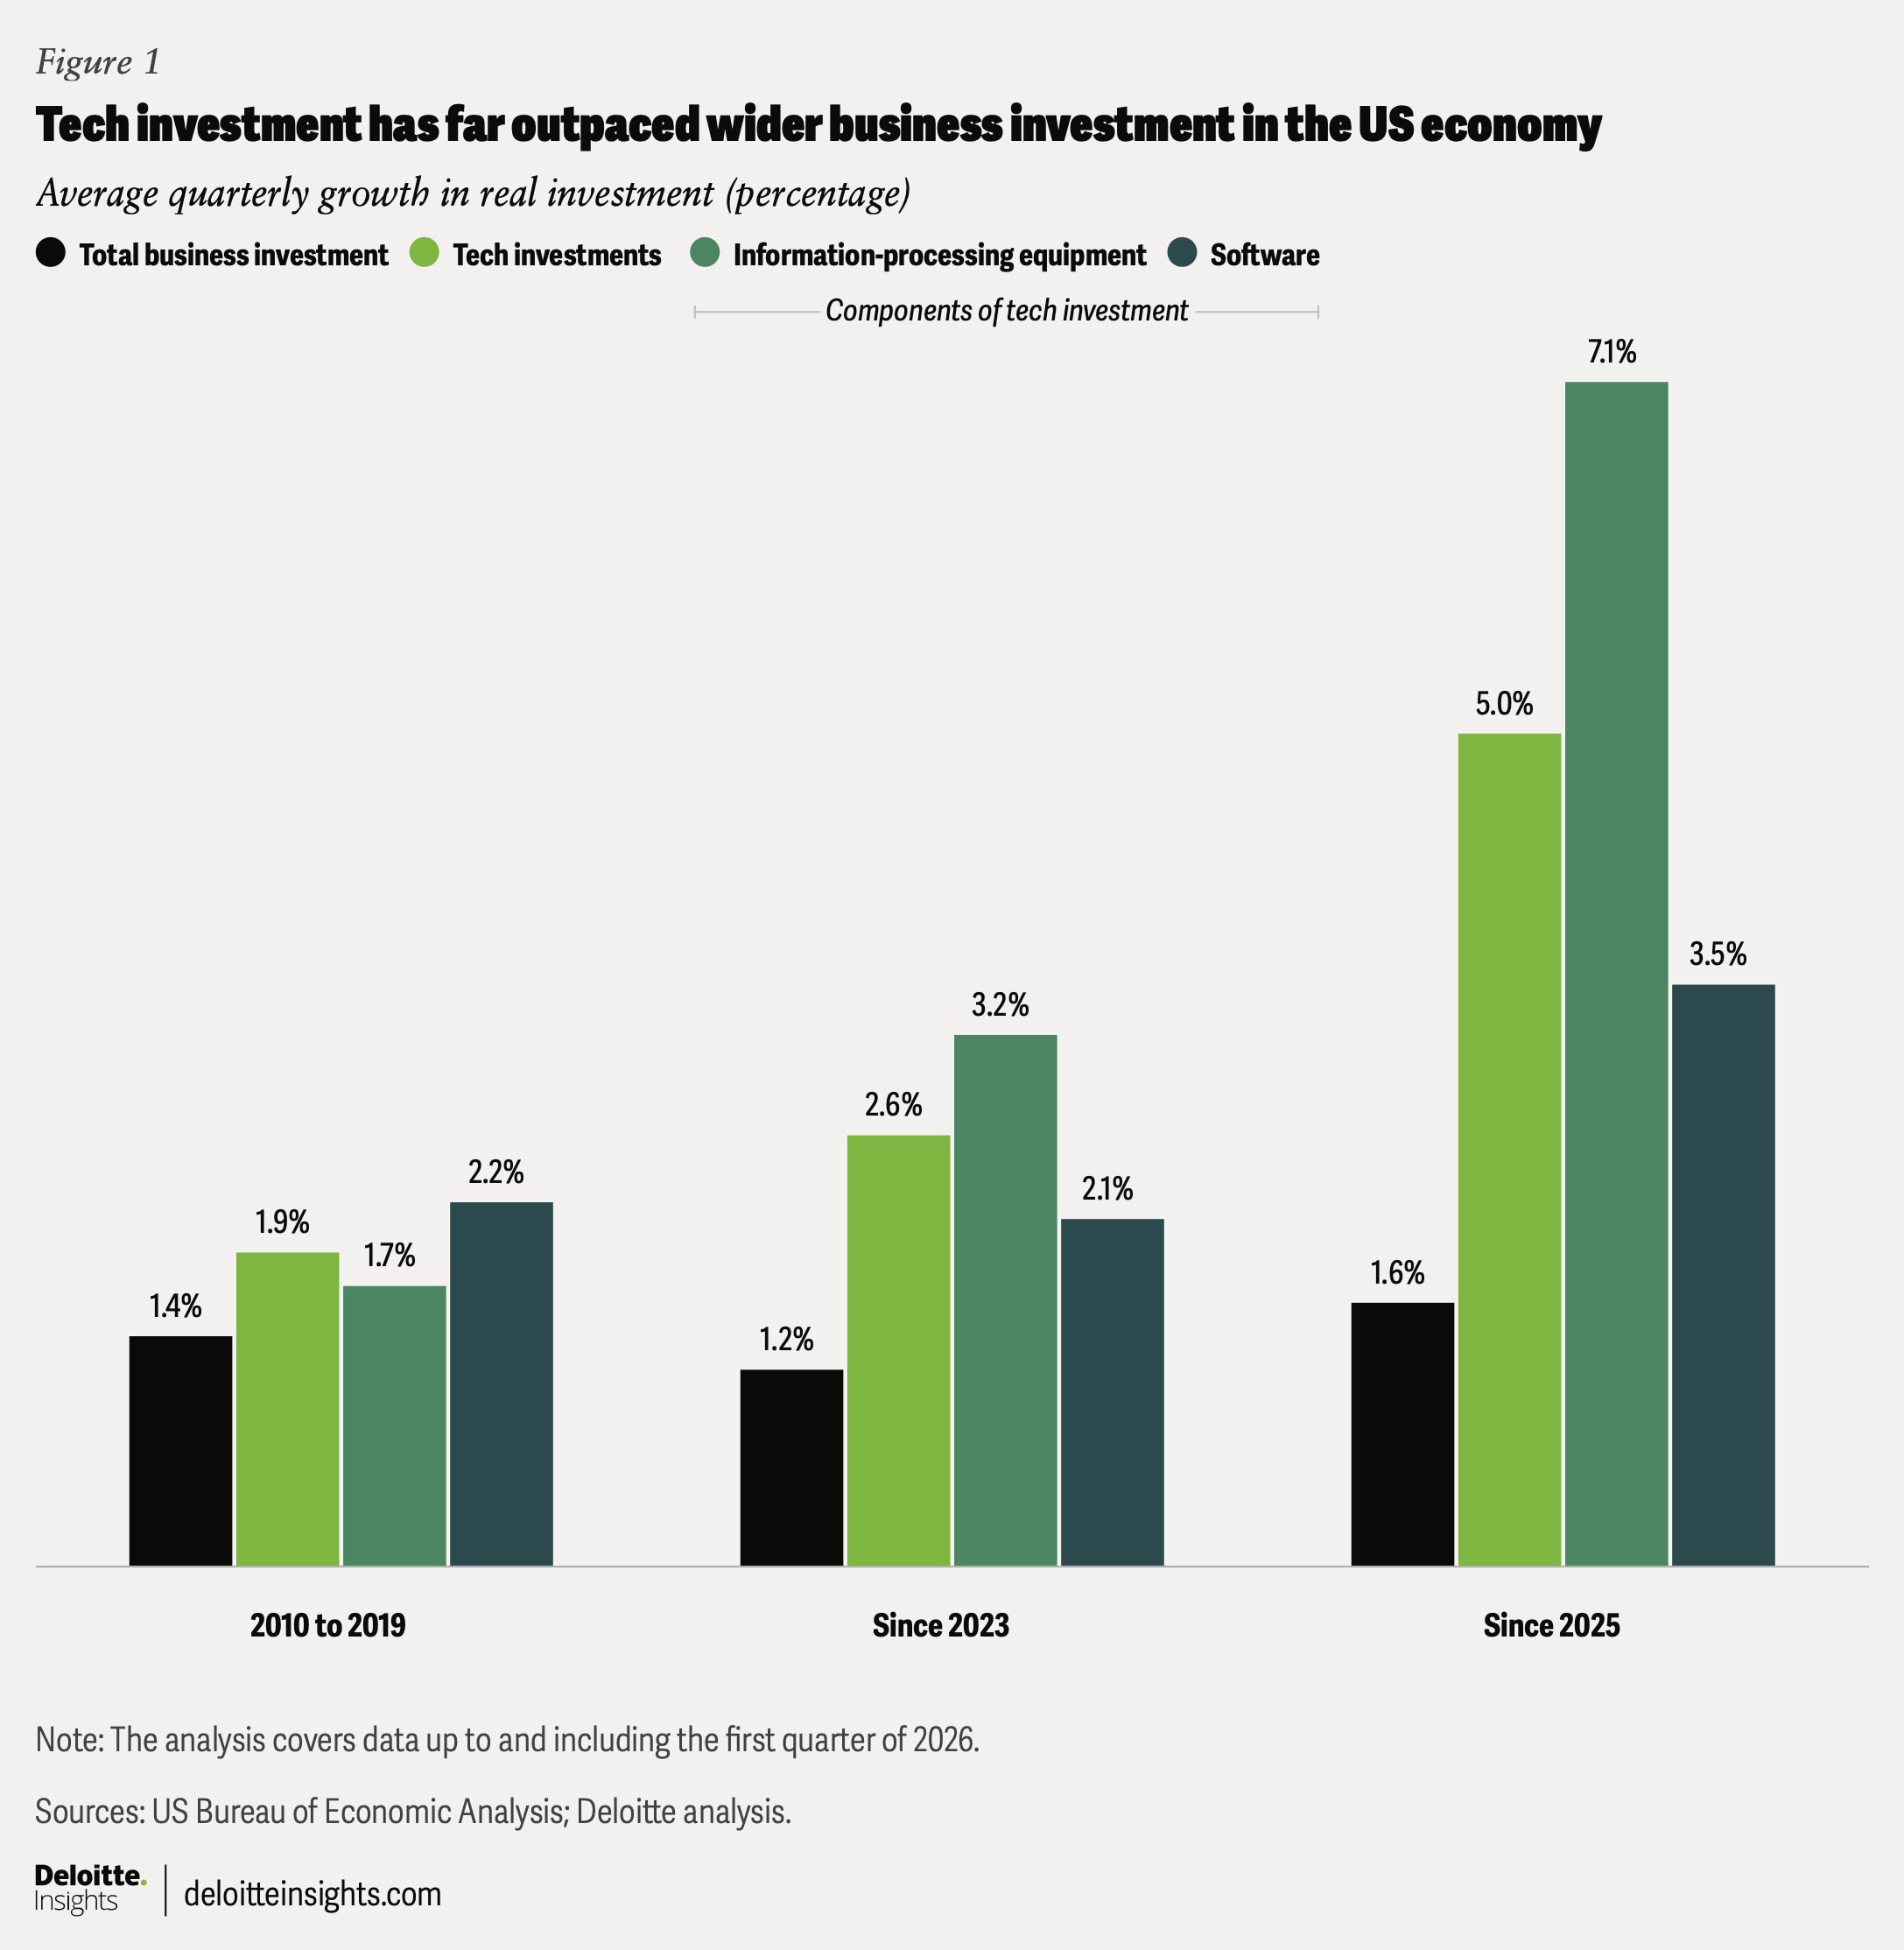
Rising tech investments have played a key role in driving economic momentum, accounting for a quarter of real GDP growth since 2023. That share has doubled over the five quarters through the first quarter of 2026. Notable though it is, it also leaves the economy exposed if the current boom slows or reverses.
In their downside scenario, Deloitte economists assume that an unwinding of the AI bubble will likely weigh on the economy through weaker capital spending and equity-market losses.6 Tech companies have been a major contributor to recent gains in US equity prices. Since the beginning of 2025, the tech-heavy Nasdaq composite index has risen 34.3% (as of June 9, 2026).7 These gains, in turn, have likely aided consumer spending, especially by high-income households, through a positive wealth effect.8
Tech investments have lifted productivity, but unevenly
Productivity growth has picked up, likely aided by rapid growth in tech investments. Since 2023, productivity in the nonfarm business sector—measured as real output per hour of all workers—has grown 2.6% per quarter on average, which is more than double the 1.2% average quarterly pace seen in the last decade.9
But is this rise in productivity broad-based? Headline productivity data offers limited sectoral detail. To adjust for that limitation, we have combined two data sets: real gross value added from the national accounts tables published by the US Bureau of Economic Analysis and payroll employment data from the US Bureau of Labor Statistics.10 These allow us to estimate an alternative measure of productivity—output per employee—across major sectors.
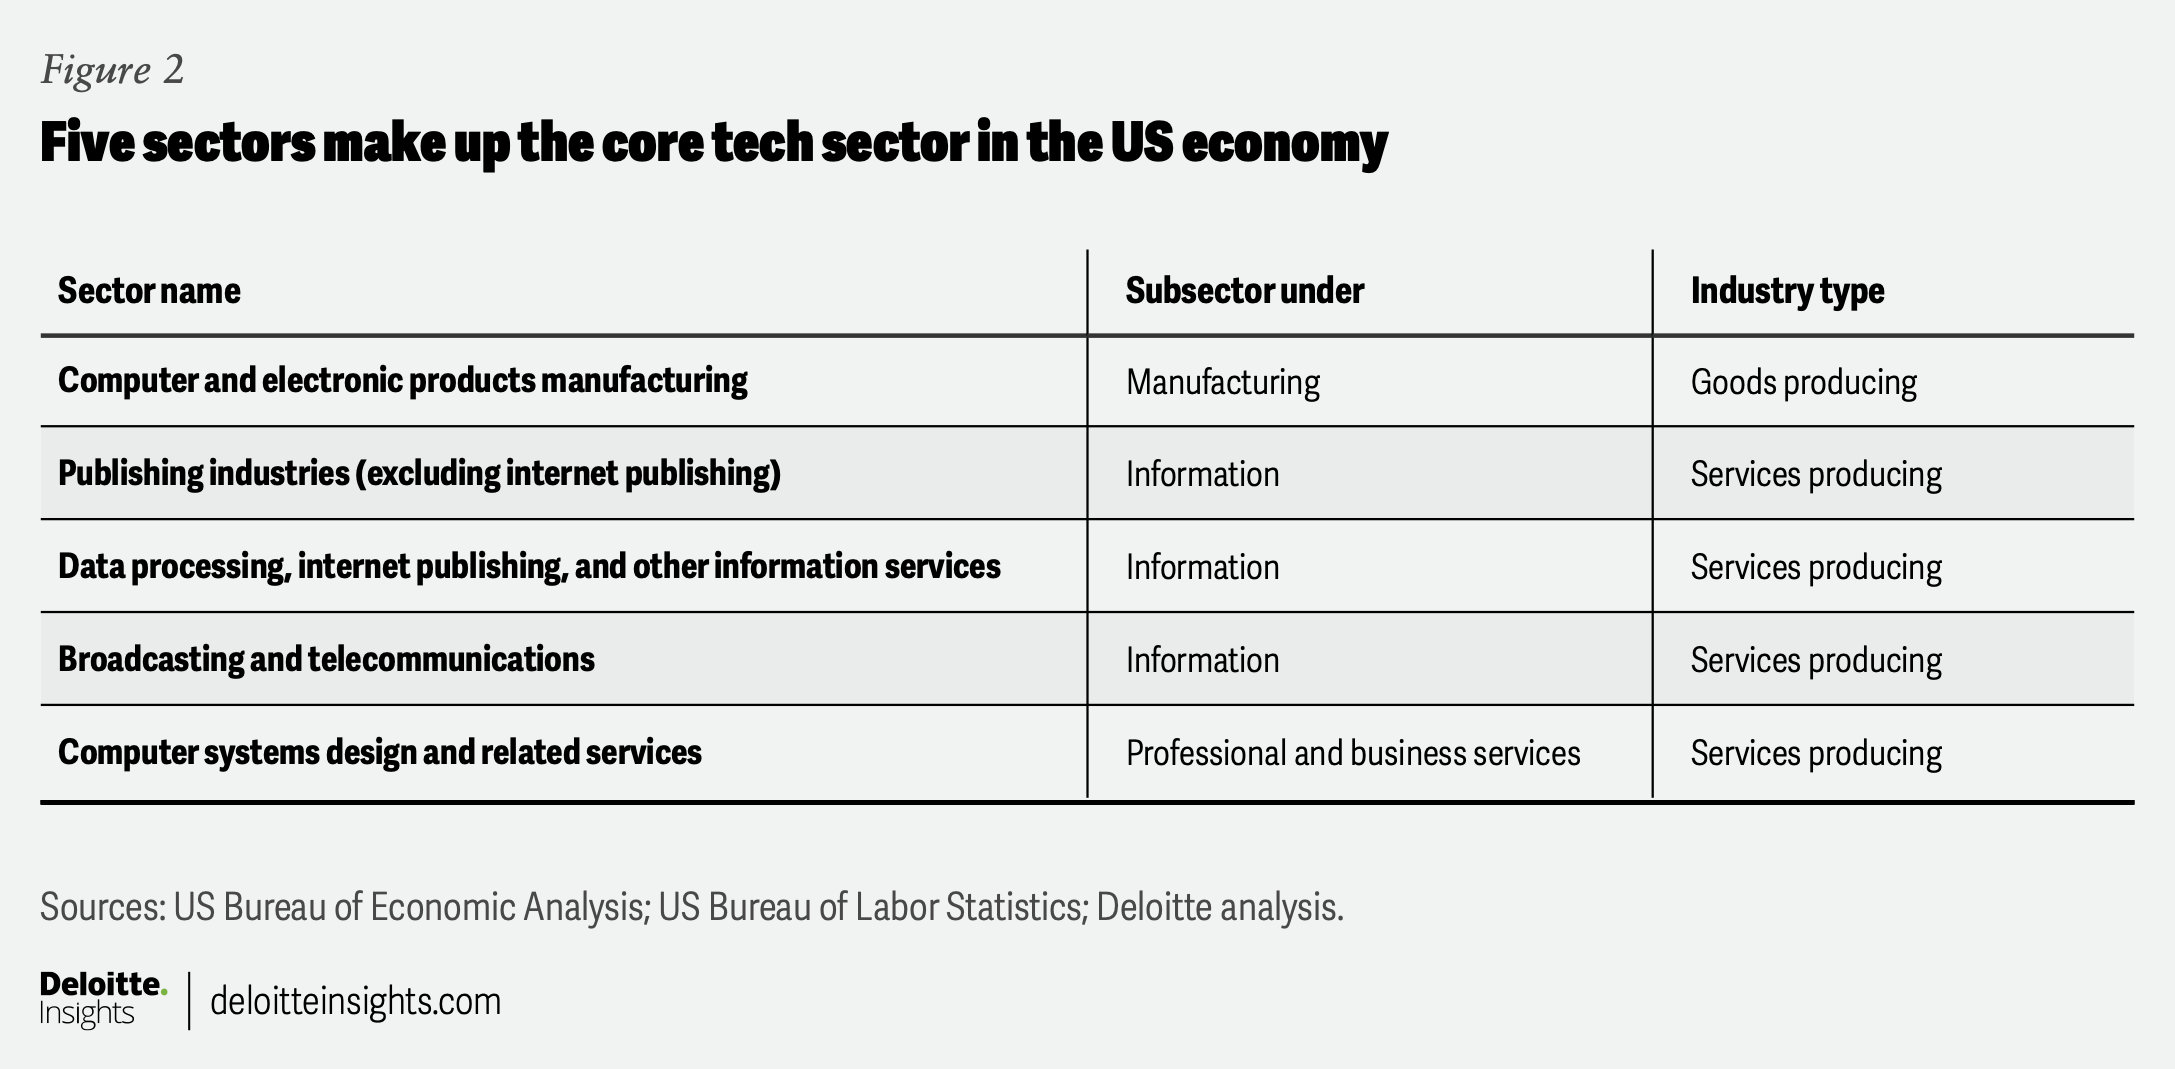
Given the technology focus, we have combined five sectors across goods- and services-producing industries to create a broader “tech sector” (figure 2). While publishing industries beyond internet publishing include non-tech areas like newspapers, we have retained the broader category due to the lack of more granular data for gross value added. The analysis is based on data through the fourth quarter of 2025—the latest period for which real gross-value-added numbers are available.
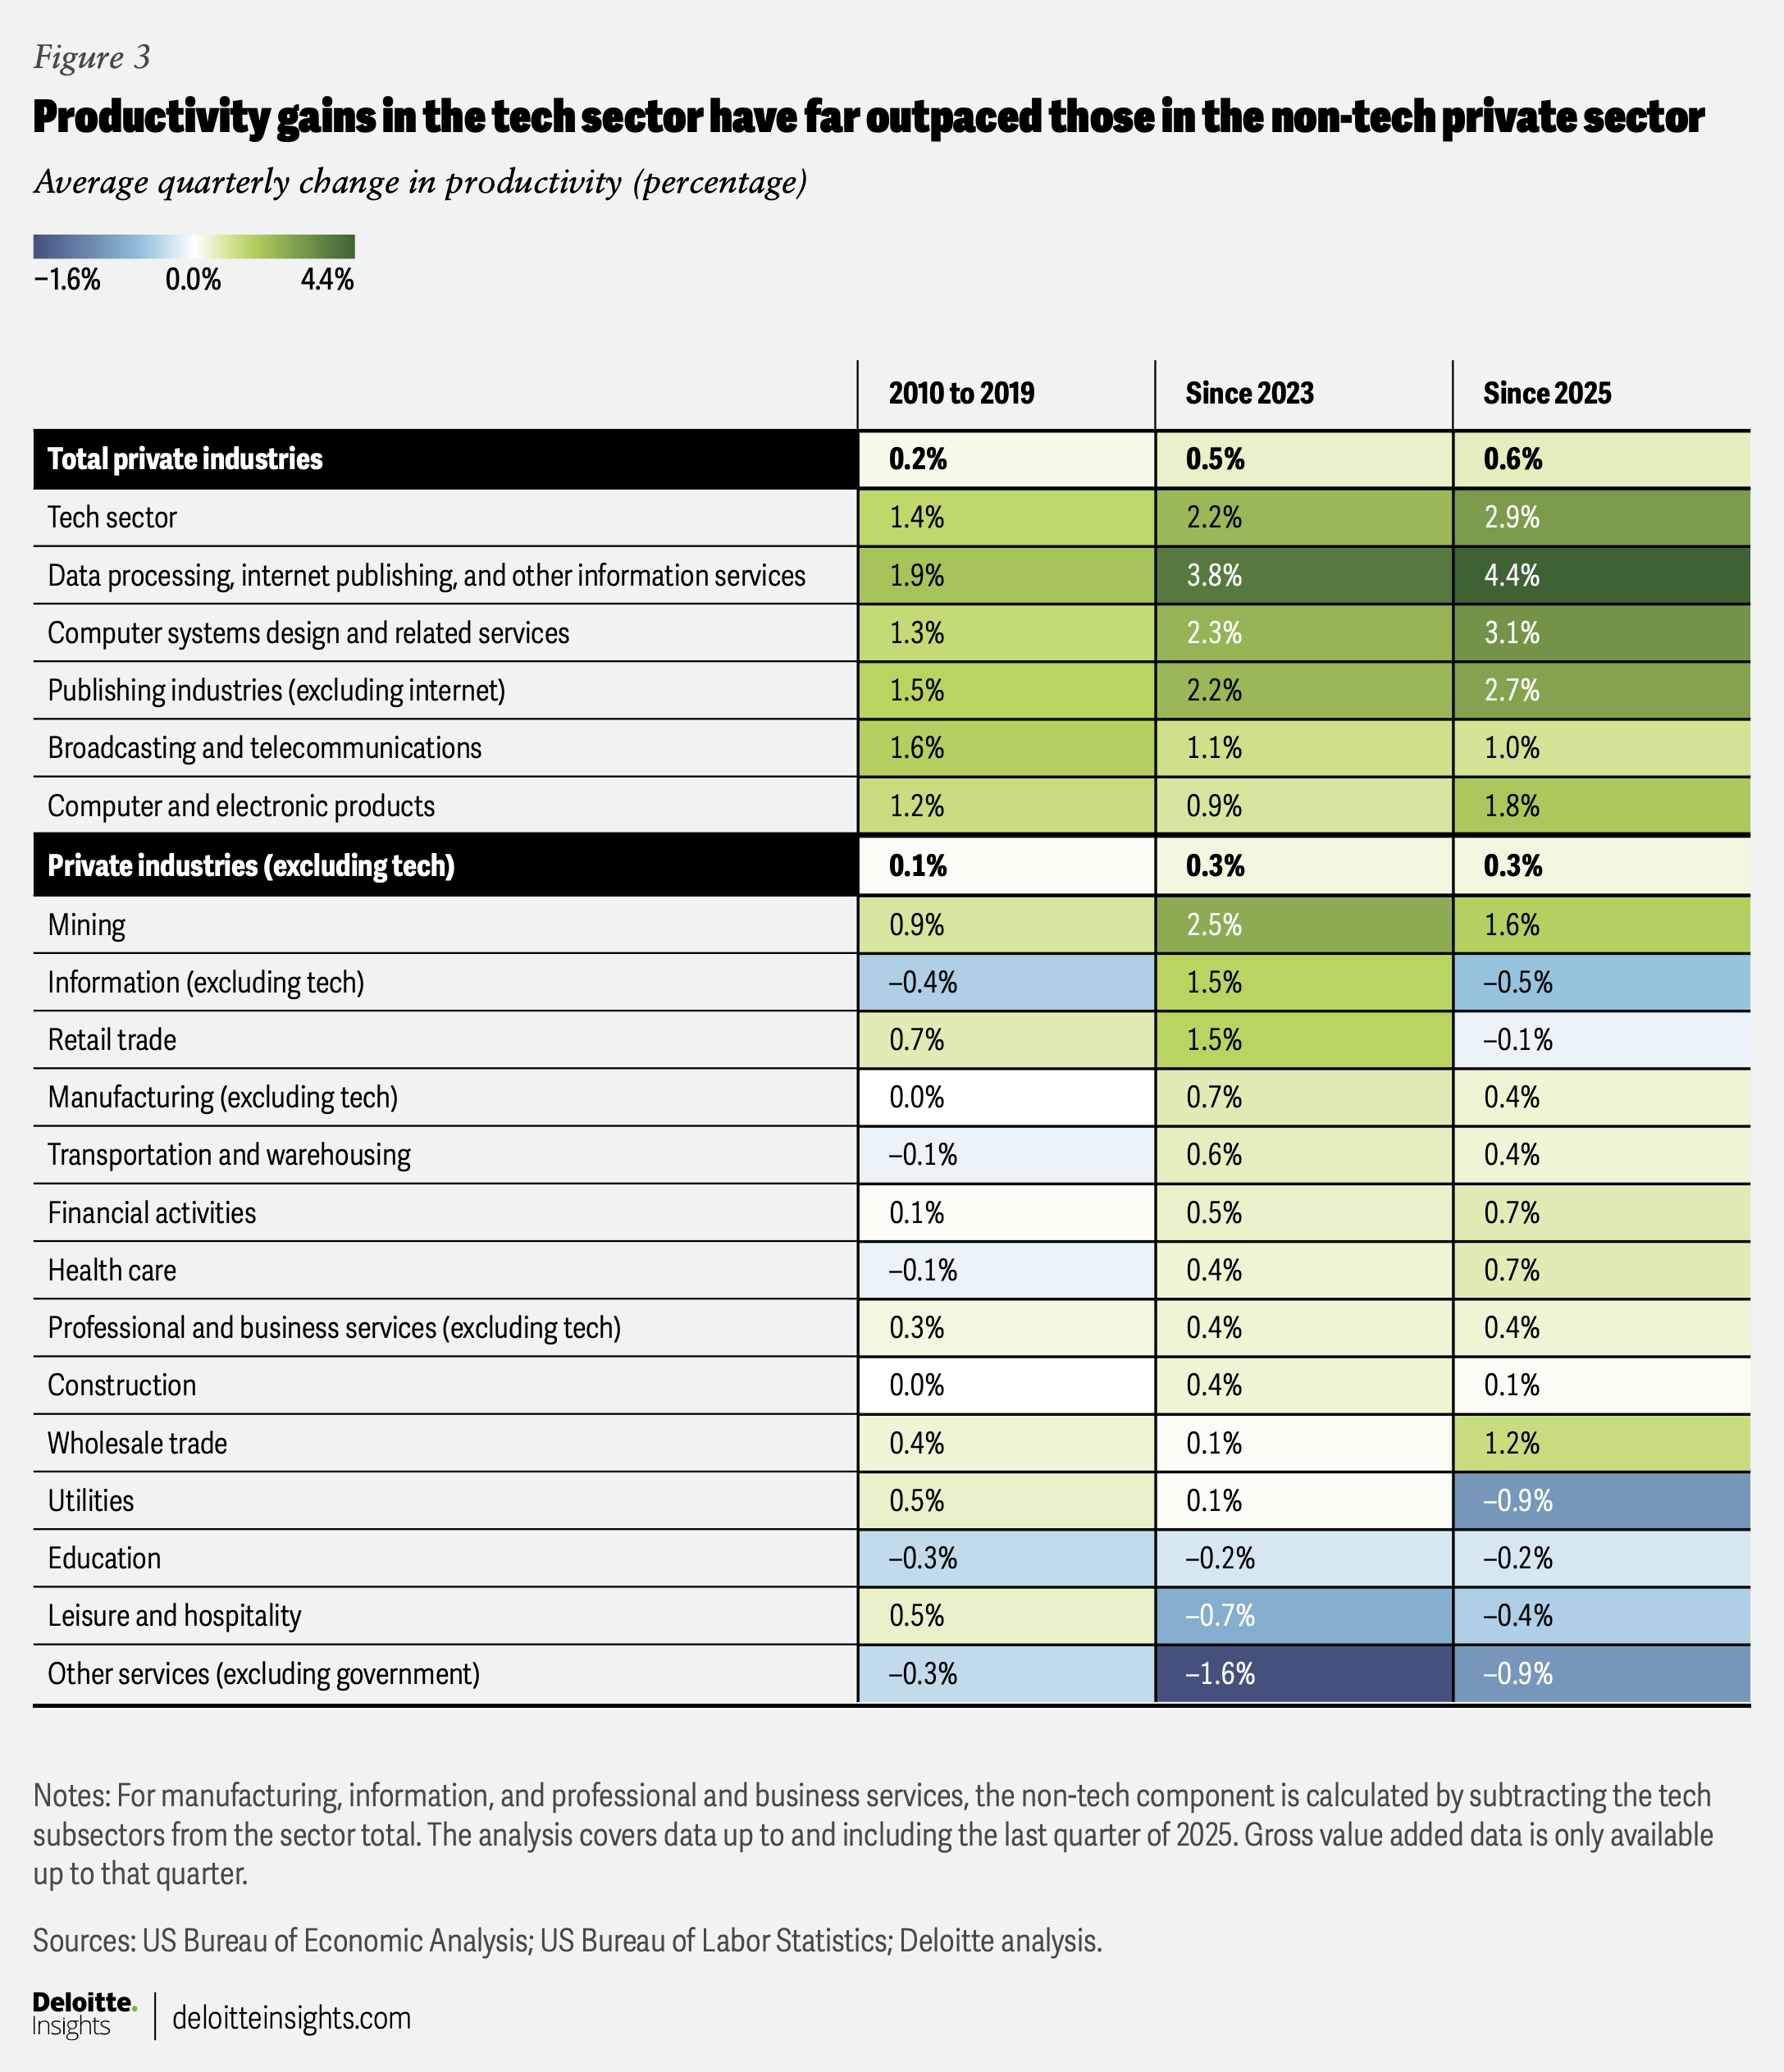
Our analysis suggests that productivity gains are mostly concentrated in technology sectors: Since 2023, for example, output per employee in the tech sector has grown at an average rate of 2.2% per quarter—well above the 0.5% increase in the broader private sector.
The pace of gain has accelerated as well, with tech-sector productivity rising by 2.9% per quarter on average in 2025. Within the tech sector, the strongest gains have been in data processing, internet publishing, and other information services, followed by computer systems design and related services. Growth in tech-sector productivity has also exceeded its pre-pandemic trend: between 2010 and 2019, it averaged 1.4% per quarter.
Outside the tech sector, productivity gains have been more modest (figure 3). Productivity has declined in leisure and hospitality and education services. Some sectors that are expected to benefit increasingly from AI adoption have, however, posted gains: Productivity in financial activities, for example, has gone up 0.5% on average per quarter since 2023, while for transportation and warehousing, the pace of gain was 0.6% per quarter. But in sectors like healthcare, the benefits of AI adoption may not just be reflected in terms of productivity increases but also in outcomes such as lives saved and the quality of care delivered.
Productivity gains haven’t translated to broad job losses
Has the recent surge in technology investment and productivity come at the expense of employment? The evidence so far doesn’t suggest a broad trend. And, besides, trends also vary based on the employment types analyzed, such as tech-sector payrolls, employment in AI-exposed occupations, and the size of the total tech workforce in the economy.
Payroll employment has declined in the tech sector: Payroll employment in the tech sector—as defined in the previous section—has declined even as productivity has risen.11 Since 2023, tech-sector employment has fallen by about 0.4% per quarter on average, compared with a 0.2% average quarterly increase in private-sector payrolls excluding tech. This also marks a trend reversal from the previous decade when tech-sector employment grew steadily by about 0.4% per quarter on average.
This decline, however, does not necessarily point to a structural, AI-driven job displacement. That’s because the period of analysis is short, and part of the recent weakness likely hints at rightsizing after a rapid post-pandemic hiring surge. Between 2021 and 2022, for example, tech-sector payrolls rose by 10%, outpacing payroll gains in the rest of the private sector. Within the tech sector, payrolls in data processing, internet publishing, and other information services grew by 24.6% over the same period.
Moreover, payroll declines are not limited to the tech sector. In fact, since 2024, broader private-sector job growth has been concentrated in only a handful of sectors, especially in healthcare and social assistance, leisure and hospitality, and construction.
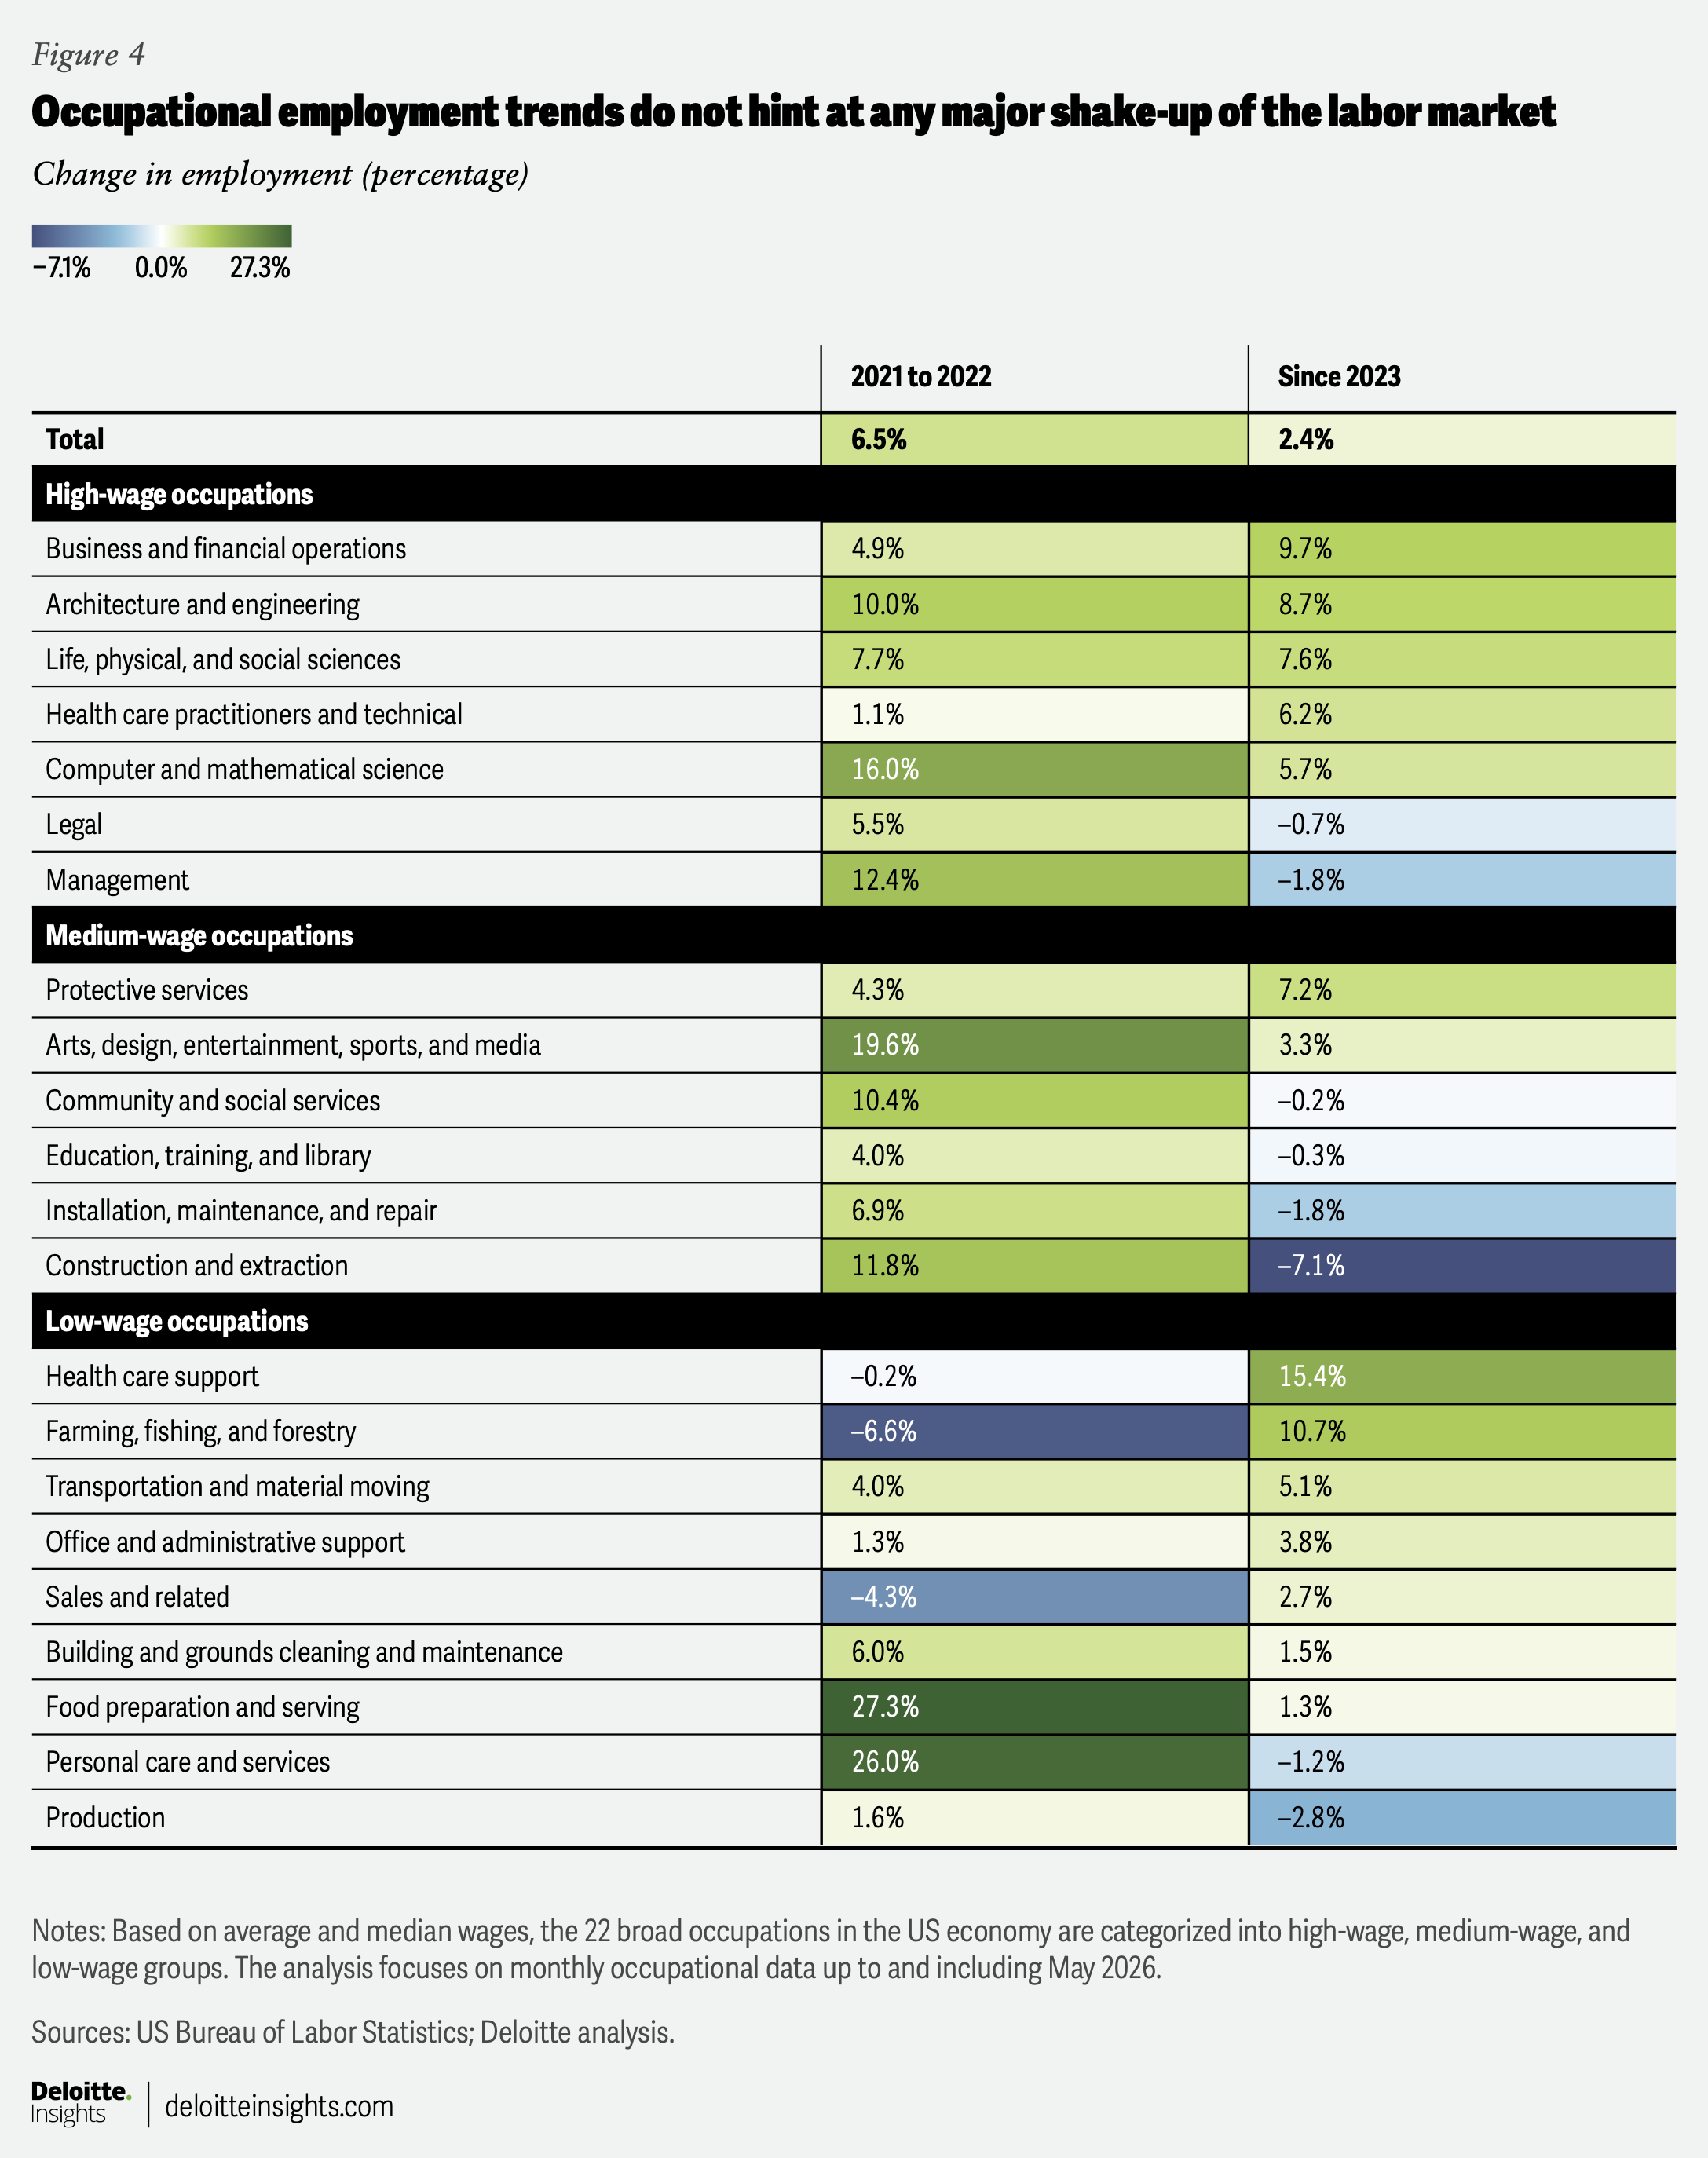
Trends in monthly occupational data do not show any major AI impact: A swathe of research, so far, suggests that AI is expected to fill in for rule-based, repetitive tasks in occupations like computer and mathematical sciences, business and finance operations, office and administrative support, and legal (to name a few), which are more exposed than physical-labor occupations like protective service and construction and extraction.12 But does more exposure to AI mean job losses? Not necessarily, at least as is evident from trends in monthly occupational data till now. The US Bureau of Labor Statistics publishes data on monthly employment for 22 broad occupations. This monthly series doesn’t have data for sub-occupations within these broad categories or across different sectors of the economy.13
The evidence so far doesn’t indicate any major shakeup in the labor market (figure 4). Computer and mathematical occupations, for example, have grown by 5.7% since 2023, with strong gains in 2025 and until date in 2026. And that follows a 16% surge in employment between 2021 and 2022. Other AI-exposed occupations show a similar pattern: Office and administrative support occupations are up 3.8% since 2023. This occupation is especially notable because it is not only considered generally more exposed to AI but has also been affected by earlier waves of technological change, including the spread of internet-based tools and software in the early 2000s.
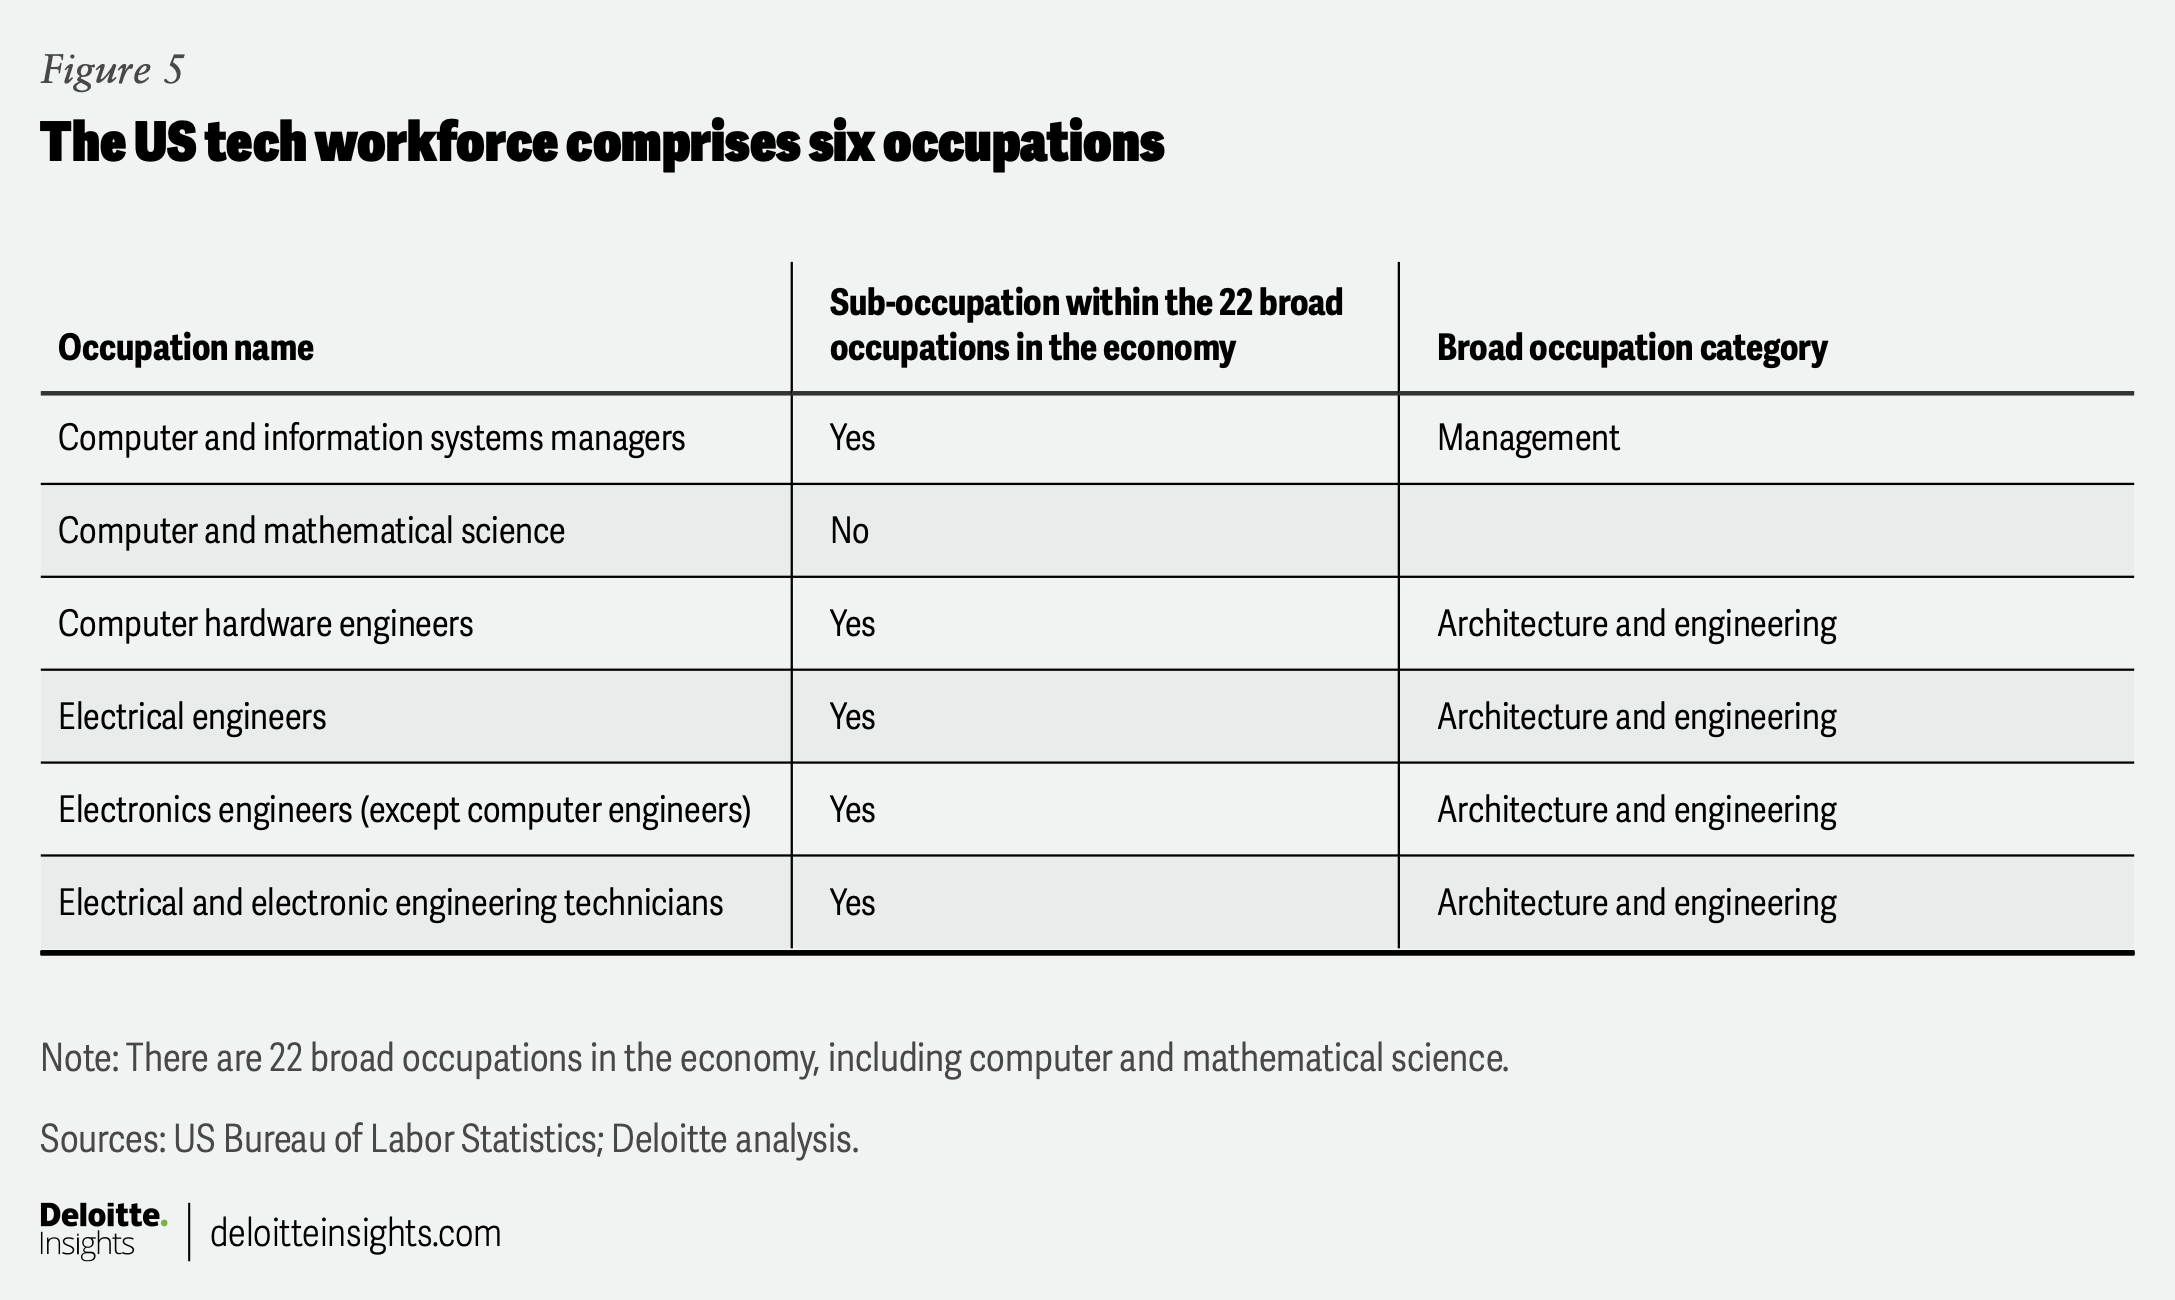
The tech workforce is still growing, though: In a 2021 Deloitte publication, we defined the tech workforce as comprising six types of occupations, based on the Occupational Employment and Wage Statistics annual data from the US Bureau of Labor Statistics.14 These include one major occupation (out of 22 broad ones in the economy) and five sub-occupations (figure 5). Computer and mathematical occupations account for more than four-fifths of this workforce.
Given the advances in AI so far, one might expect the tech workforce to be impacted by them. Yet, evidence suggests that this workforce has continued to expand, albeit with variation across the six occupations mentioned. Between 2024 and 2025, the tech workforce expanded by 6.6%, following an 8.4% gain in the previous three years. In both periods, tech workforce growth outpaced total employment growth.
Keep an eye out for the longer term
Technological progress hasn’t always led to job losses. The advent of spreadsheets, cloud-based financial software, digital databases, and audit analytics tools didn’t necessarily lower demand for financial analysts, accountants, or auditors. Annual data from the Bureau of Labor Statistics’ Occupational Employment and Wage Statistics shows that employment of accountants and auditors rose 64.5% between 2021 and 2025, while employment of financial analysts went up by 129.4%.15 That’s far higher than the 21.5% gain in total employment in the economy during that period. In effect, demand for these two occupations rose even as new technologies made routine analytical work faster and less costly. This dynamic is often referred to as the Jevons paradox: Efficiency gains lower costs, thereby leading to rising demand.16
Taken together, the evidence so far offers limited indication that AI adoption has translated into broad job losses. Employment has softened in some technology industries, but AI-exposed occupations continue to grow, and the tech workforce has expanded faster than overall employment. However, this is too short a span of time to analyze broad structural shifts in the labor market, especially the impact on the occupational composition of the workforce.
What is evident, though, is that the AI-driven tech investment surge is leaving its mark on the US economy. Tech investments have become an important driver of US economic growth, while productivity has surged for tech industries. Whether these gains will percolate to other sectors over time, or if the current boom itself will be sustained, will help determine the trajectory and nature of US economic growth over the longer term.
by
Akrur Barua
The author would like to acknowledge Dr. Ira Kalish, Deloitte's chief Global and US economist, for his reviews, and Ruhika Agarwal from the Economics team for her Insights and contributions for this piece.
Editorial (including production and copyediting): Aditi Rao, Arpan Saha, Preetha Devan, and Anu Augustine
Design: Harry Wedel
Audience development: Pooja Boopathy
Cover image by: Harry Wedel
Knowledge services: Rishitha Bichapogu
Visit the Deloitte Global Economics Research Center
Access more insights for the consumer spending, housing, business investment, globalization & international trade, fiscal & monetary policy, sustainability, equity, & climate, labor markets and prices & inflation sectors.