
The future is coming ... but still one day at a time
Seven data-driven trends defining the future of the retail and consumer products industry
The desire to know
In roughly 560 BC, Croesus, the then ruler of Greece, was contemplating war with the Persians. As such, he sought out the most famous futurist at the time—the Oracle at Delphi. The Oracle told him: “If Croesus goes to war, he will destroy a great empire.” Pleased by her answer, Croesus went out to meet the Persian army. The battle was fierce, but ultimately ended with the destruction of Croesus’ army and his capture at the hands of the Persians.
Croesus was furious and told the Persians how he had been misled by the Oracle at Delphi. Moved by his story, the Persians went to the Oracle to find out if Croesus had been betrayed. The answer they got: “The Oracle had spoken the truth: a great empire had been destroyed by Croesus—but it was his own.”
As Croesus’ story shows, human beings have been trying to predict the future for as long as anyone can remember. We are preoccupied with knowing what tomorrow will bring—and often go to great lengths to foretell the future.
You may be wondering what any of this has to do with the retail and consumer products (RCP) industry? Well, it so happens that over the last 20 years, predicting the future of retail and consumer products seems to have become the favorite pastime of many industry analysts, experts, and pundits. Titles such as “Retail 2020,” “The future of consumer products,” and similar titles abound in the media and the larger industry.
We thought it fitting, as we enter into the ’20s, to take a moment to ask ourselves: “We’ve reached 2020—so how did the industry do at predicting the future?”
Our team spent six months surfacing, organizing, and reviewing 20 years of market publications that attempted to predict the future of the RCP industry. We categorized the predictions; assessed them for methodology and thoroughness; researched their accuracy; and then worked to derive insights from the collection of data.
What we found seemed to be a bit far-fetched, even humorous, at times—we came across predictions that had completely missed the mark and stumbled upon significant aspects of the industry’s evolution that hadn’t been mentioned anywhere. For example, the global COVID-19 pandemic and its far-reaching impact is a perfect example of our inability to predict the future. This research led us to the conclusion that the industry as a whole has not been very adept at predicting the future and we certainly don’t consider ourselves immune to this criticism.
Humans have been trying to predict the future for as long as anyone can remember.
However, the industry—now more than ever—is hungry for a better understanding of the future of retail and consumer products. But there is no simple answer, as the forces affecting the sector—and thereby shaping the future—are incredibly complex and affect various sectors, companies, markets, and products differently. To pretend that there is a singular future—or answer—is, in our opinion, naïve at best.
So, we dug into our research to see if we could find a potentially better way to think about the future evolution path of the RCP industry. We took away from this analysis a framework of four disruptive forces—consumer preferences, technology advancement, economic pressures, and market forces. These forces, through their interplay, have given rise to seven trends shaping the future of the retail and consumer products industries. In this article, we delve into these forces and the resultant trends with the aim of informing go-forward decisions, strategy, and investments for retail and consumer products companies.
A reality check on predictions
As we worked to catalog the massive collection of industry predictions from the last 20 years, a common picture emerged, along with expectations of how the RCP industry in the United States would evolve. Perhaps the saving grace was that the majority of predictions did not provide a time horizon for their realization. That said, if these predictions had come true by 2020, then we’d find ourselves in an environment where:
- Most retail sales would be done online. The traditional brick-and-mortar stores would be obsolete and nearing defeat to online-only players.
- What remained of physical retail stores would have evolved into “experiential” showcases, where “showrooming” is the norm and inventory levels are minimal. Also, retail-as-theater would have come alive with near-field communication, touchscreen interfaces, and holographic “magic” mirrors.
- Digital devices would replace store clerks, enabling customers to try out products virtually, and algorithms would make personalized recommendations based on purchase history.
- Socially aware consumers would be fueling the buy-one/donate-one model, or ordering personalized, custom-made products produced on-site and on-demand aided by 3D-printing technology and body scanners.
- The center aisle in grocery stores would be dead, with customers gravitating toward healthy, fresh options. The supply chain would be fully RFID-enabled, allowing companies to intelligently order more merchandise and ship it to the store to maximize perishable shelf life before expiration.
- Customers shopping from the convenience of their homes would have migrated from desktop and mobile interfaces to purchasing via voice on their in-home countertop device. Also, their refrigerators would be submitting auto-fulfillment orders when milk (and other groceries) levels got low.
Now, you could argue that since most of the predictions didn’t provide a time horizon, perhaps these prophecies are yet to come true. Of course, that may be the case, and much is rapidly changing in the current situation with COVID-19. However, when you look at the retail and consumer products environment today, you can’t help but recognize a very different reality. Here’s a glimpse of the current state:
- As of 2019, many stores have closed, dominated by those based in malls, many more have opened, with a net increase of 2,198 stores over the past three years. For every chain with a net closing of stores, five chains opened new stores in 2019.1
- Retailers focused on discount brands and channels have doubled their sales in the last 10 years.2
- Stores and offerings focused on convenience have led the charge, driving an estimated 67% growth in retail.3
- Traditional grocers have seen market share in food retail sales cut by more than half, dropping from 90% in 1988 to 44% in 2018.4
- While the largest online retailer continues to grow at an impressive rate, major mass merchandisers have also been able to find their own footing, growing by 9% in 2017–2019.5
- Most in-store technologies have yet to make the impact many projected. Personalization technologies continue to look for their breakout use case. Even RFID, after 20 years of hype, continues to be largely underpenetrated, looking for the economic tipping point that would fuel widespread adoption.
It’s clear that a massive chasm exists between the narrative built off a wide base of predictions and the actual evolution of the RCP industry. For retail and consumer products companies, this begs the question “why.”
Missing the mark … and opportunities
Given the deep delta between the predictions and the reality of the RCP industry, we sought to understand why many of these predictions had missed the mark. Our analysis revealed they shared a set of common flaws:
- For one, many of the predictions were self-serving—they had been made by industry or company leaders focused on selling a service and were based on commissioned surveys, white papers, research projects, etc., all of which usually drive toward a predetermined conclusion.
- Many also failed to specify a clear time horizon when talking of the “future,” thereby limiting their value for retail and consumer products companies as to when they could effectively incorporate these insights into their strategic planning.
- Others seemed entirely prophetic with headlines stating outlandish predictions for the future of retail without robust supporting analyses or data.
- Finally, and perhaps most common, were predictions based on the rise of a specific technology—such as virtual reality, mobile payments, or drone delivery—that ignored customer adoption, the economic reality, and regulatory hurdles in achieving that future. In fact, we couldn’t identify a single technology that arrived and achieved significant industry disruption within a five- to seven-year time horizon.
Of course, the future is always filled with uncertainty (and hence the desire for prophecies). As organizations set their strategy, they are hedging bets against the future and trying to determine which critical uncertainties are probable.
However, they must remember that no deliberate change becomes a disruptive force overnight. E-commerce, the impact of mobile technology, the growing power of the consumer, competition from startups, the rise of new business models all impacted the industry, but none appeared so quickly that they blindsided the stakeholders—at least not if they were paying attention. The bigger challenge isn’t in identifying change, it’s the glacial speed at which most organizations are able to respond to it. We are seeing that many organizations have accelerated the pace at which they respond to the COVID-19 pandemic. It remains to be seen if this will continue and who the winners might be. A number of missed opportunities remain.
The bigger challenge isn’t in identifying change; it’s the glacial speed at which most organizations are able to respond to it.
From prophetic to practical
Having figured out why many of the predictions had missed the mark, we set out to explore if there was an alternate approach that would have been more instructive of the potential evolution path of and opportunities in the RCP industry. What we determined is that the real signs were visible in the industry data, the economic trends, and consumer insights, rather than in the prophecies of the pundits.
“If you don’t know where you are, a map won’t help.”
All disruptive changes appear first across these three dimensions, then emerge as a visible trend before growing to be a significant industry force. This is not to say that there aren’t disruptive forces at play—you simply have to know where to look, how to measure, and how to interpret the data for its predictive power.
For example, even though the data showed the economy was likely overdue for a recession, the negative economic impact of the COVID-19 pandemic still caught most companies by surprise.6 The pandemic has fundamentally impacted every step of the retail and consumer products value chain in ways that were unpredictable even a few months ago. While the global pandemic was certainly not foreseen by anyone, companies might have been better prepared for its impact had they been more proactive about regular downturn planning.
So, to draw into the predictive power of data and gain deep, actionable insights from our observations of the changes at work, we organized our research into a framework of four disruptive forces. The interplay of these forces has given rise to a set of seven broad yet distinct, measurable trends that we believe are shaping the future of the retail and consumer product sector.
The disruptive forces we identified aren’t new or unique to the current competitive environment in the United States. However, the way they manifest themselves is often unique. More importantly, it is the interplay of these tectonic forces that creates the threats and opportunities that retailers and consumer products makers must react to in order to navigate a disrupted environment. Here are the four disruptive forces:
Consumer preferences are changing
The truth is that the consumer is changing, but not necessarily in the ways we usually hear or think of. The changes occur at the confluence of cultural, social, economic, competitive, and technology options—and appear as choices. We must not confuse choice with change. Today’s consumer is a construct of the growing economic pressure and evolving environment around them.
Technology is advancing—at an accelerating rate
Moore’s Law, as first coined by Gordon Moore in 1965, defines the pace of technology advancement of computing power. Moore’s Law has been hotly debated and challenged, but to date, continues to hold true with respect to silicon computing chips. Others have expanded on Moore’s Law in an attempt to explain everything from bitcoin to DNA sequencing. Ultimately though, the law posits that technology is advancing at an advancing rate as measured by price/performance ratio of computing power. And, looking at technology advancement and its impact on the retail and consumer products market, it's hard to argue against the idea of the ever-faster rate of technology advancement and the disruptive force it creates.
Economic pressures abound
Although they’re often overlooked in the discussion on disruption, all competitive markets are subject to changing economic pressures and constraints. Economic factors such as consumer economic strength, health care costs, employment conditions, cost basis, cost of capital, and overall economic stability have the potential to bring about rapid change and come with significant disruptive potential.
Market forces are shifting
Markets are certainly shaped by consumers and technology, but perhaps of equal importance are the market forces that shape the competitive landscape. Changing barriers to entry, regulation, trade policy, or the threat of a global pandemic are all examples of market forces that have the potential to significantly disrupt status quo.
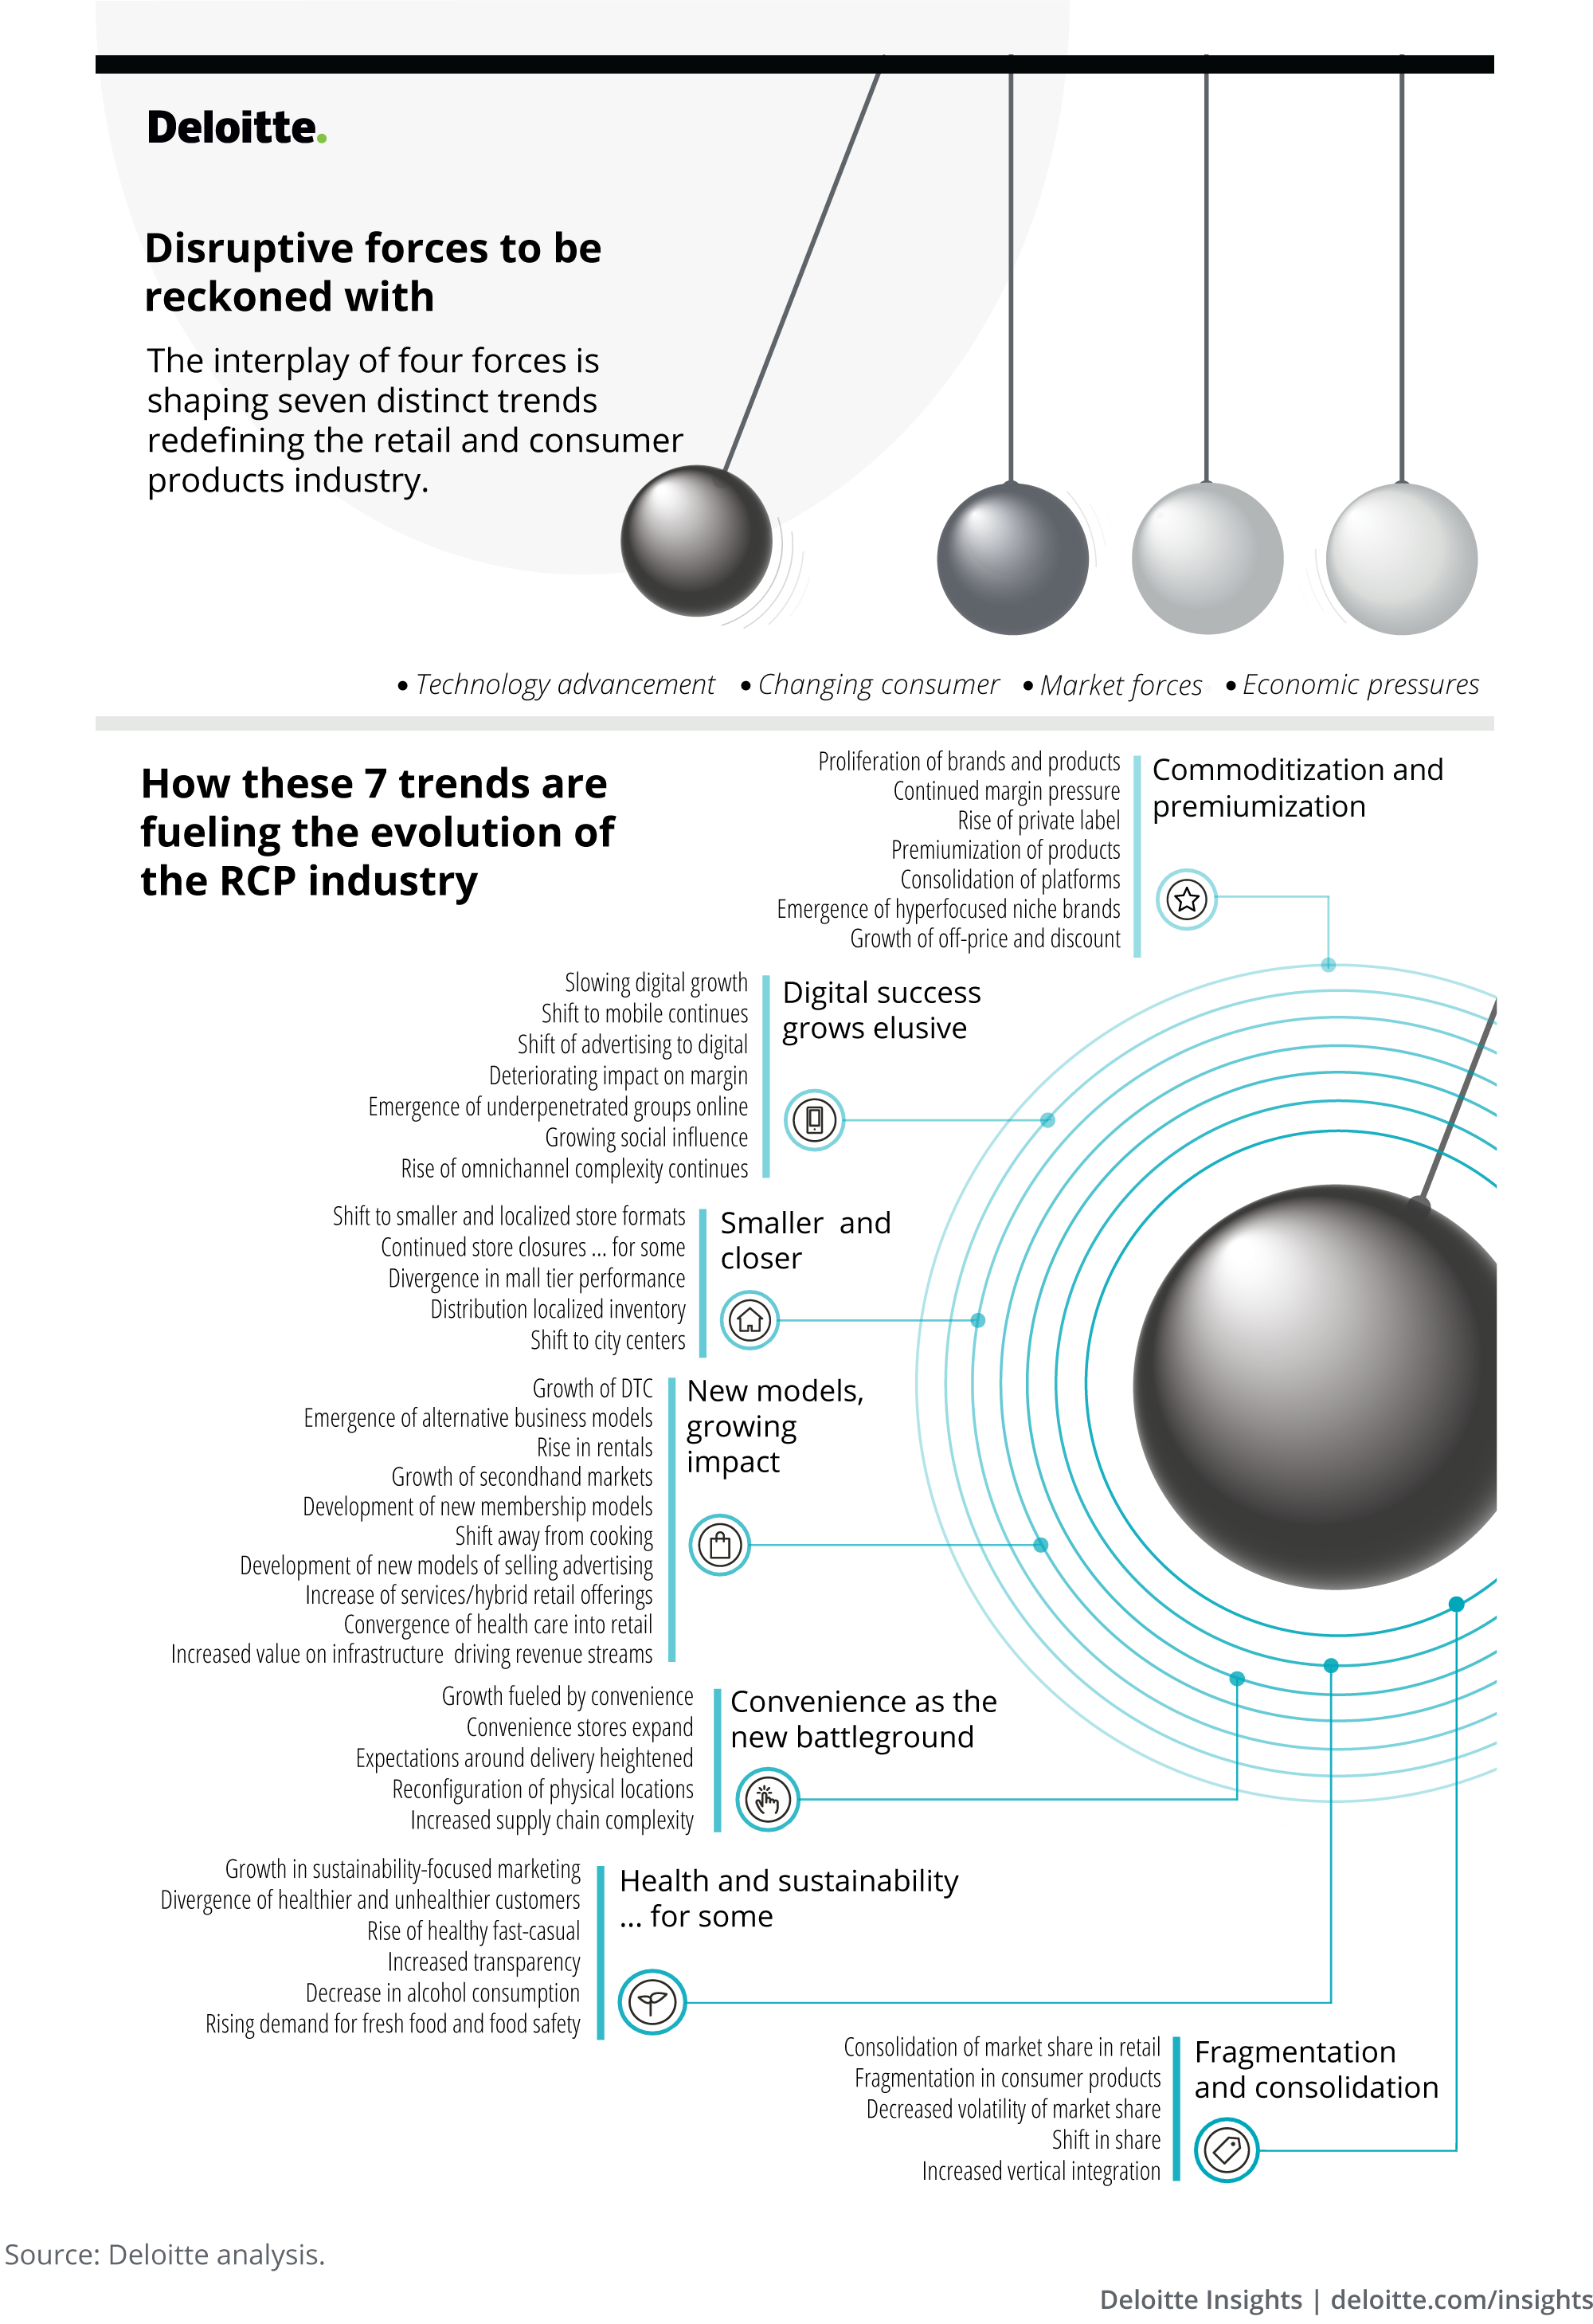
Seven trends shaping the future of retail and consumer products
Behind what brands report to the street, behind every decline in sales, behind each drop in customer satisfaction (CSAT) scores, there are millions of independent decisions taken by consumers on what they want to buy and how they want to buy it. These decisions are captured in data (through both traditional and nontraditional sources), which gives data immense power—the power to predict the probable future.
So, rather than prophesying the future, we listened to the data, and it spoke to us. We looked as deeply as we could into the data to glean individual consumer behaviors, actions, and preferences. The aim was to understand the behavioral shifts consumers are making and how these are impacting retail and consumer products brands. We examined the data through the lens of the consumer and macro forces at play to understand the past and current state of the industry; we also considered differences in sub-sectors and consumer segments.
Rather than prophesying the future, we listened to the data, and it spoke to us.
Our larger goal was to identify the critical trends shaping the RCP industry as well as the critical uncertainties that might have different plausible futures in the industry. In this report, we have highlighted the seven broad trends we determined, and how these undercurrents are fueling the evolution of RCP companies in the United States.
Trend 1: Commoditization and premiumization of products
Technology advancements have struck down entry barriers to markets, increasing access to and for consumers. The resulting explosion of choices is visible in the ever-expanding range of products, brands, companies, and channels on the market. For example, grocery stores today stock five times as many products as they did in the 1990s.7 And these products are being purchased via multiple channels, with 73% of consumers using a mix of physical stores, e-commerce, digital apps, social commerce, and marketplace platforms to buy products, adding to the competitive mix and complexity.8
For product-makers, it’s become easier to reach out directly to consumers and build a brand, thanks to e-commerce and social media platforms. They can also offer a wider product range, given the broader options available to them for sourcing and manufacturing globally. Today, there are a total of 153,000 new companies compared to 10 years ago.9
Amid the increasing number of products, brands, and ways to access them, another development is underway: Brand loyalty, for the most part, is falling to the wayside10 as consumers, inundated by products that seem increasingly commoditized, are tuning out brands.
Retailers are focusing on private label brands as these offer 25–30% higher margins than traditional brands.
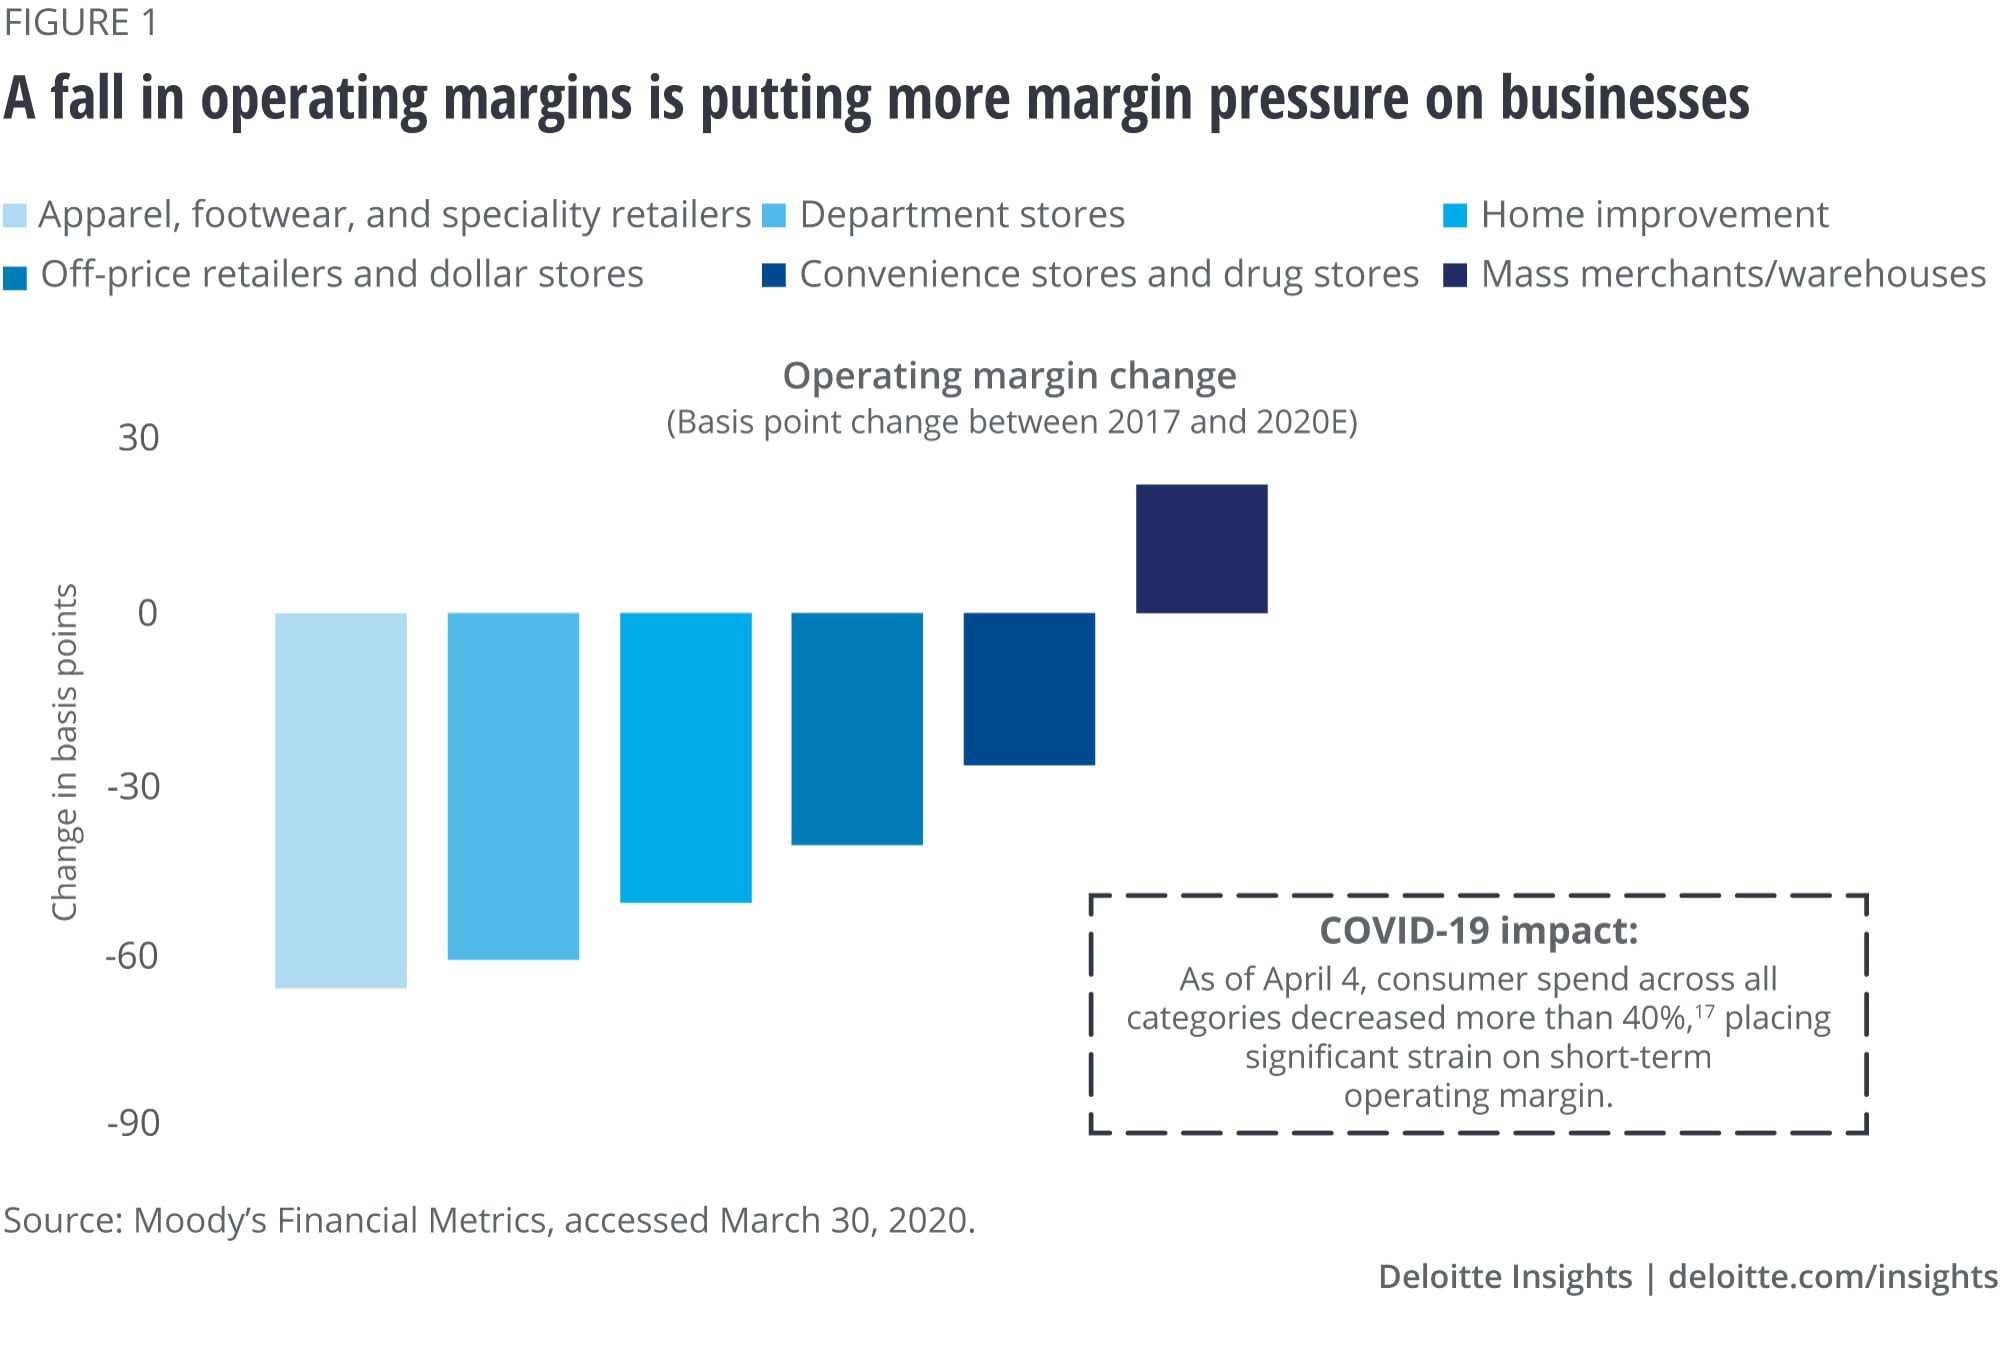
This commoditization is having a huge impact on the retail marketplace. On one hand, commoditization of products has led to fierce price competition, creating a downward pressure on the price brands can command for their products.11 On the other hand, higher operational, infrastructural, and labor expenses are raising the cost of producing the very same products.12 Furthermore, the options through which consumers access these products continue to squeeze margins. What’s left, then, are squeezed margins, curtailed profitability, and reduced capital returns on businesses. Since 2017, there has been a 40 basis-point average decrease in operating margins across retail (figure 1).13
In reaction to commoditization and squeezed margins, retailers such as mass merchants, grocers, and even department stores are focusing on selling their own private label brands. These brands offer 25–30% higher margins and more control in production, branding, pricing, and promotion—all at the expense of traditional branded consumer product-makers.14
Spanning across multiple retail categories and channels, private label products have outpaced the growth of their traditional counterparts by three times since 2015.15 Within this category, mass-retail private label segment sales have increased by 41% over the past five years—about four times higher than overall private label growth.16
In any discussion on private labels, it would be remiss not to acknowledge the changing positive attitude of and growing acceptance from consumers toward store brands. The days when consumers considered private label brands cheap, generic, and low-quality are gone. The percentage of consumers willing to pay the same or more for private labels over brand-name products rose from 34% in 2014 to 40% in 2019.18
Simultaneously, there’s been a move toward premiumization of private labels. Although discount products still represent the majority of private label sales, the share of premium private labels continues to rise, having climbed from 15.7% to 19% over the past three years.19 Meanwhile, retailers and consumer products companies have begun to leverage the greater control that private labels afford them to offer differentiated products that are better suited to their customers’ needs.
Takeaway: Today, consumers have more choices, competition is increasing, and convergence across industries has changed business dynamics. To remain competitive, many retailers have shifted toward private labels—and even their premiumization—and are driving profitability, customer loyalty, and growth.
Trend 2: Digital success grows elusive as ad spend rises
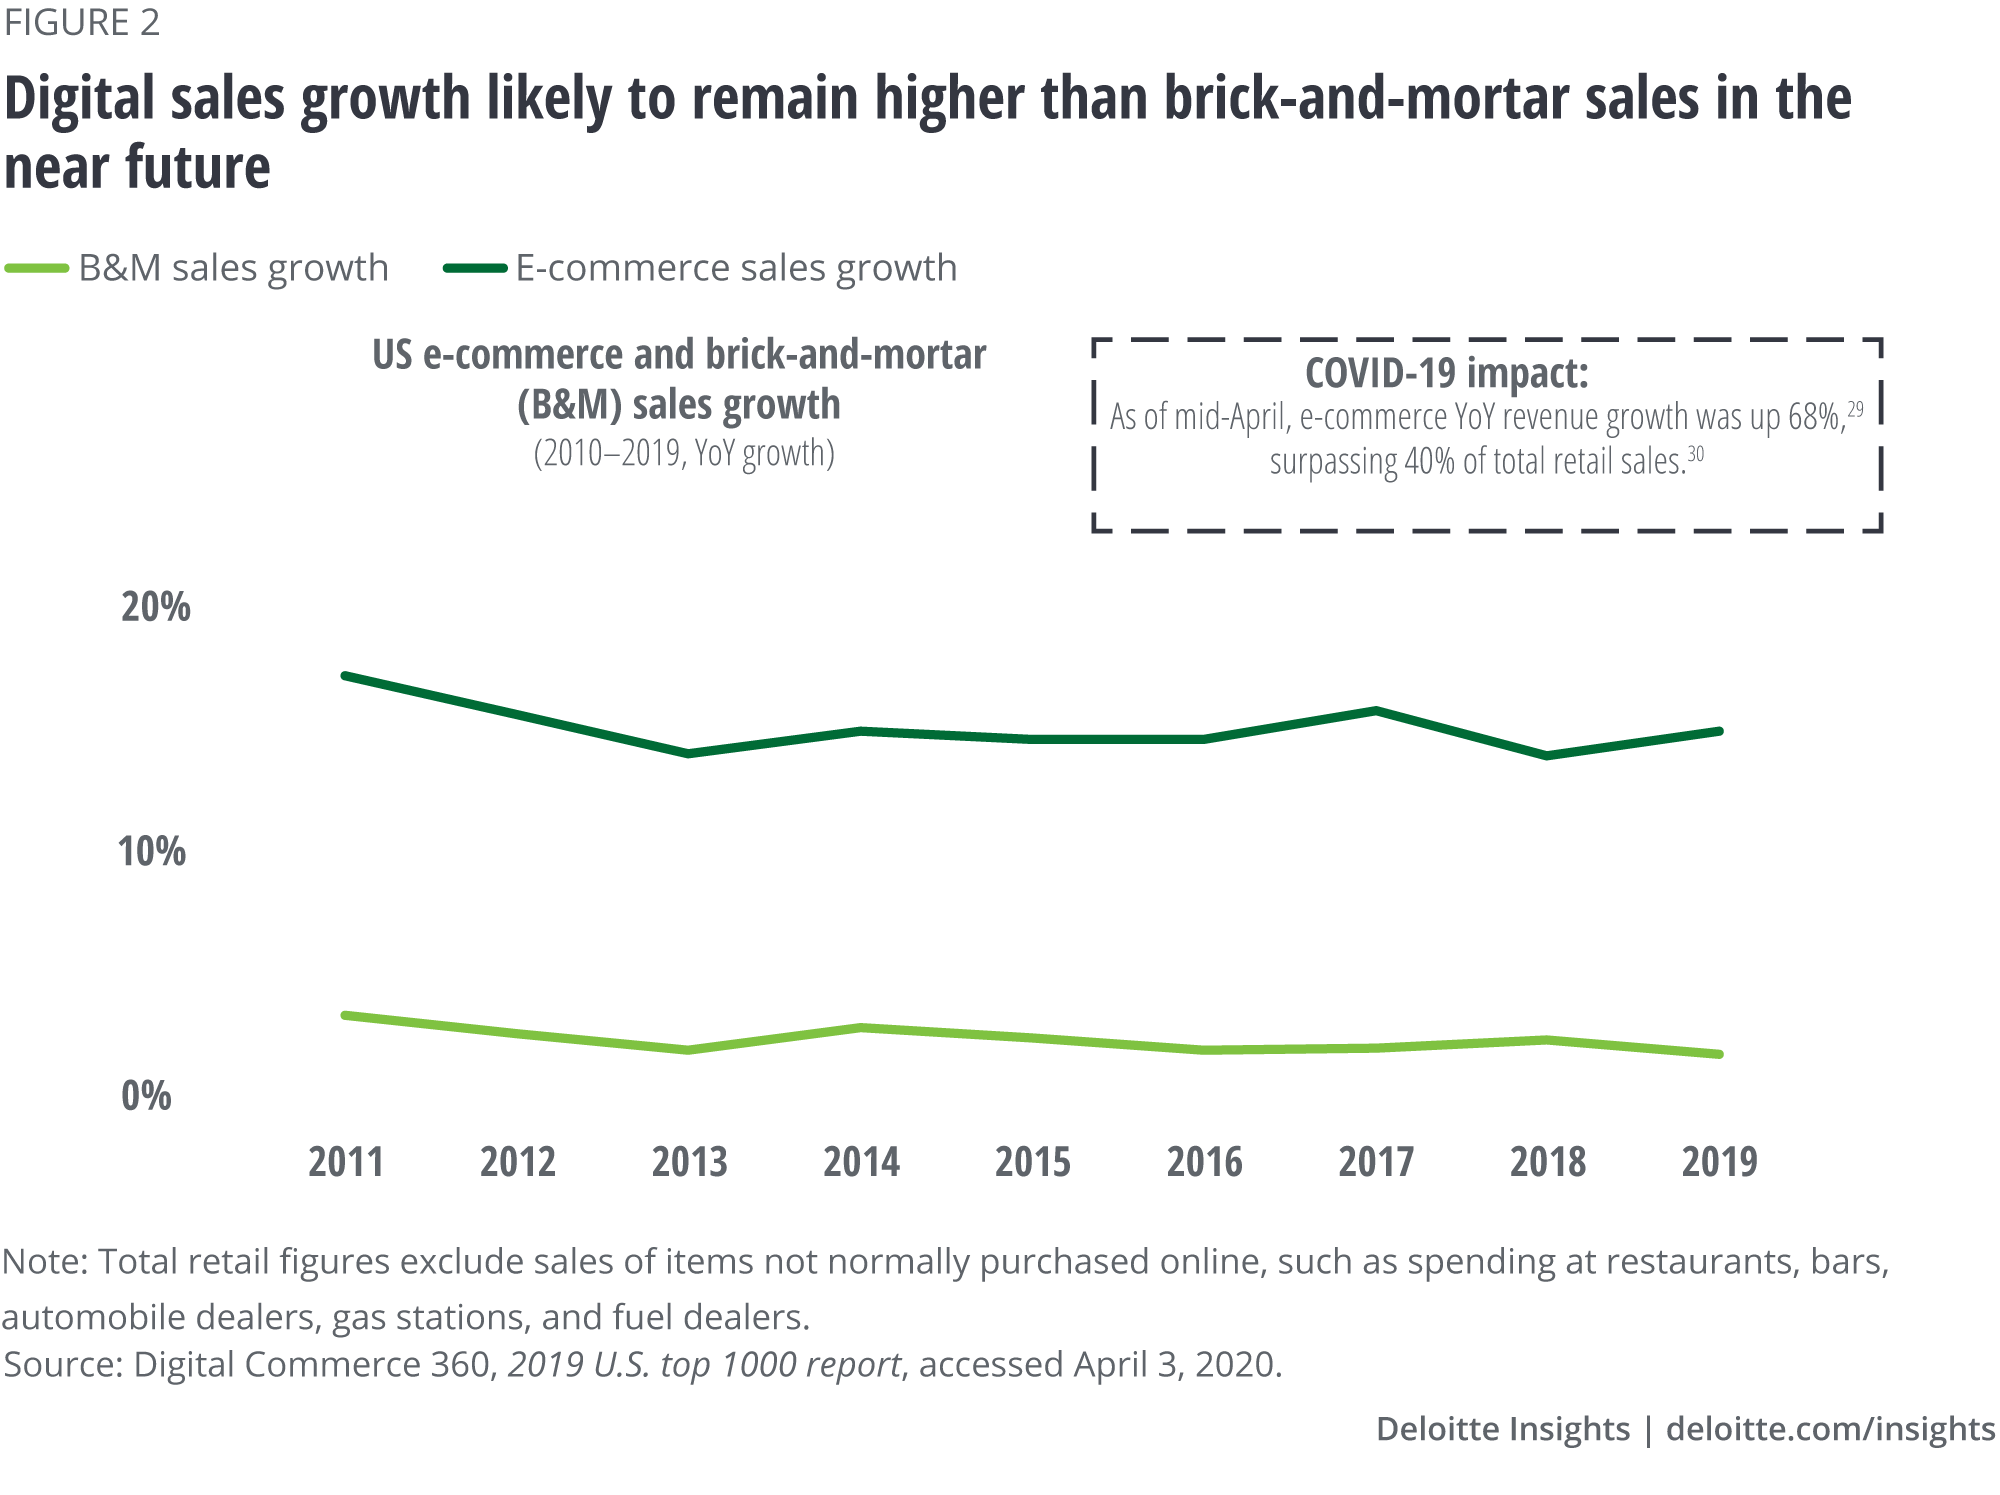
Digital sales, despite comprising only about 15% of total retail sales in 2019 (figure 2), continues to be responsible for an outsized share of total retail sales growth—nearly 50%.23 However, as the base grows larger, the growth rate of digital sales is projected to decelerate.24 That said, the digital sales growth rate will still remain higher than brick-and-mortar sales for the foreseeable future.25 So, in many retail categories, if you aren’t winning in digital, you aren’t winning the battle for growth.
Within digital, a major shift is underway toward mobile. Mobile sales accounted for nearly 75% or US$54 billion of the US$72 billion incremental ecommerce growth in 2019.26 Also, mobile sales, which was just 19% of digital sales in 2014, rose to 45% in 2019,27 growing at a CAGR of roughly 36% over the last six years. This is six times greater than the growth rate of other digital channels (about 6%).28
Mobile sales accounted for nearly 75% or US$54 billion of the US$72 billion incremental ecommerce growth in 2019.
The significant shift to mobile and its influence on in-store sales have had a profoundly negative impact on traditional key business metrics. The conversion and average order value on mobile are significantly lower than desktop (1.7% vs. 4.3% and US$86 vs. US$127, respectively).31 Combining these metrics shows that revenue per visit on mobile is 3.8 times lower than on desktop-based ecommerce.32 This shift significantly reduces the return on investment needed to drive digital growth.
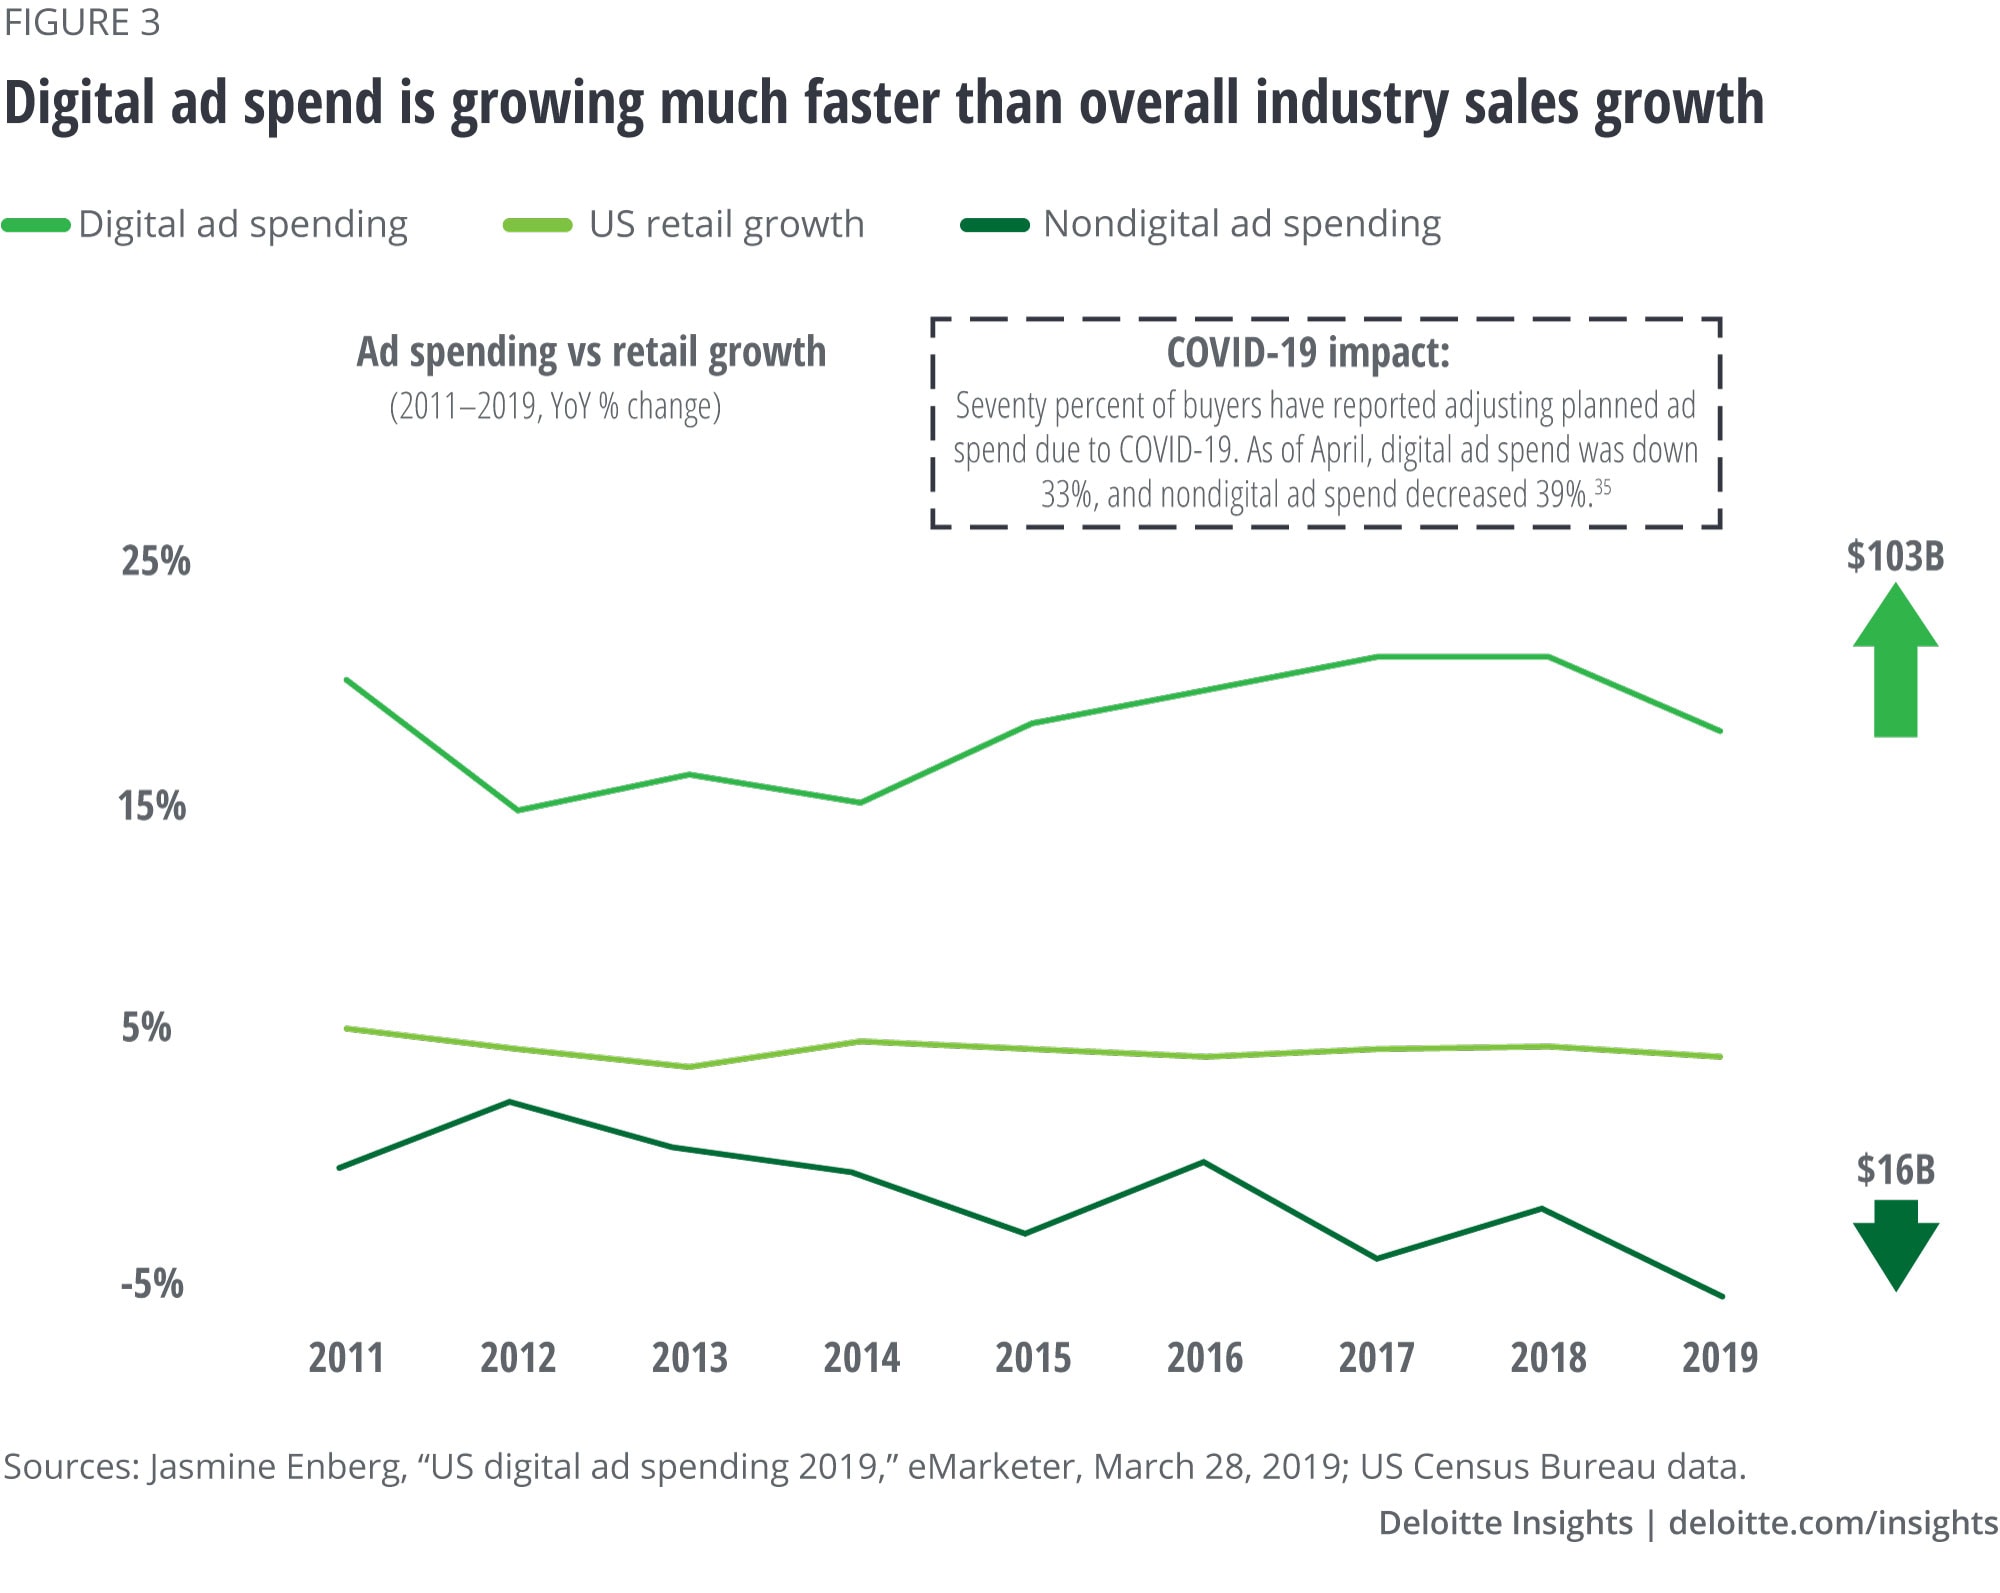
Meanwhile, companies are pouring money into digital advertising. The domain has grown at a CAGR of 20% over the past five years, resulting in a US$103 billion increase in digital ad spend over the past decade.33 But most of this created incremental total ad spend as only US$16 billion of the US$103 billion (about 15%) was offset with a corresponding reduction in nondigital ad spend (figure 3). As a result, total ad spending is growing at a significantly faster rate than overall retail and consumer products industry sales.
In 2019, US advertisers will spend US$129.34 billion, or 54.2% of their media ad budgets, on digital ads. By 2023, this figure is estimated to reach 66.8%.34
Digital ad spending per consumer is also skyrocketing. Digital ad spend per internet user has tripled in the last nine years, increasing from US$138 to US$456 since 2011.36 Over that same period, TV ad spend per viewer has increased by about 22%. Further, the increase in ad spend is not just a function of the number of ads as digital ad cost is also up 12% on average across channels and is rising five times faster than inflation.37
The rise of social media has added a layer of incremental complexity to digital success. Although social has not yet become a mass channel for transactions (generating less than 1% of US retail sales in 2019 ), it is becoming increasingly more important as a source of digital traffic, roughly tripling from 3.1% of referrals in 2016 to 9.1% in 2019.38 However, social has a lower conversion rate (1%)39 compared to other digital channels (2.5%), and social spending per hour per consumer (US$0.42) is double that of the average digital spend per hour per consumer (US$0.21).40 Social’s rising prevalence requires investment but it has a low return on investment, creating even more pressure on profitability.
If the growing cost of digital advertising were matched by commensurate sales growth, then higher digital ad spend would pose no problem. But the reality is quite different: While digital spending is becoming more expensive, it is generally not becoming more effective. For example, even though advertisers have increased their total spending on search by 42%, the number of visits to advertisers’ websites resulting from those ads has increased by just 11%, indicating that the cost of driving traffic is increasing and further impacting margins.41
To make matters more difficult, the rising variable costs of shipping and higher warehouse labor costs are putting profound pressure on overall margins. In many ways, the shift to digital commerce is a move from a higher fixed-cost model (where stores are the major fixed-cost component) to a higher variable-cost model (where each order comes with incremental shipping and fulfillment costs).
While digital spending is becoming more expensive, it is not becoming more effective.
In addition to costs increasing due to the rising volume of orders being shipped, the cost of shipping is increasing in absolute terms as well. Between 2010 and 2020, ground shipping rates of major carriers increased 75.8%, while air shipping rates soared by 80%.42
Besides shipping, labor is also eating into margins with demand rising for workers to fulfill digital orders, and RCP companies have been hit with higher warehouse labor costs. The mean hourly labor wage for transportation and materials moving is about 10% higher than retail sales wages.43 Further, since 2014, warehouse wages have climbed by 22.6% and are expected to continue to rise, as workers are in short supply and high demand.44
Takeaway: The increased demand for digital advertising is resulting in increased costs for companies to drive traffic and engage with and acquire customers. Coupled with the incremental—and rising—costs of shipping and labor in fulfillment, companies are experiencing a deterioration in already thin (or even nonexistent) margins for digital sales. The net effect is that while the allure of digital growth remains strong, the ability to profitably pursue and satisfy that growth remains under tremendous—and ever-growing—pressure.
Trend 3: Brick and mortar becomes smaller and closer
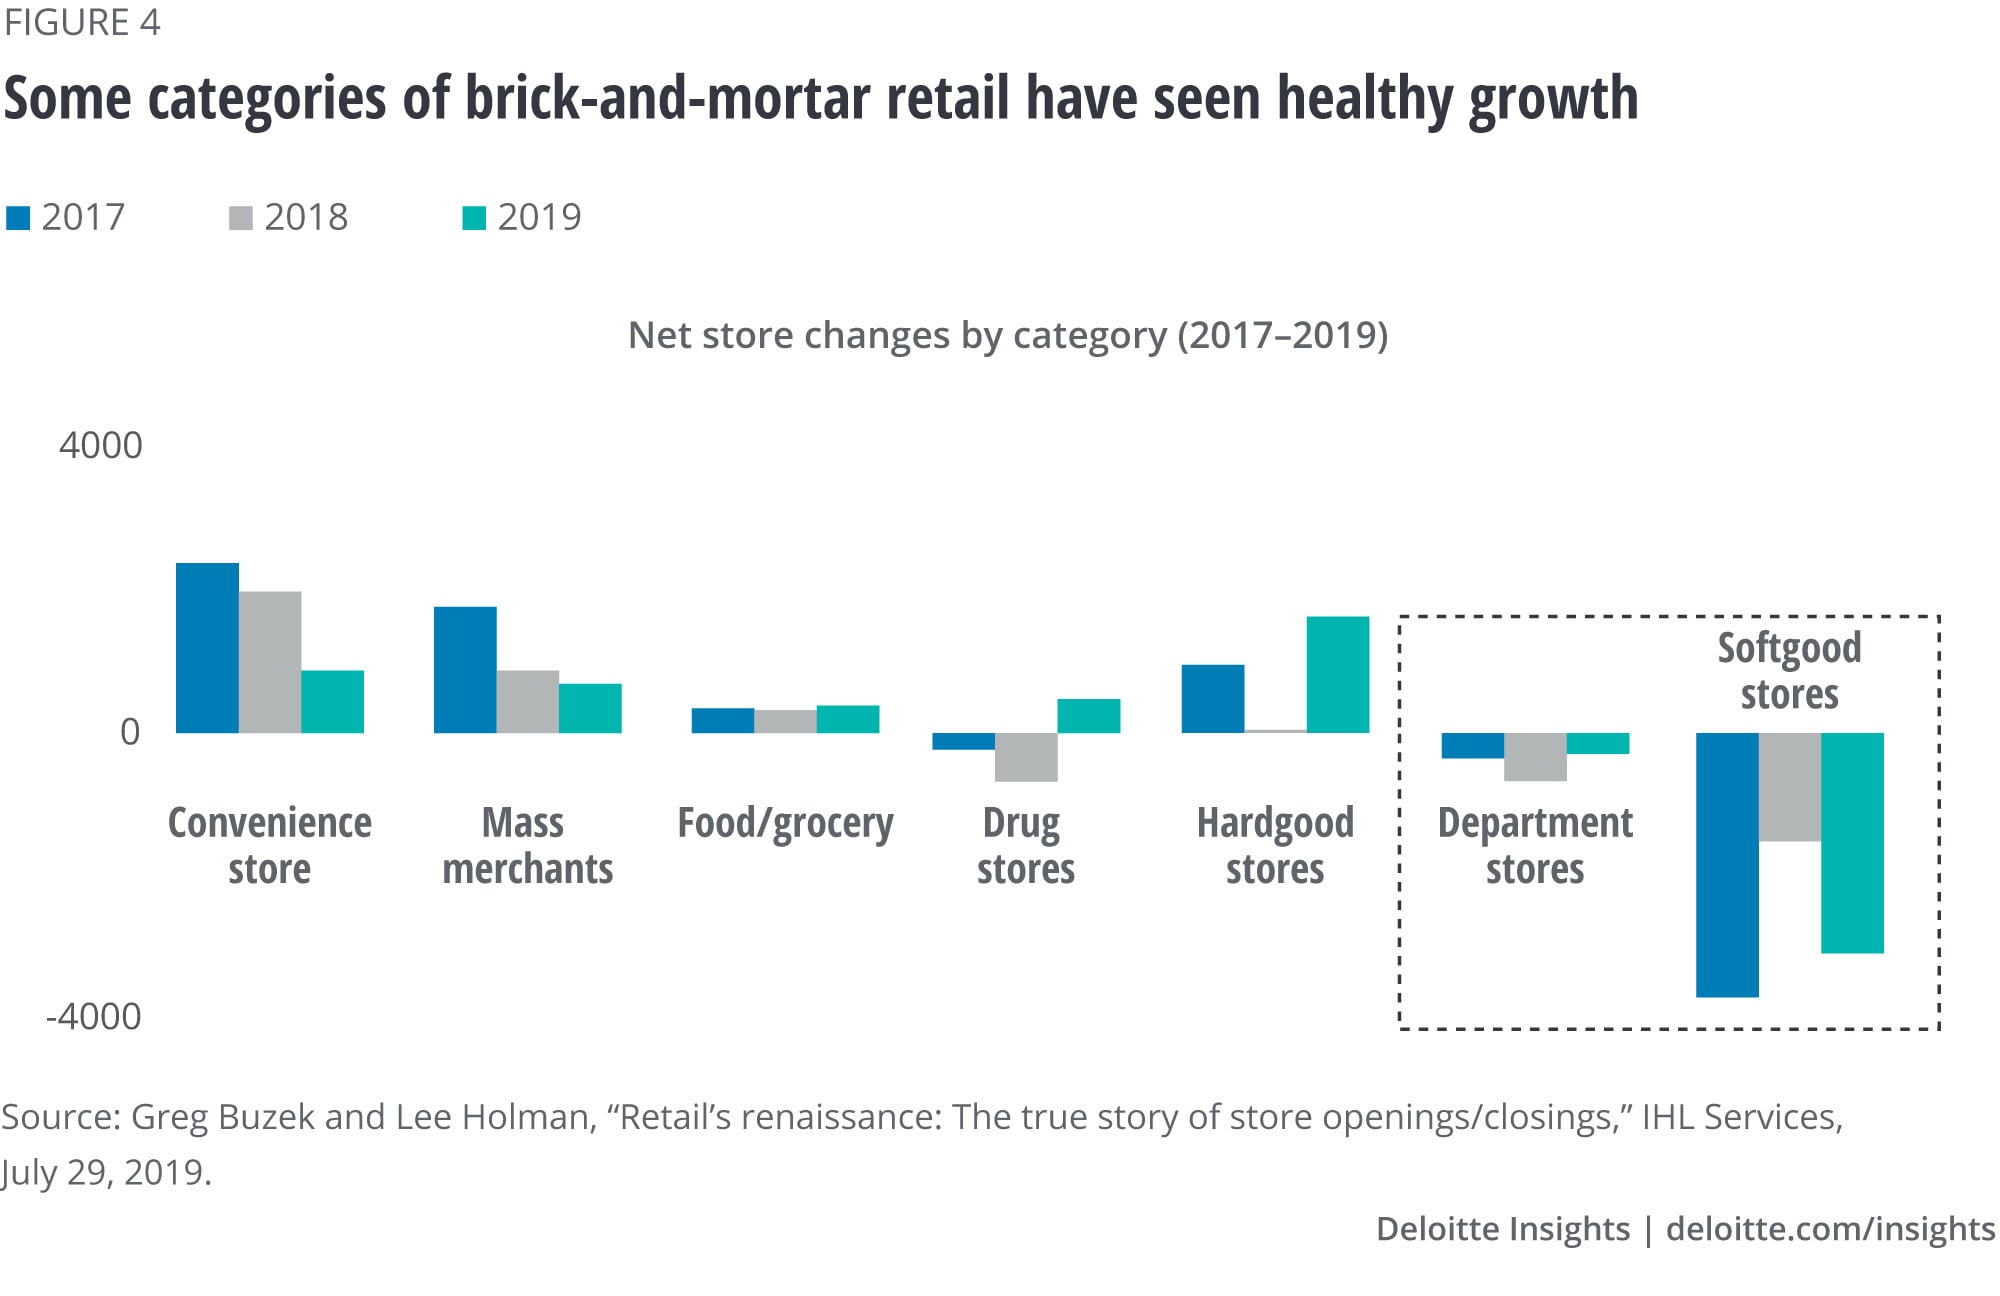
Much has been written about store closures over the past decade. While there’s certainly been weakness in some retailers and formats, the reality is that brick-and-mortar retail is not dead. As of 2019, stores still accounted for 85% of retail sales,47 and we can even see healthy growth in some categories (figure 4). COVID-19 further demonstrated the importance of the physical store, with many brands and retailers experiencing significant revenue loss from the temporary closure of stores.
While the store count has increased in the past 10 years from 244,000 stores to 270,000 stores, square footage at US retail stores has dropped by 4.4% (figure 5). The growth of small-format stores such as convenience, drug, and dollar stores has been a driving force in the long-term decline in store sizes.48
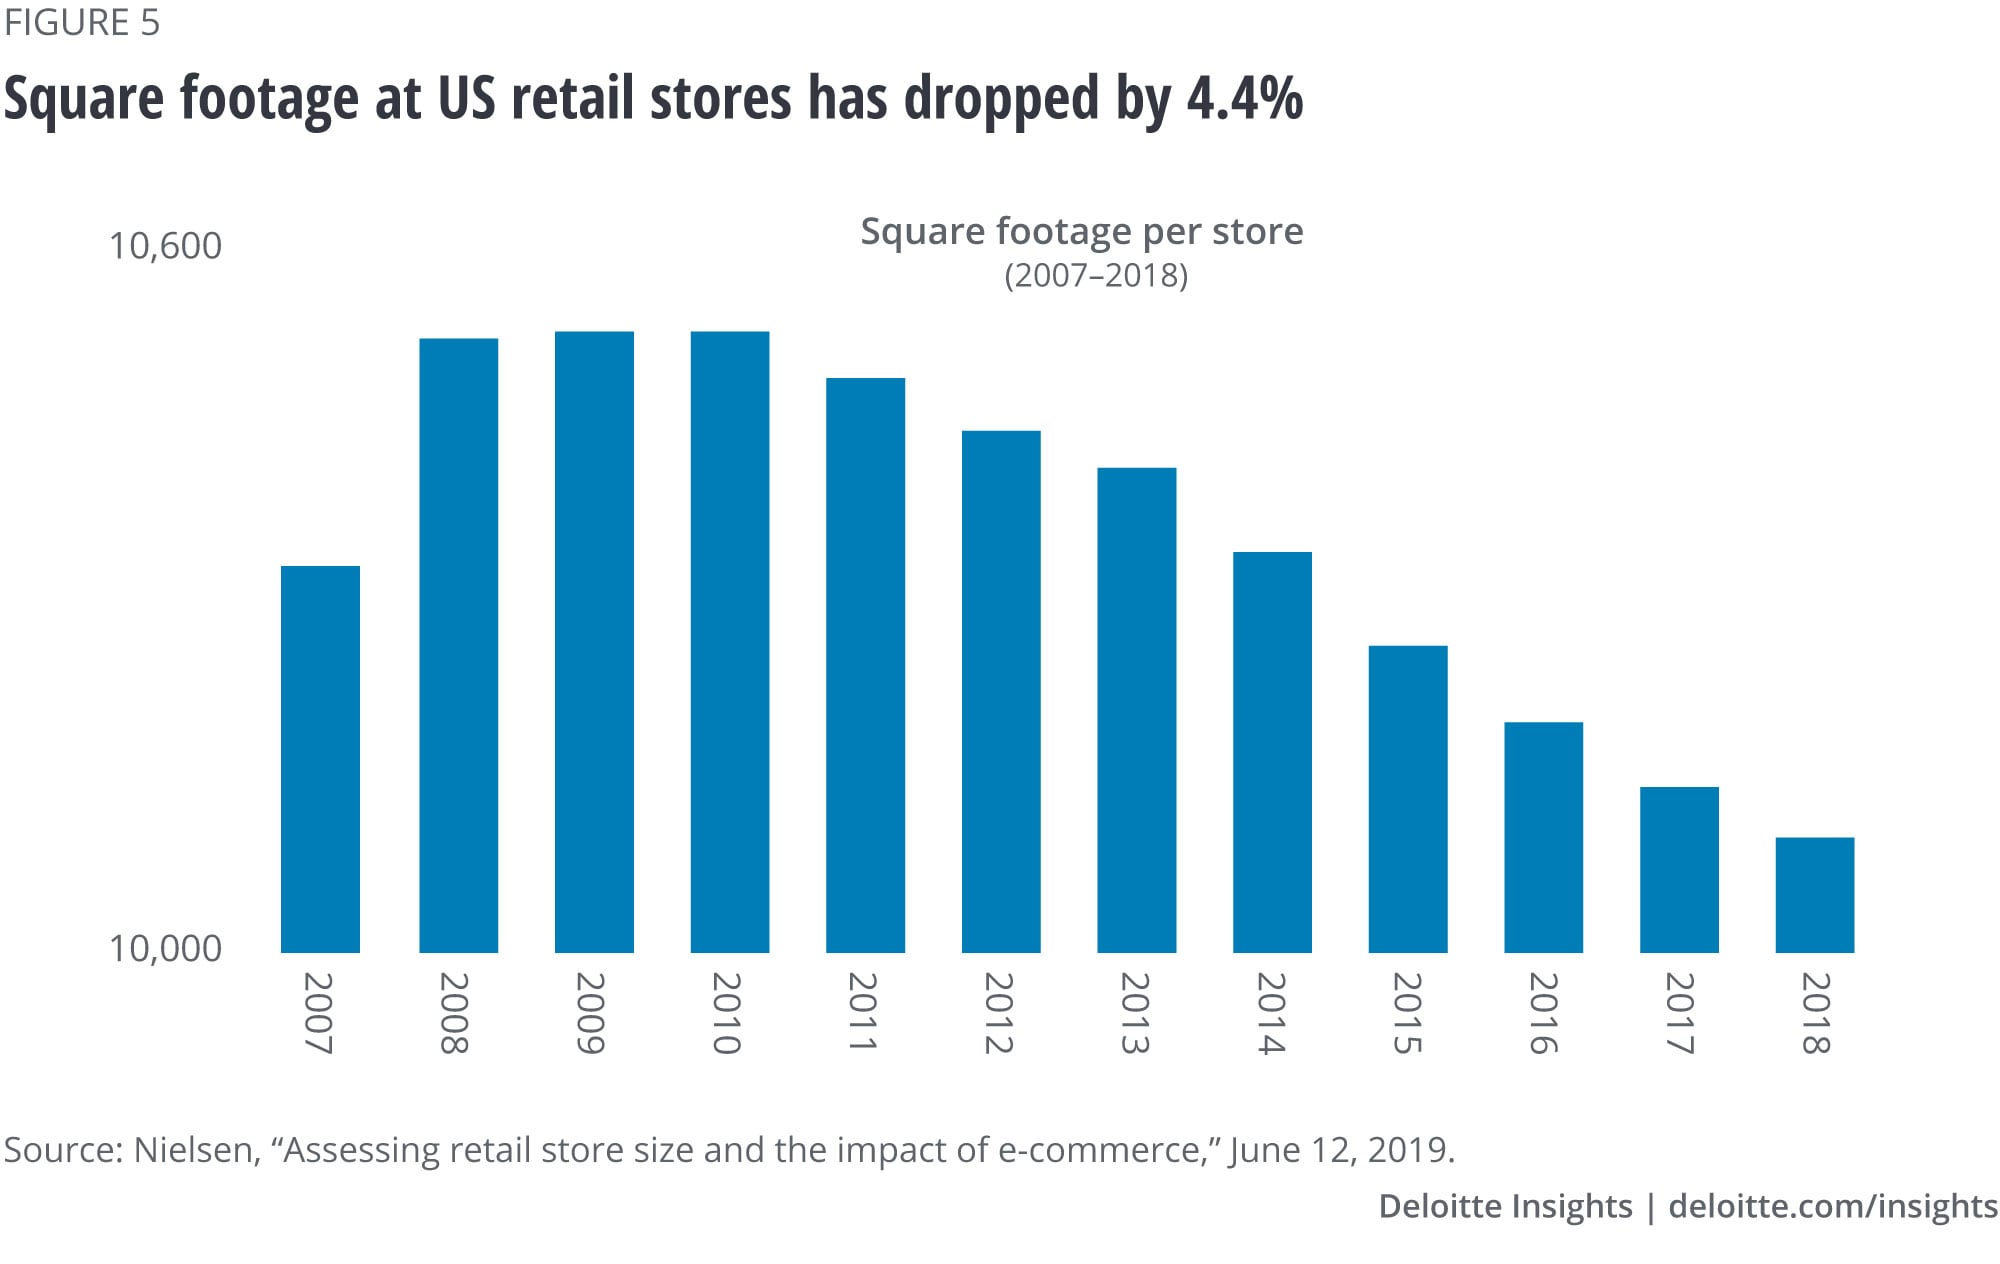
The vast majority of stores that opened in the last 10 years were dollar stores (46%), convenience stores (25%), and drug stores (16%).49 One common trend among these smaller stores is that they’re moving closer—both in terms of location and inventories—to the consumer.
But this doesn’t mean warehouse clubs and mass-merchant stores have become passé. These traditional big box retailers are also unleashing their own small-store formats and making themselves more accessible to consumers.50 And while the mass-merchant retailers accounted for only 5% of store openings in the past 10 years, they have been massive drivers of retail sales, which grew by 9% between 2017 and 2019.51 In both small and big format, there is one commonly overlooked value proposition that’s not in line with the predictions on “showrooming”—that these retailers are actually deploying products closer to the consumer.
Perhaps surprisingly, e-commerce has helped propel the evolving role of physical stores in bringing inventory closer to the end customer. In-store fulfillment of online sales drove one-third of e-commerce growth between 2015 and 2019 and has quadrupled in the past five years.52
Takeaway: Physical retail stores are not dead, but they are certainly changing. They’re getting smaller and coming closer to the consumer. However, it would be shortsighted to only consider the size and location of the stores without analyzing their role. A major value proposition of both big and small successful retailers is their ability to position inventory close to the consumer and become accessible both physically and digitally through stores.
Trend 4: New models, growing impact
Retailers and consumer products competitors continue to expand outside of their traditional revenue models to accelerate growth and meet the changing consumer. Direct-to-consumer, food service alternatives, subscription services rentals, marketplaces, and resale are all growing in popularity to drive new revenue streams.
These new models, in aggregate, are creating significant disruption for RCP companies by amassing material market share.
For instance, as of 2019, as food-away-from-home expenditures surpasses food-at-home expenditures,55 nontraditional models such as ghost kitchens and food delivery are accelerating. Ghost kitchens and virtual restaurants are expected to grow at a 17.2% CAGR through 2026,56 while food delivery growth is expected to hit US$23.4 billion, with 8.7% growth in the United States by 2020.57
This goes beyond just the food sector, with the growing number of “direct-to-consumer” (DTC) brands estimated at around 400 today, and rising.58 Online trends suggest web traffic for these DTC brands has roughly doubled, while advertising has increased by 50% over the past year.59 Meanwhile, the total revenue for subscription businesses grew about five times faster than US retail sales (18.1% versus 3.8%) from 2012 to 2019.60 In apparel, secondhand market resale grew at 15.6% CAGR for the past three years, with more than 1,000 outlets—both pure digital and now traditional retailers—now offering rental services.61
By no means are these alternative business models exclusively attributed or limited to certain sectors or products. They are a broad industry reality, impacting retail and consumer products—from grocery to apparel and from pet food to beverages.
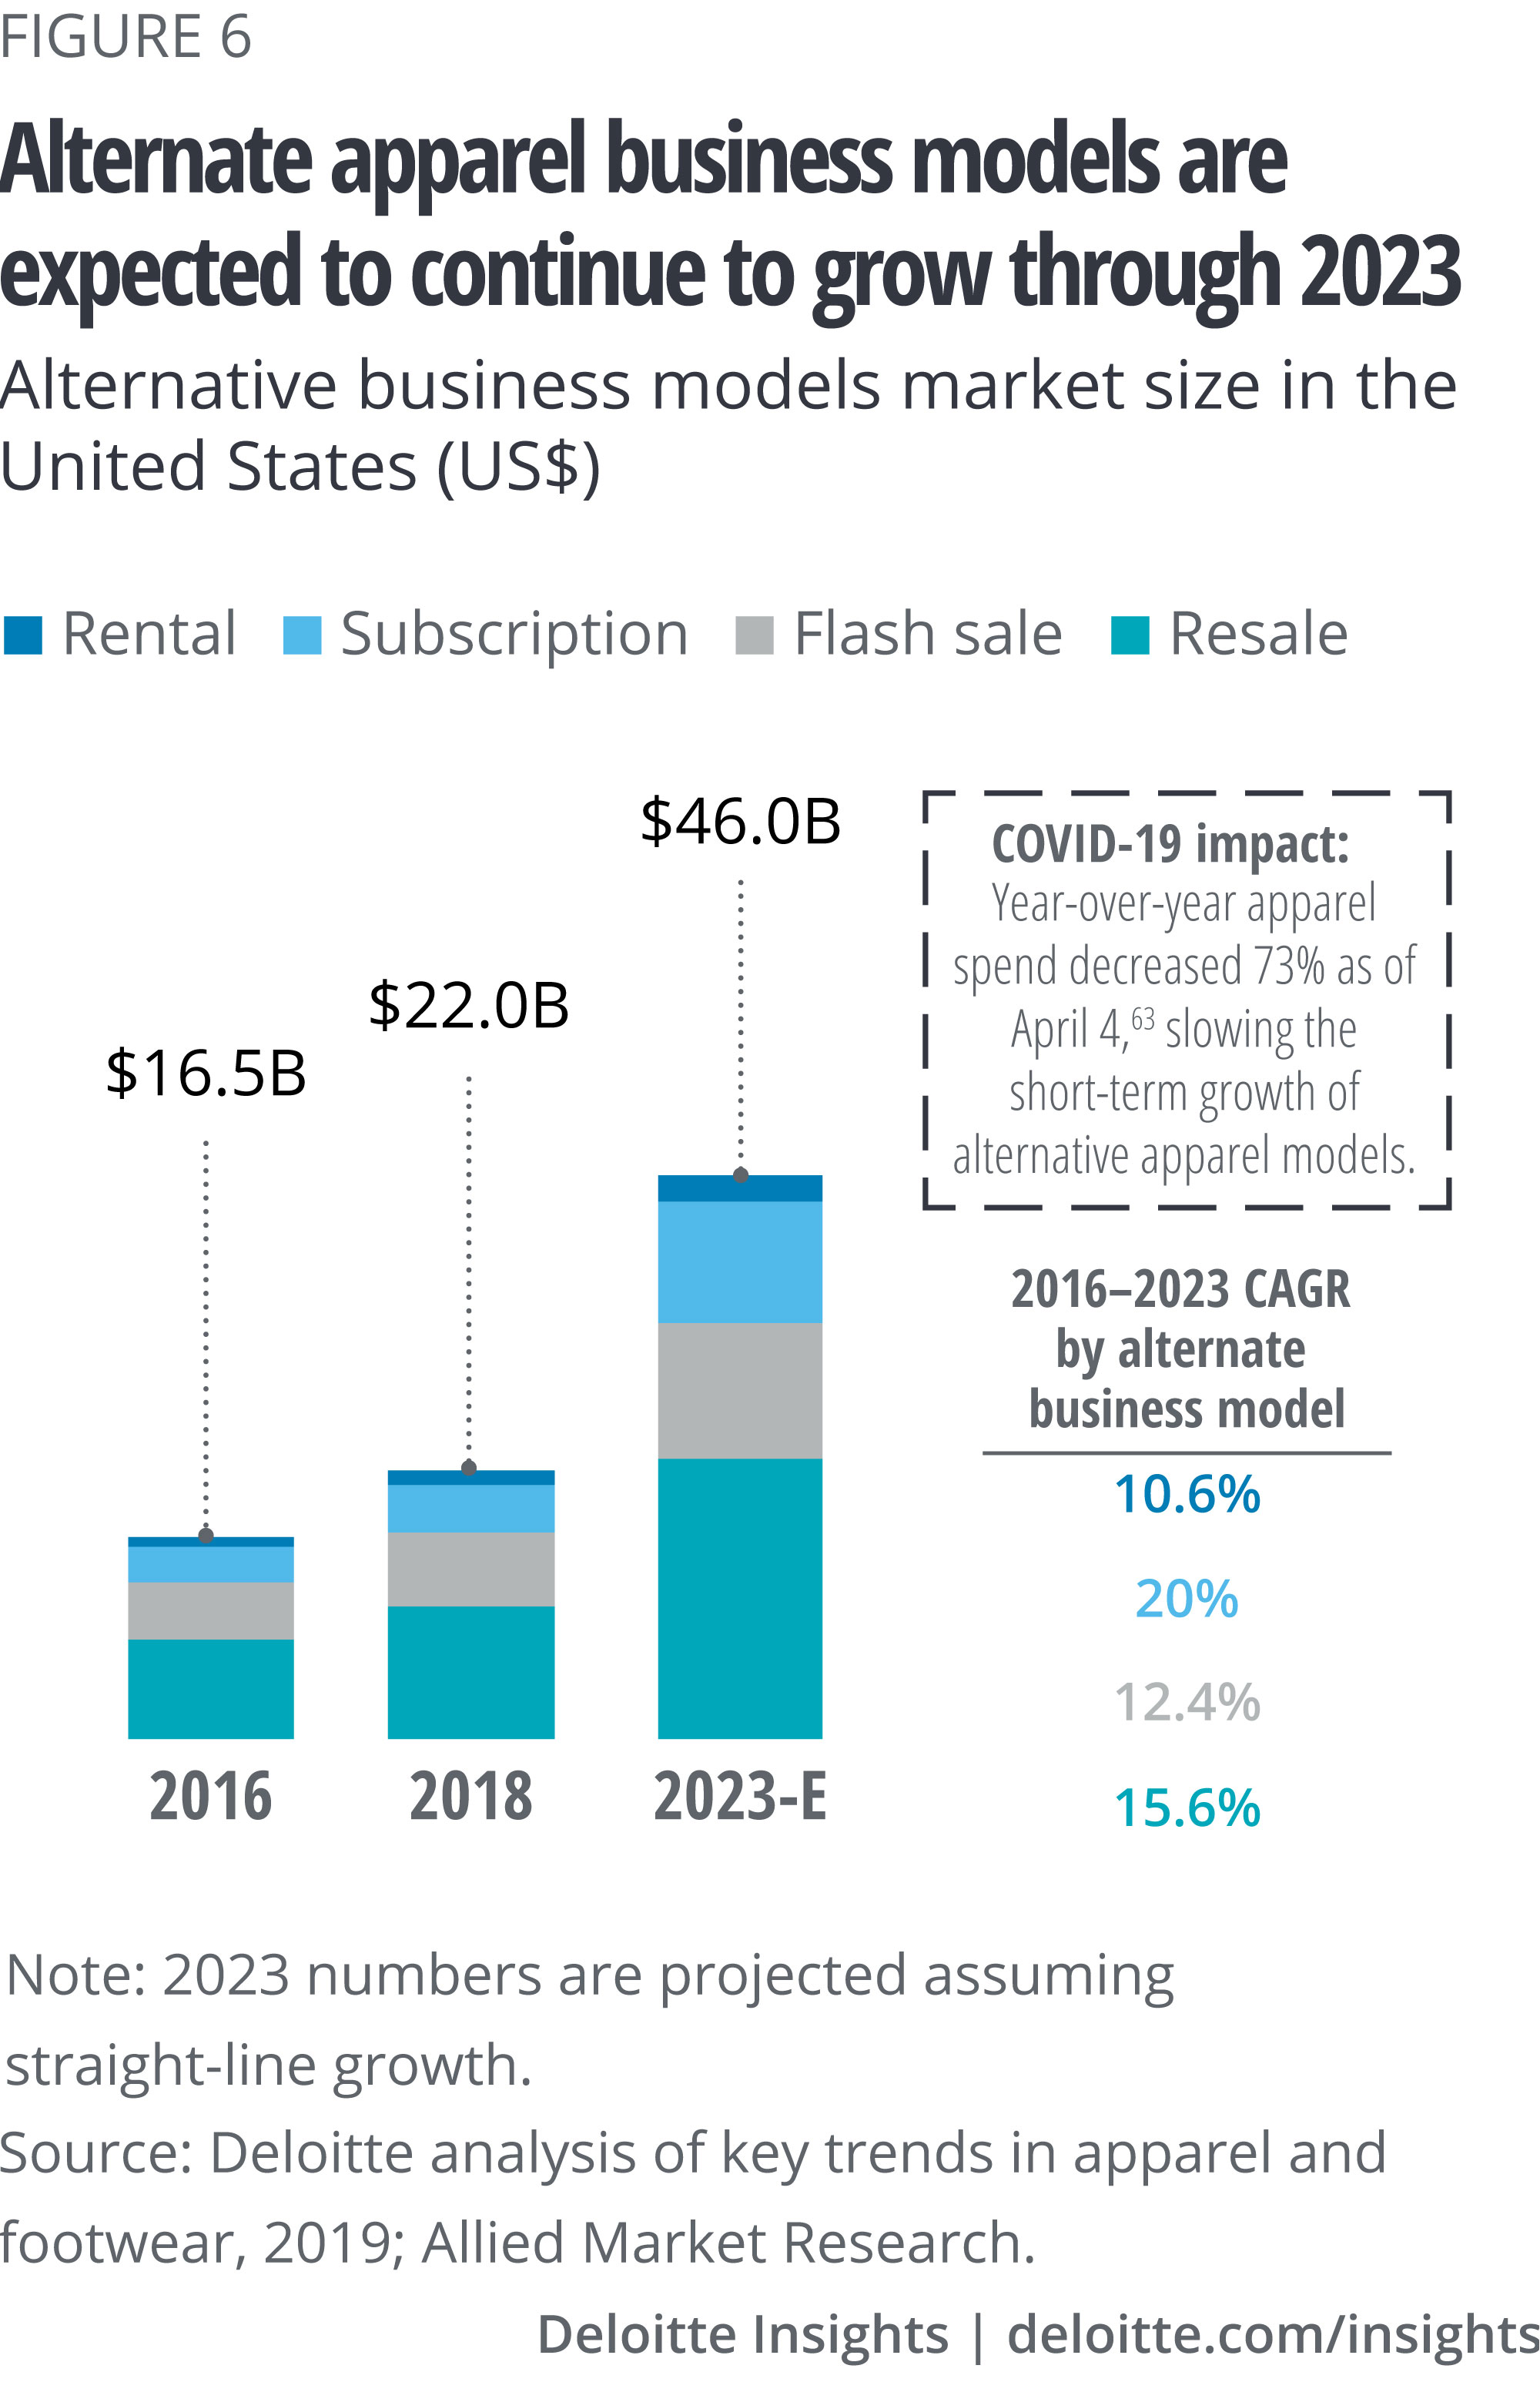
When viewed individually, these new models and companies still have a small share of overall category sales within the industry. Further, each individual company’s ability to survive may be in question. However, in aggregate, these models are creating significant disruption for incumbent retail and consumer products companies by amassing material market share. For example, the combined alternative business models in apparel (such as rental, resale, subscription, and flash sales) gained 1.4% of incremental market share between 2016 and 2018 (figure 6); they are projected to continue to amass an additional 1% of US apparel market share annually each year through 2023.62
Takeaway: Individually, new models may seem like insignificant specks in the sea of traditional business models, and it is unclear which models are going to be fully viable and successful in the future. However, the aggregation of new models is collectively gaining ground, accelerating, and becoming a much bigger and more material competitor for market share—and RCP companies need to pay attention to this trend.
Trend 5: Convenience as the new battleground
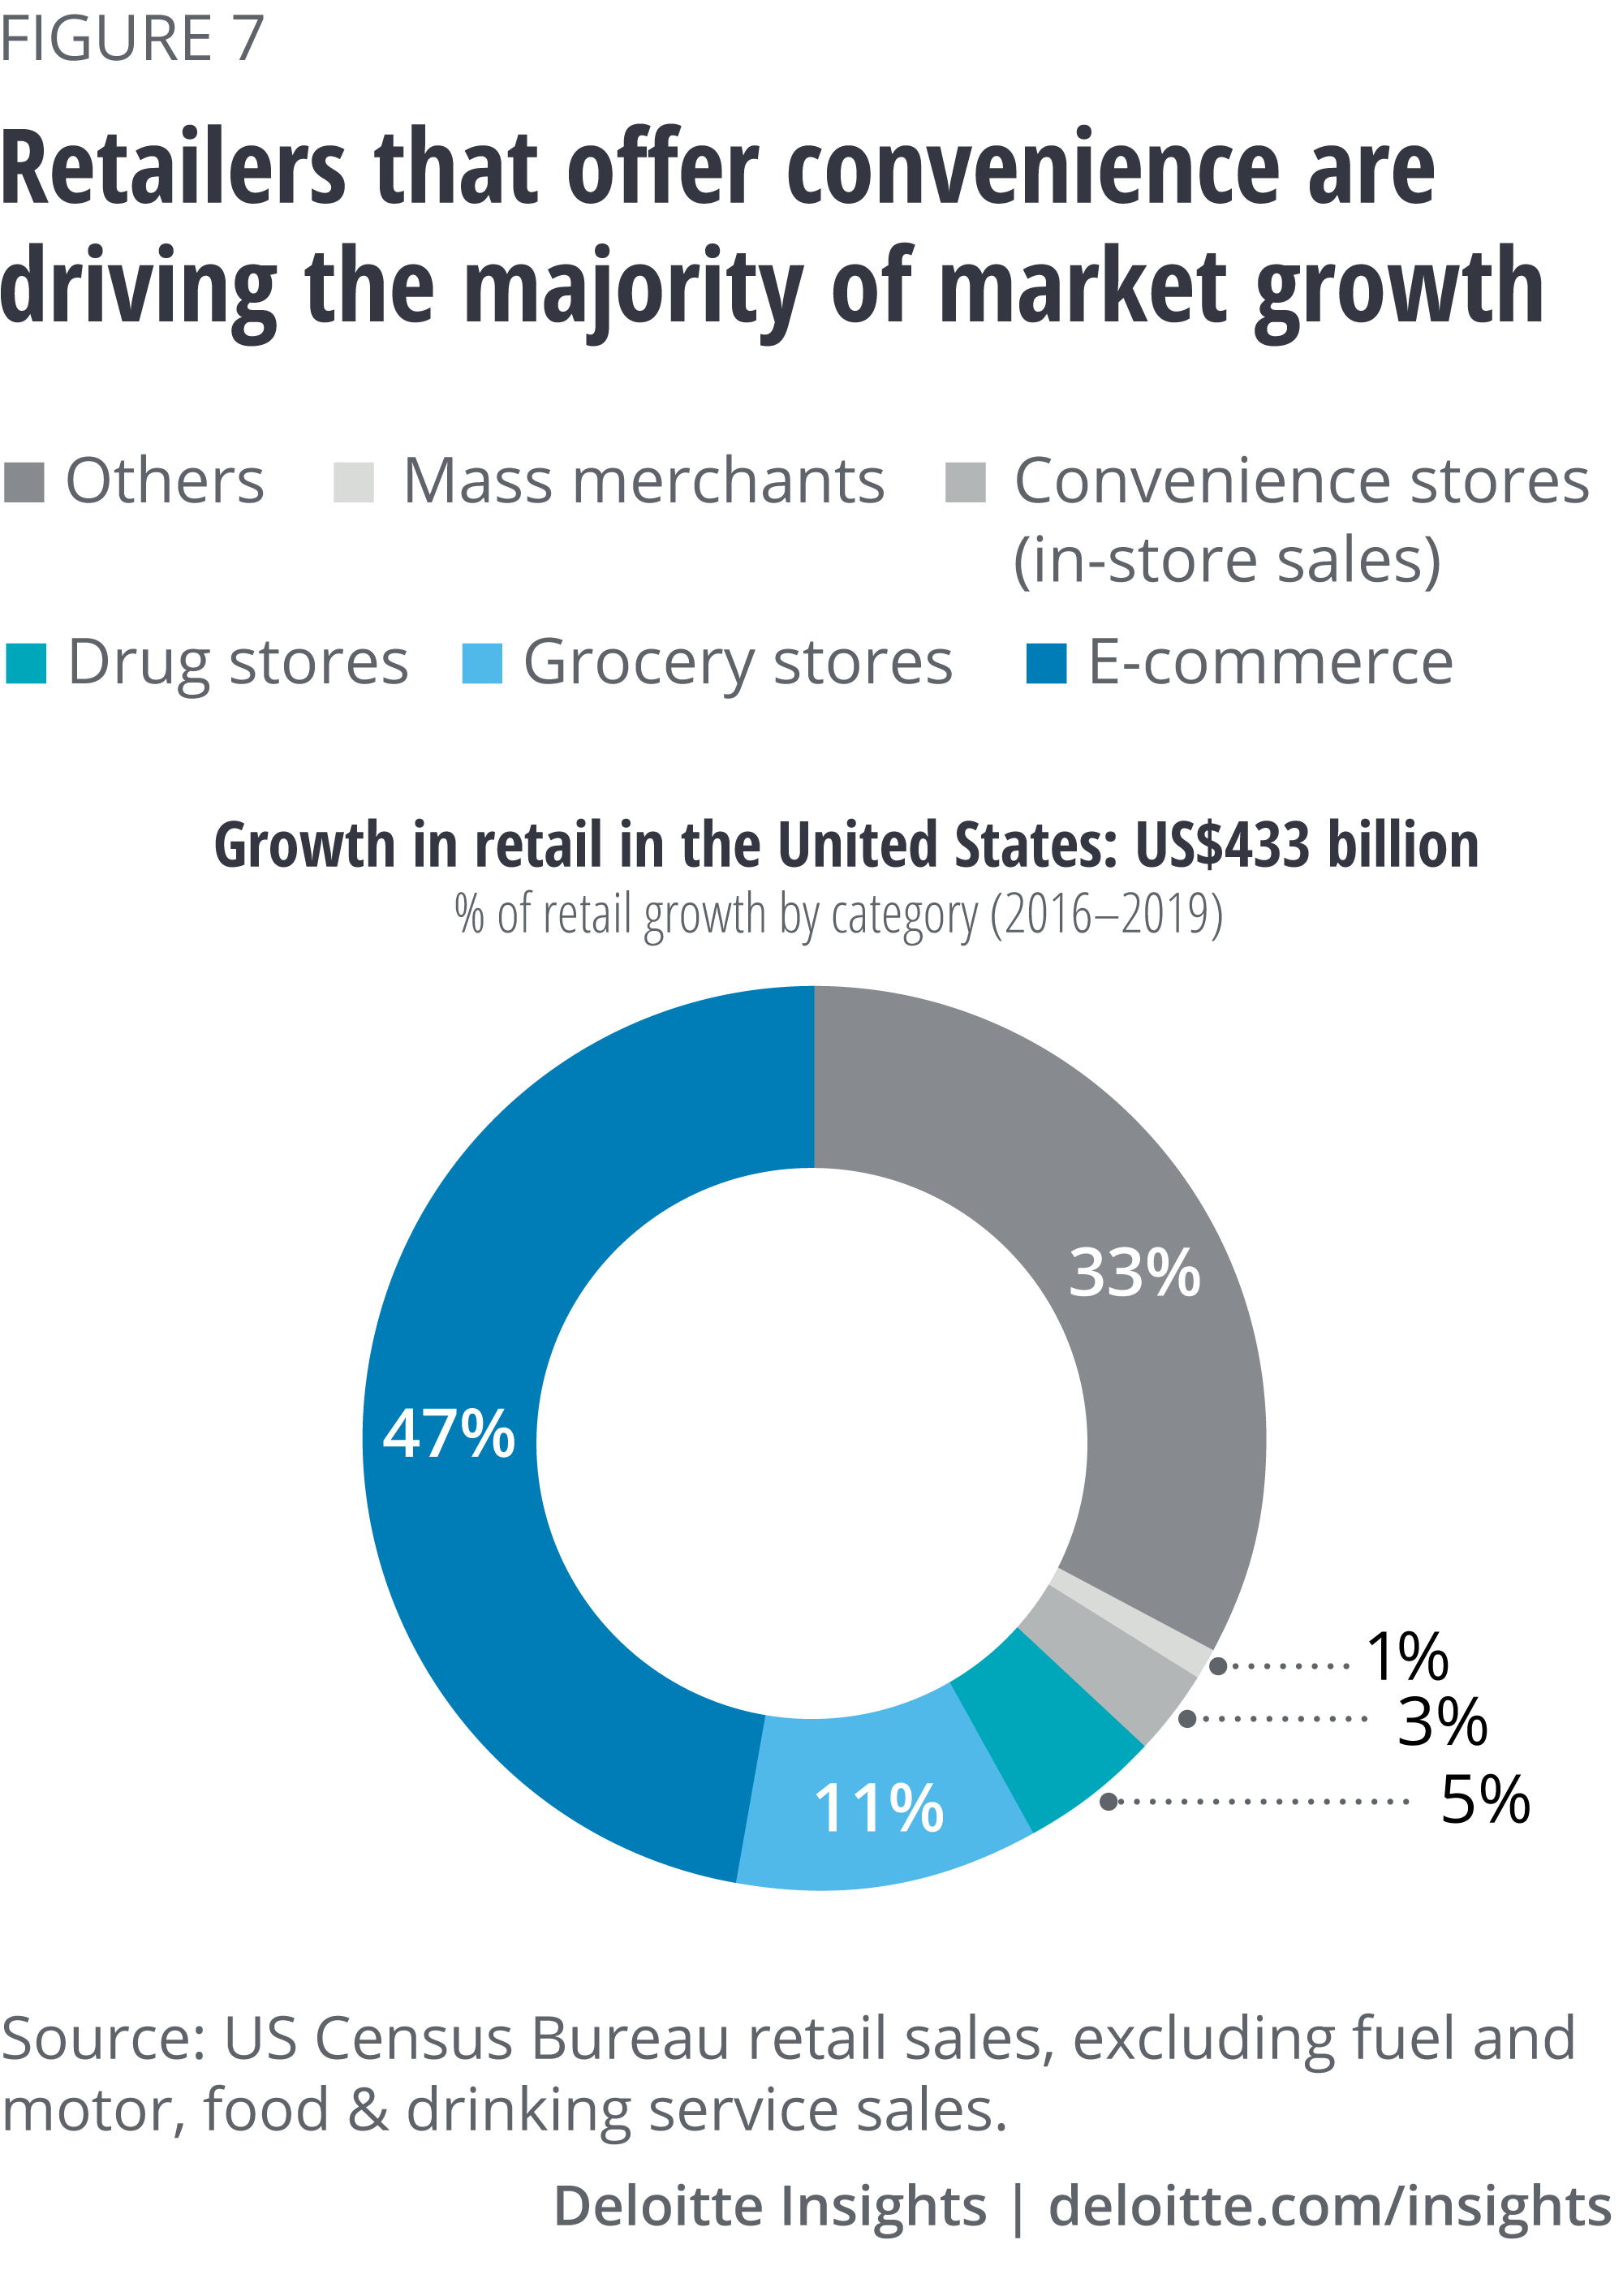
Despite the buzz around “experiential” retail, in our study of the RCP market, we found that it’s not “retail-as-theater” that’s driving the majority of growth in the market (figure 7). Instead, it’s the retailers that offer convenience that are driving the maximum market growth, as nine out of 10 consumers said they’re more likely to choose a retailer based on convenience.67 We estimate that in 2016–2019, retailers offering convenience as a major component of their value proposition drove 67% of total market growth.
In particular, US convenience stores, with 153,000 stores serving 165 million customers daily, saw a 16th straight year of record in-store sales (excluding fuel and gas), growing at 1.8% CAGR to achieve US$242 billion in sales.68 This growth was seen in store footprints as well—for each convenience store chain that had a net closing of stores, there were 30 convenience store chains that saw net openings of stores in 2019.69 A net increase of 5,230 stores over the past three years shows the importance of growing the retail footprint to ensure accessibility to customers; 93% of urban shoppers and 86% of rural shoppers have a convenience store located within 10 minutes of their homes.70
Although as of 2019, consumers still made over 85% of their purchases at brick and mortar, e-commerce-only companies had driven approximately 47% of the incremental growth in retail spend of the past three years.71 And convenience is the main factor driving online growth: It is the primary reason 43% of US consumers make purchases online.72 Consumers said it is the No. 1 reason they shop with the largest online retailer—that commands 37% of digital sales in the United States.73
Consumer preference for convenience is fairly consistent across all retail segments; it is the primary reason 43% of US consumers make purchases online.
Among all product categories, grocery has risen to the forefront as the most desired area for convenience, as 63% of consumers find it very important when it comes to selecting a grocery option.74 However, consumer preference for convenience appears to be fairly consistent across all retail segments,75 and retailers offering and prioritizing convenience as a major component of their strategy have largely driven incremental growth in the market.
Takeaway: While many espouse the “experiential” aspects of store retailing, winning in convenience seems to be more important for growth in retail. As retailers continue to raise the bar for convenience, consumer expectations are likely to grow as a result. A retailer does not need to exemplify every aspect of convenience to be considered as “convenient.” But in building a strategy, it appears to be critical to understand the target consumer and the type of convenience your consumer craves.
Trend 6: Health and sustainability … for some
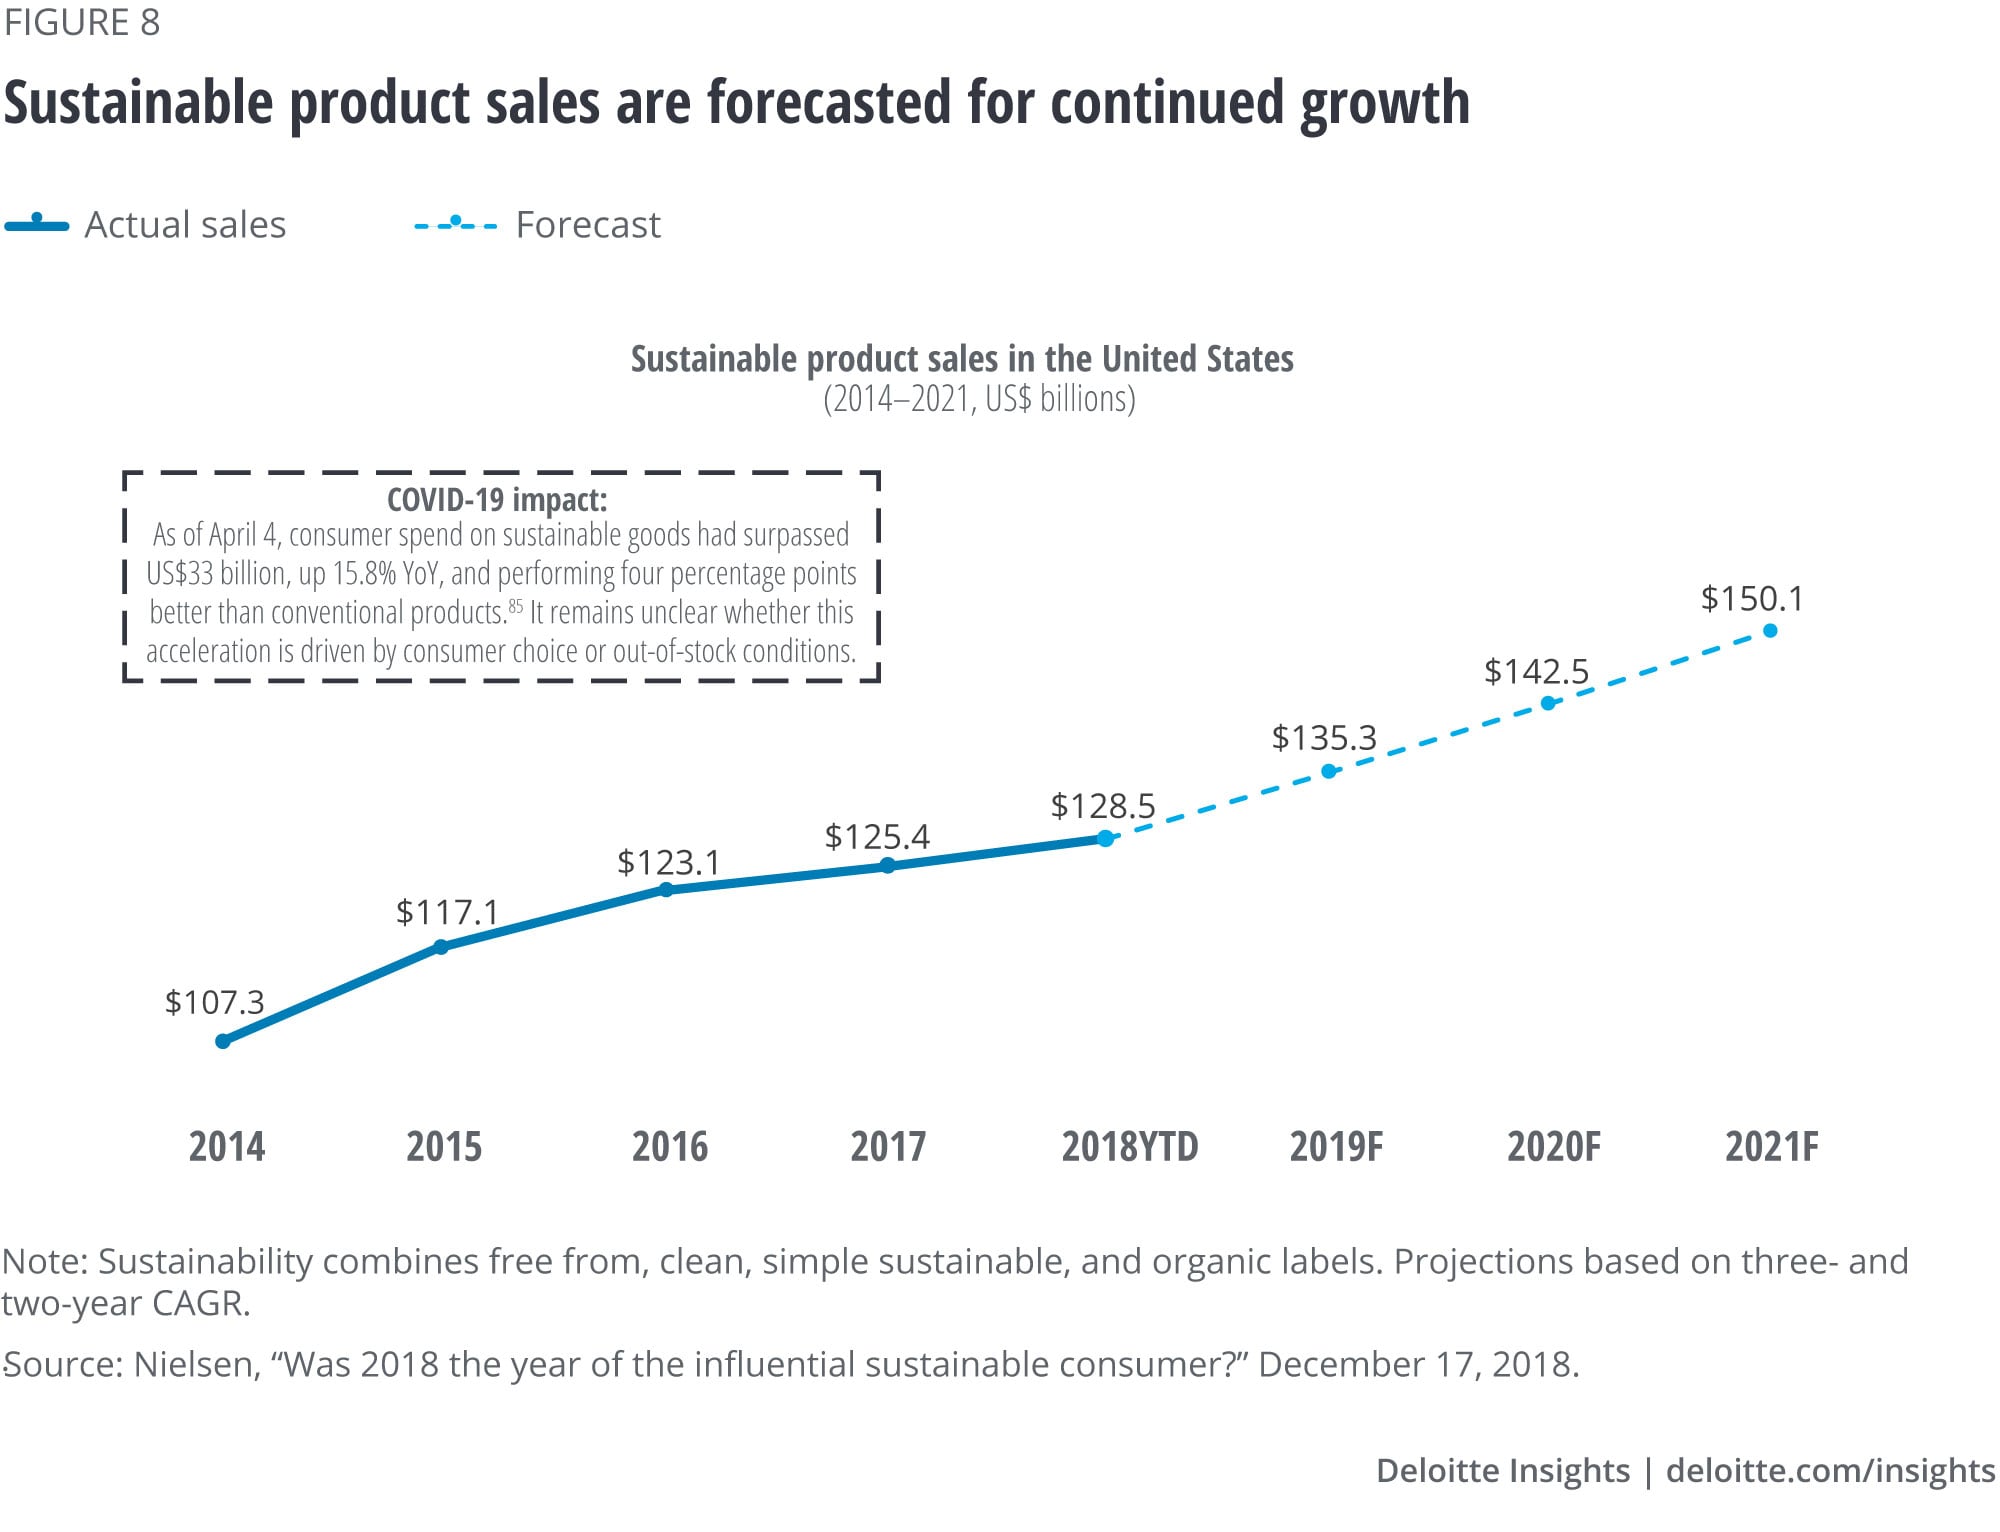
The terms “health consciousness” and “sustainable” have been gaining momentum among consumers, product marketers, and retailers over the past decade. Consequently, the market for sustainable and health-focused products has been growing at an unprecedented rate (figure 8). It contributed nearly 50% of total consumer products sales growth between 2013 and 2018, at a CAGR of 5.2%, four times that of conventional product sales.80
However, despite such healthy growth rates, these goods only account for 17% of the overall market.81 And research shows that these products tend to be more expensive than their conventional counterparts.82 Digging deeper, we can see economics playing a critical role in consumer purchasing behavior for healthy and sustainable products.
Data shows that high-income consumers spend roughly three times more of their disposable income dollars on food-related expenses than low-income consumers. This is due to the underlying economics: Though they may spend more on food items, high-income consumers devote a significantly lower percentage of their disposable income to food expenses vs. low-income consumers—8% vs. 35%, respectively (figure 9).83 Therefore, it’s no stretch to say products marketed as “healthy” or “sustainable”—putting aside the question of whether the labels are factually accurate in absolute terms—tend to market to higher-income consumers who have the means to spend more on such products.84
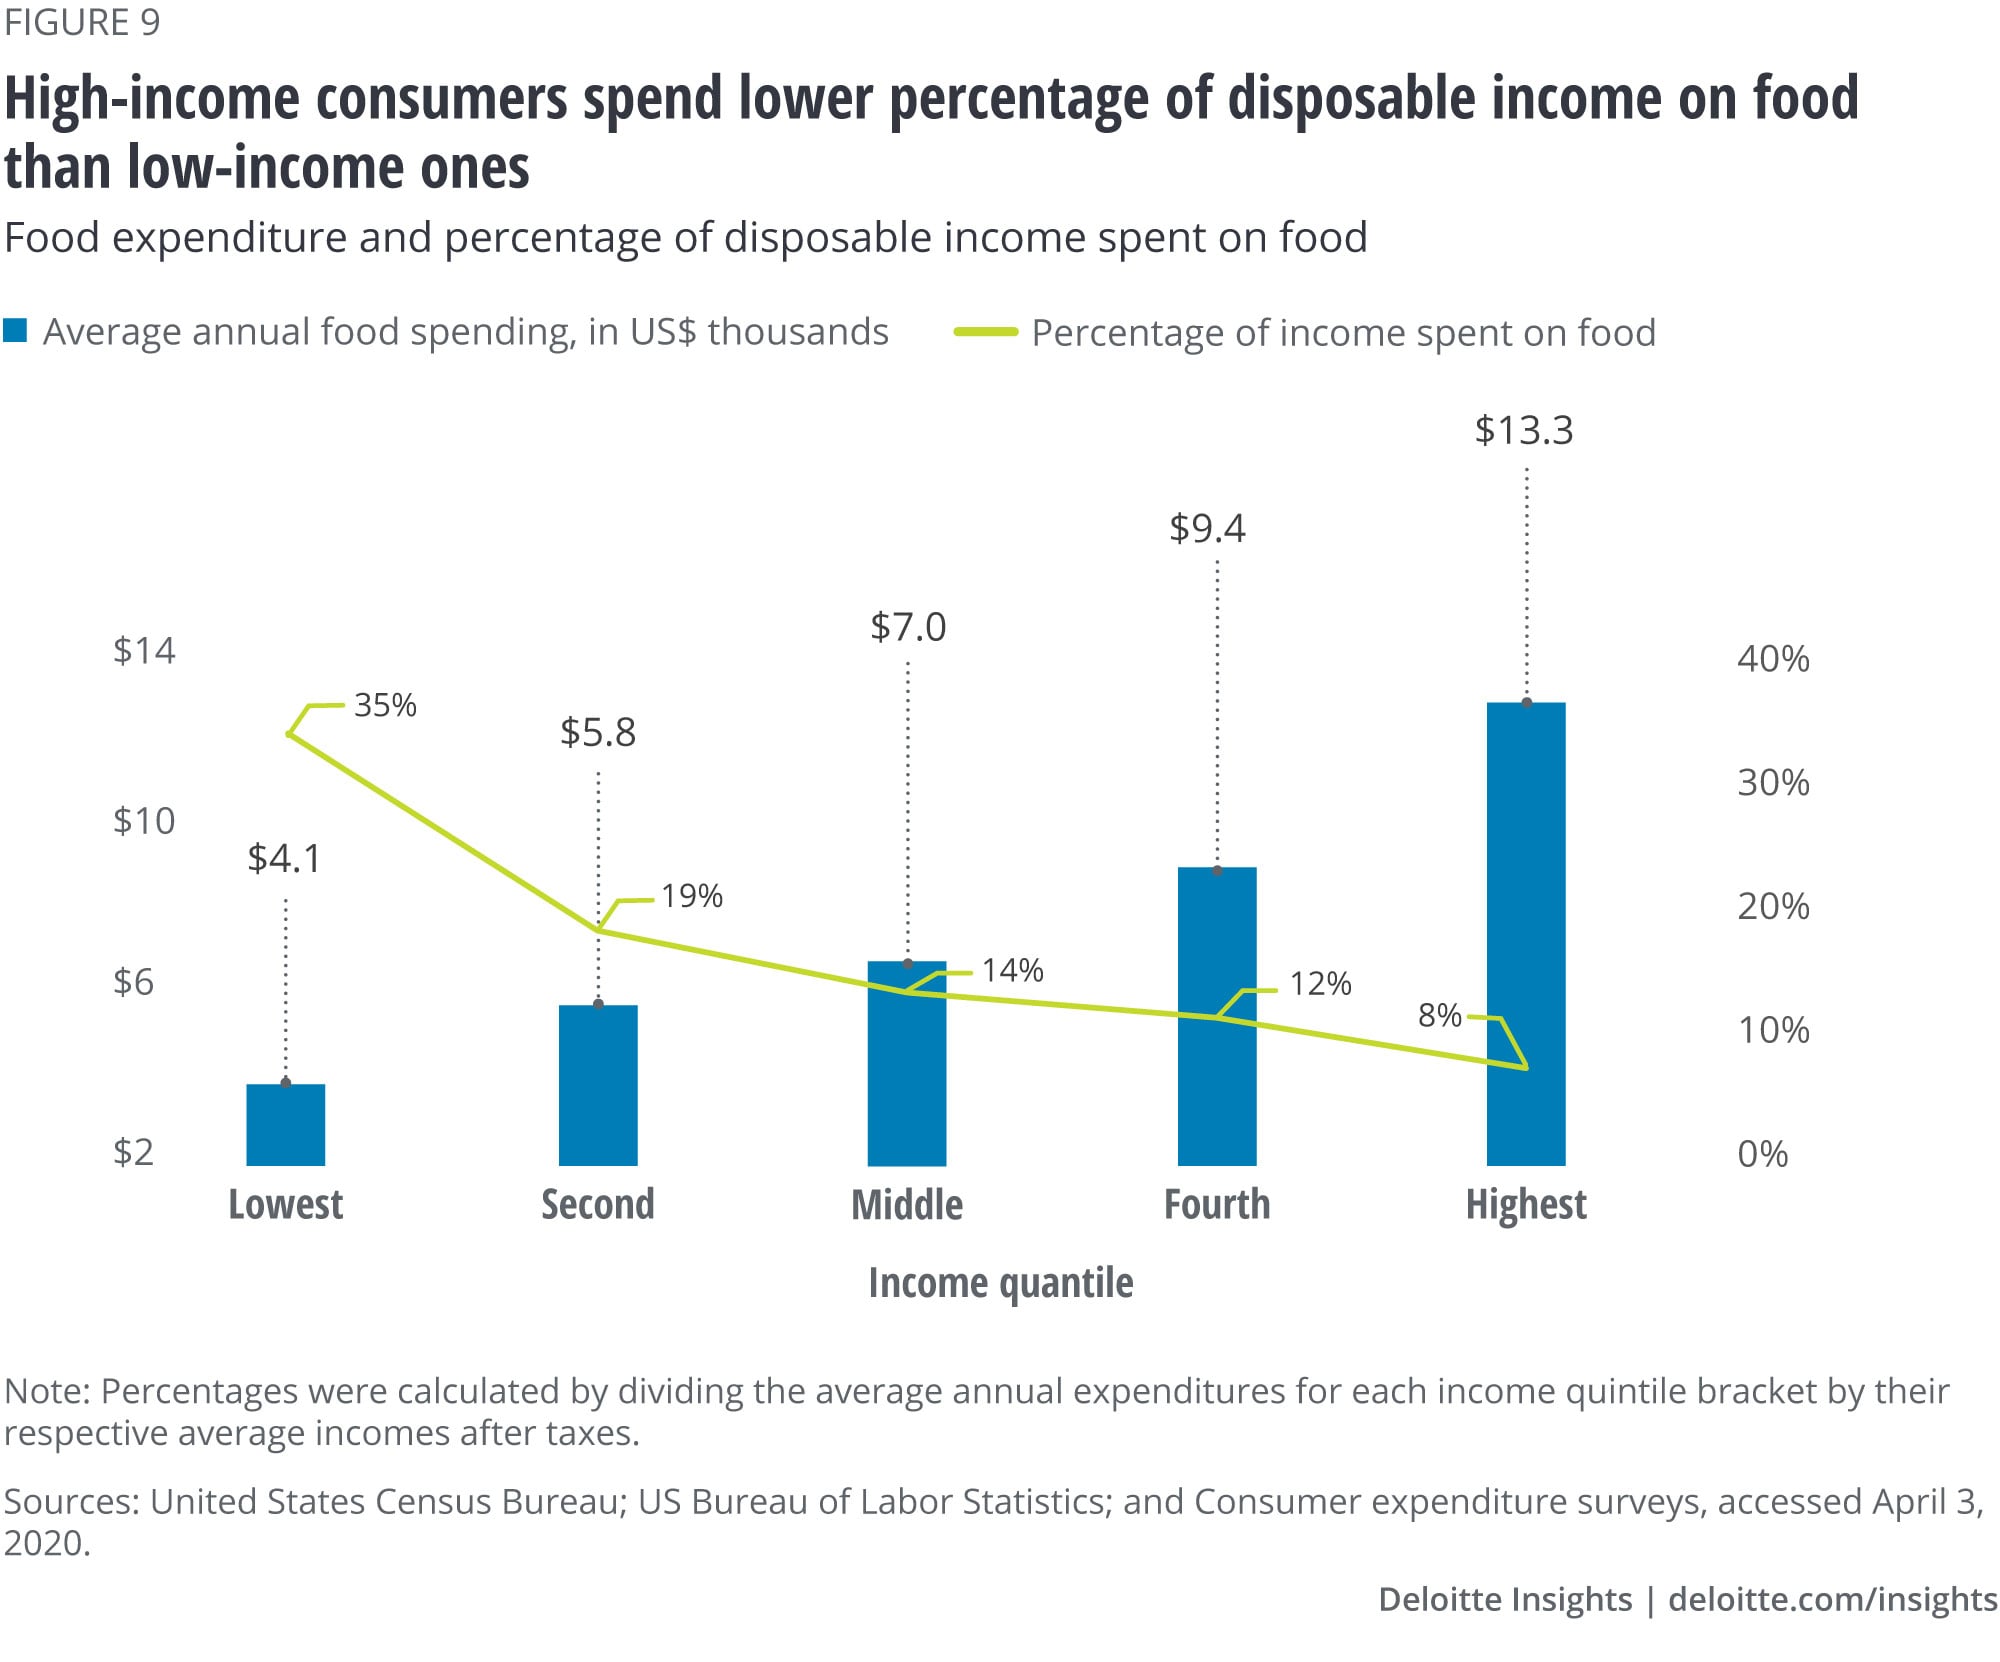
Products labeled as “healthy” or “sustainable” tend to market to higher-income consumers who have the means to spend more on such products.
Moreover, this trend of health-conscious foods also plays out at the actual locations where consumers shop. High-income consumers, who generally place greater emphasis on eating healthy, tend to shop for “healthy” and/or “organic” products in smaller, traditional grocery stores and establishments where fresh produce and other healthy and sustainable items are sold. However, the traditional grocery channel has lost more than half of its food retail market share over the past 30 years to nontraditional grocery stores such as convenience stores and dollar stores, which are less likely to sell these types of products.86 Lower-income consumers, on the other hand, tend to place less emphasis on eating “healthy,” more often shopping at convenience stores than high-income consumers. Convenience stores and dollar stores have a higher proportion of consumers with lower household incomes, with 42% and 46% of total consumers, respectively.87
Income disparity is not only pronounced in terms of product marketing and purchase, but also evident when we examine the actual state of consumers’ health. Ironically, while there’s been a significant increase in health-focused spending, the overall health of US consumers has relatively declined lately. For example, life expectancy fell from 78.9 years in 2014 to 78.6 in 2017 for the first time since 1959, then rose to 78.7 in 2018, but still falls short of the 78.9 years reached previously.88 Not surprisingly, the biggest decrease in life expectancy rates is seen in the low- and middle-income population, who are also at the greatest risk of obesity (and subsequently diabetes).89 Obesity has almost doubled in the last 20 years in the United States with no sign of improvement.
This does not necessarily mean that low-income consumers are not concerned about the values of health and sustainability; indeed, surveys of consumers would seem to indicate they are. But while consumers “will repeatedly say ‘yes’ on surveys that they are willing to pay more for environmentally friendly products,” when presented with having to make a choice on spending their dollars, such values become relative and they’re less likely to follow those sentiments.90 This is because purchasing decisions are shaped by economic constraints.
Takeaway: While it’s true to an extent that the consumer is becoming more “health conscious” and “sustainability seeking,” viewing consumers through a single lens and believing they’re behaving alike would be misleading. The trend toward improved health and sustainability has implications on consumers’ wallets, welfare, and shopping destinations—presenting challenges and opportunities for retailers and consumer products players alike.
Trend 7: Consolidation in retail and fragmentation of market share
In discussions on disruption to an industry, it is easy to get broad agreement that it is occurring, but the problem arises when you attempt to define it or, further, attempt to measure it. As we worked to measure the disruption in the RCP industry, we hypothesized that disruption, in essence, results in aggressive changes in market share volatility with disruptor companies aggressively taking share while those being disrupted donate share. Increased disruption leads to amplified competition and, hence, to increased changes in market share churn—or what we call and measure as market share volatility.
However, volatility alone doesn’t tell us what is happening, as the give-and-take of share could indicate the big getting bigger and the small becoming less relevant—also called consolidation. Conversely, volatility could mean the opposite with smaller, more nimble players stealing share from larger, more traditional, at-scale competitors—called fragmentation.
Once again, we turned to empirical data to evaluate this notion of disruption, volatility, and changes in market share concentration. Our aim was to provide insights to help understand the market dynamics at play.
Interestingly, we found that the retail industry has actually become less volatile with a decreasing amount of market share being “traded” among the top 230 retailers, marking a noticeable decrease in overall market share volatility for the last four years.95 This is driven largely by the regained footing of mass retailers, continued dominance of large online retailers, and continued strength and growth of off-price behemoths, who were all gaining share at the expense of mid-sized retailers.
In particular, the top 10 US retailers have gained market share with an increase of 320 basis points, driving the overall market consolidation, as the mid-size retailers have lost 230 basis points.96 Thus, there is less volatility now than previously measured, marking a reduction, at least by this measure, in the degree of industry disruption. Of course, if your company is being disrupted, this may be a hard conclusion with which to agree. Further, the current volatility is being driven by consolidation around big players who have regained their footing and show strength to the extent that they are collectively growing faster than the market (figure 10).
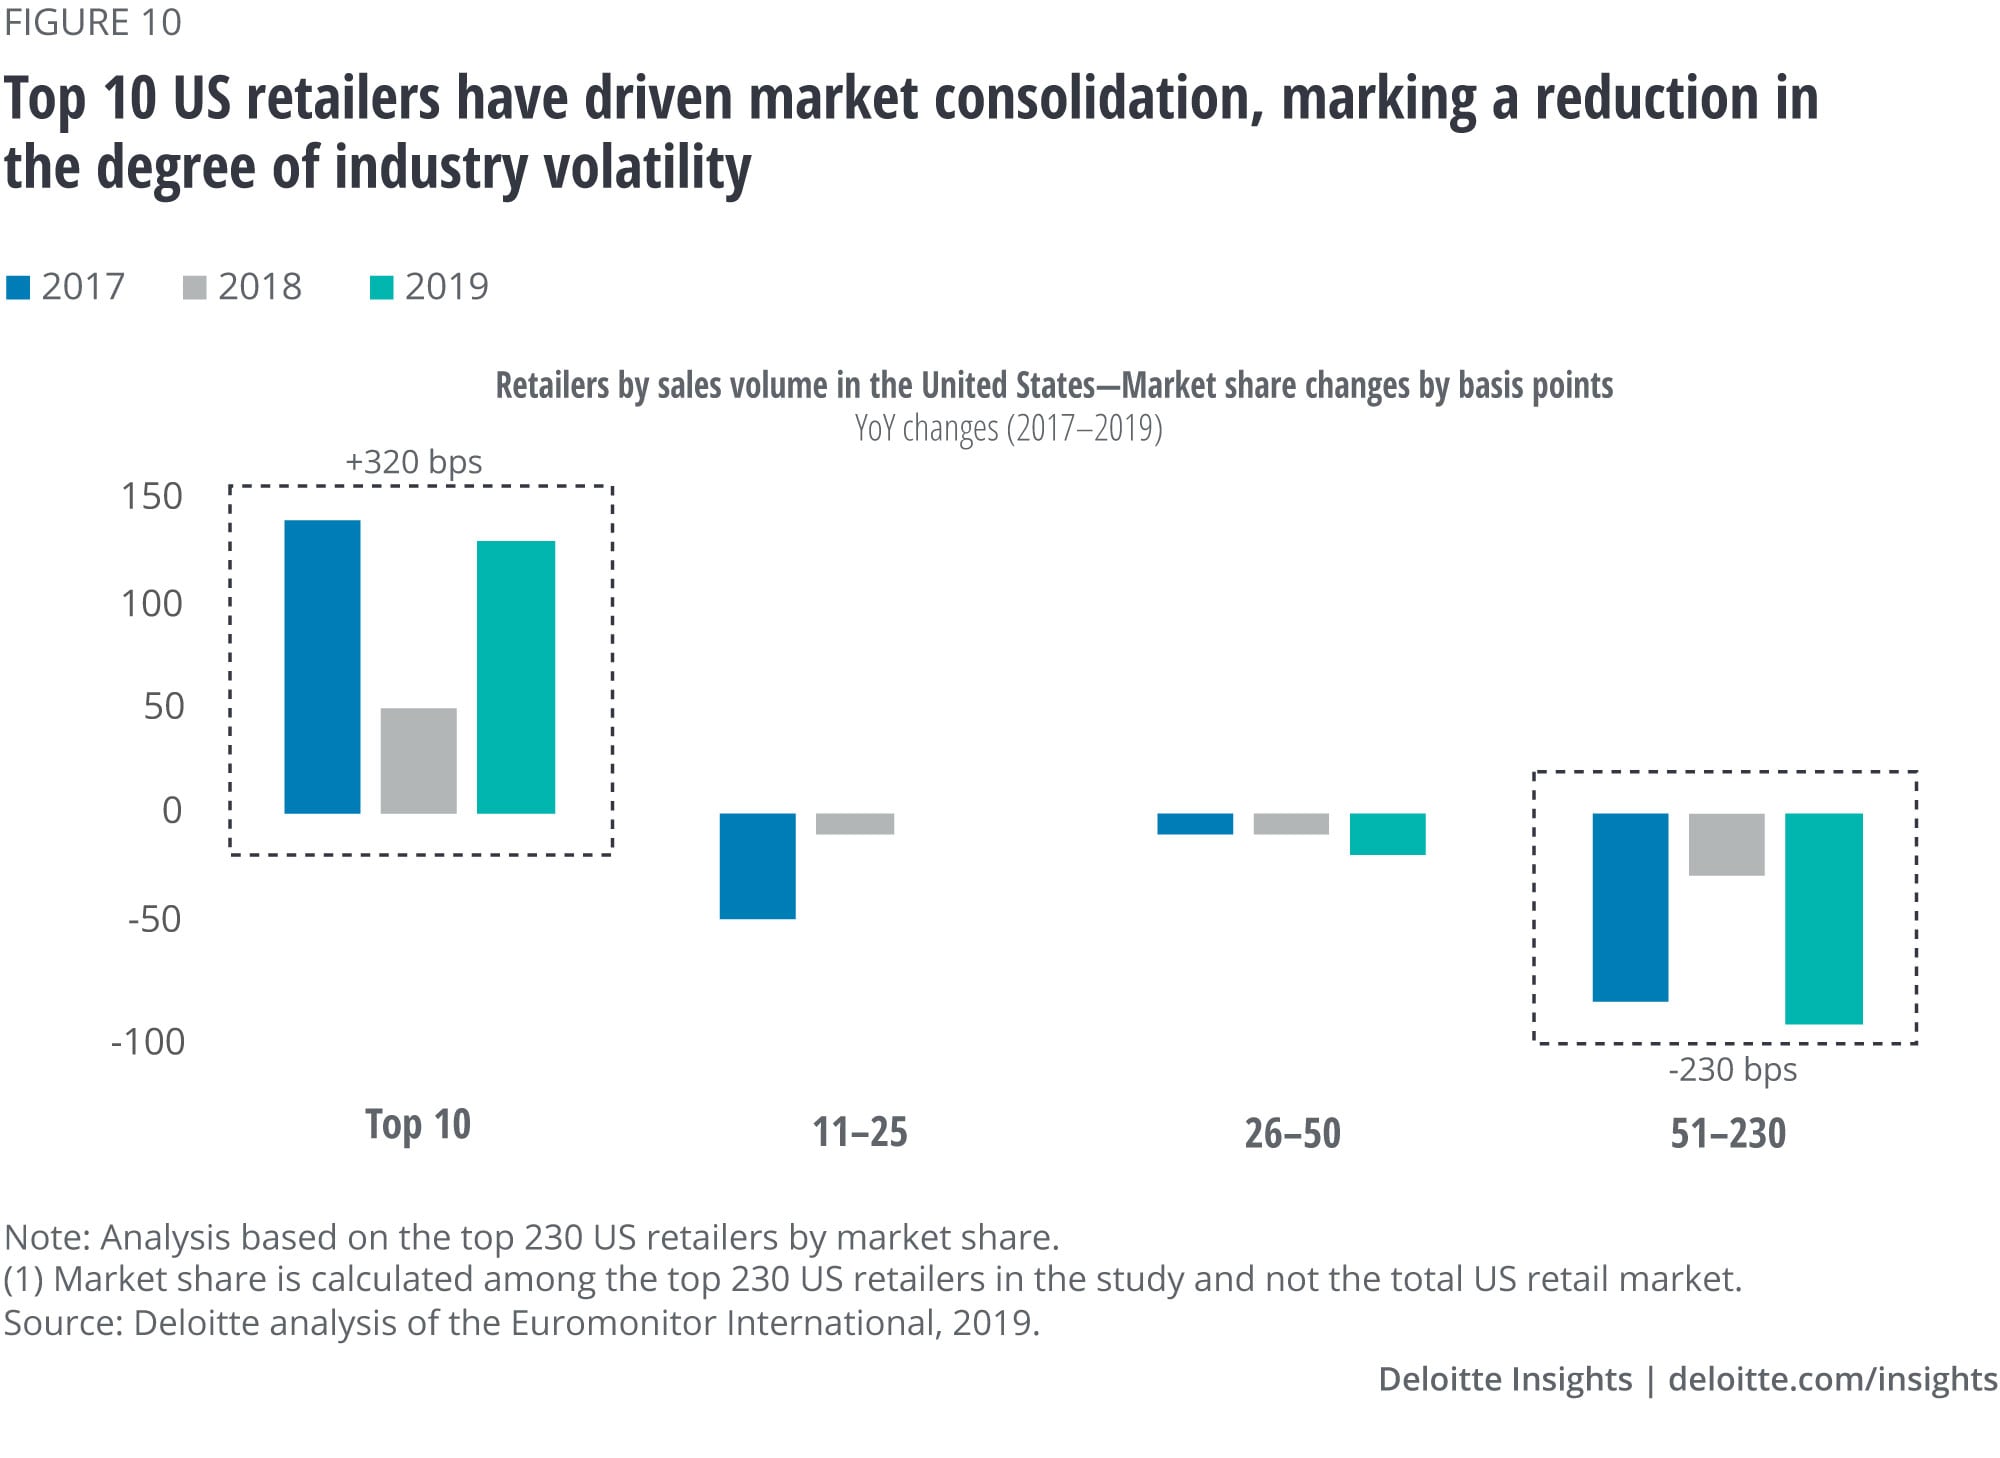
This growing trend of market share concentration is not unique to any specific retail sector, from apparel to grocery. However, the pace of the concentration trend differs, as consolidation in apparel is four times faster than consolidation in grocery.97
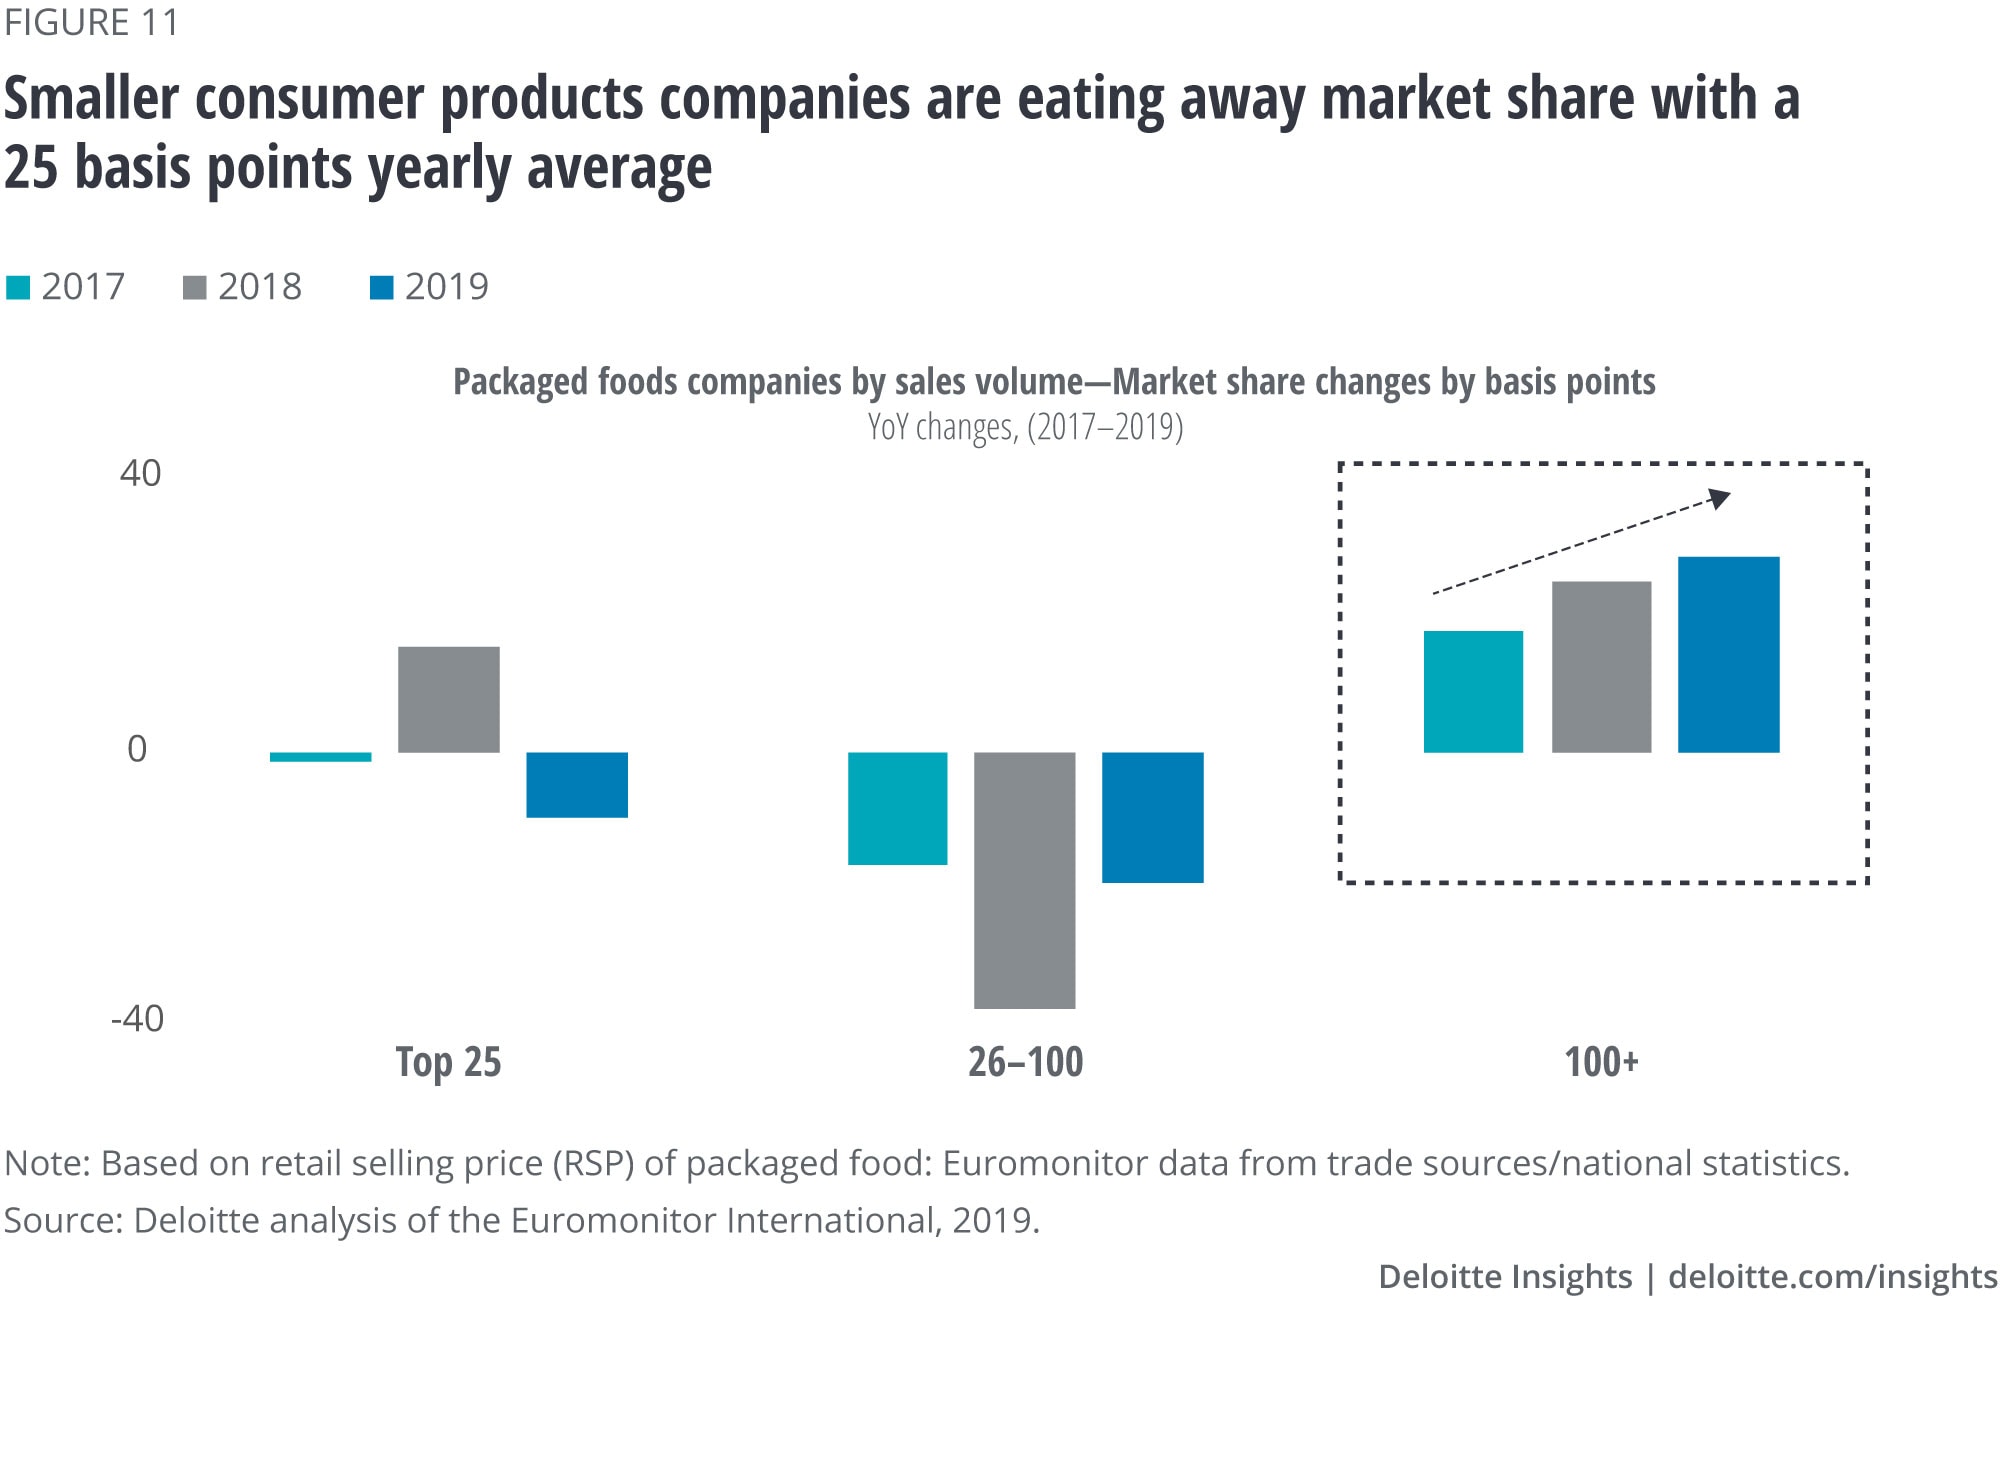
On the other hand, when we look at consumer products, we see a very different story—in fact, exactly the opposite. Fragmentation, which can be described as “death by a thousand paper cuts,” is manifesting itself in this space. Even as reduction in barriers to entry unleashes an onslaught of new competitors in the market, ease of consumer access through digital channels and marketplaces is enabling smaller brands to grab market share. It is worth noting that 58% of the sales of the biggest marketplace retailer in the United States is generated by third-party sellers.98 When we look at packaged foods, for instance, we see smaller competitors are eating away market share with a 25 basis points yearly average, and this is only accelerating over time (figure 11).99 In the beverage sector, the top three behemoths in alcoholic drinks and soft drinks lost 280 basis points and 120 basis points of their market share respectively over the last three years.100
Takeaway: On one hand, the market share of US retailers is being consolidated with large, at-scale players. On the other, both new players and incumbents in consumer products are experiencing market share fragmentation, driven by an increasing number of options and the explosion of brands. Frankly, both trends—consolidation and fragmentation—can be considered as disruptive but in different ways, as they are creating unique challenges and opportunities for RCP companies.
Setting the strategy for an uncertain future
Just like Croesus, industries and companies have been trying to predict the future for as long as anyone can remember, but more often than not with limited success.
While we determined that many of the predictions on the RCP industry shared some common flaws, their analysis and understanding enabled us to better understand where and how to look at changes ushering in trends in the industry. Moving forward, retail and consumer products companies must take a granular view to identify—and react to—the intricacies of these disruptive forces and the trends at play. Rather than coming up with (and paying heed to) predictions that are self-serving, companies should recognize that there is a higher order of operations that becomes apparent.
“It is not in the stars that hold our destiny, but in ourselves.”
While many may want to prioritize technology change as pre-eminent, the data tells us that the consumer economics of time and money is of the highest order. Further, as the wallet of many consumers is pressured, RCP companies need to open the aperture and recognize that they’re competing for share of wallet, not just share of category. In this context, they need to understand that rising health care costs is as big a threat to an apparel retailer as the growth of a brand competitor. Similarly, the shift to food-away-from-home expenditure is as important to a grocery retailer as is the growth of home delivery of groceries.
With this in mind, RCP companies need to embrace scenario-planning, but in a broader way where data drives potential outcomes. Here’s how they can do this:
- Instead of relying on prophecy-based predictions, seek to understand and measure the trends that impact your business, utilizing internal and external data from traditional and nontraditional sources. This likely means forming partnerships in order to have access to data sources produced outside your organization.
- Pay special attention to trends emerging on the horizon, because reaction time has become a strategic differentiator.
- Avoid gadget-chasing, and instead define opportunities in the context of consumer economics of time and money.
These activities, in tandem, will help retail and consumer products companies to move beyond the shortcomings of a prophecy-based approach to a new, more concrete way of assessing the potential future evolution of the industry. This approach, which is more pragmatic, data-centric, and focused on consumer trends and economic opportunities we can observe and measure, will also enable them to better inform their decisions, strategy, and investments and chart their own future growth in a disruptive market.