
Delivering on a better quality of life
Governments worldwide are addressing affordability, accessibility, and civic engagement challenges to improve the quality of life for their residents
Governments often measure success through many metrics—gross domestic product, life expectancy, maternal mortality, and deaths of despair—but most of the time, what they’re trying to discern from those numbers is quality of life. Today, dozens of indices assess quality of life, including data on health, education, income, and self-reported well-being. Multiple factors such as demographics, culture, and regional circumstances influence quality of life.
A global survey of 33,000 people in 28 countries reports that only 36% of respondents believed that things will get better for the next generation; this number was only 20% for developed countries.1 The US Federal Reserve’s latest report on the economic well-being of US households found that about 72% of adults were at best “doing okay” financially. The financial well-being gap was more severe when viewed through the lens of educational attainment, race, and family structure.2
Economic pessimism appears interlocked with stagnating wages and elevated inflation levels.3 Although inflation is slowing down globally,4 the cost of living continues to rise. The Economist Intelligence Unit’s Worldwide Cost of Living 2023 survey pointed out that, on average, prices had risen by 7.4% year over year.5
Another area of concern is that some citizens feel as though they do not have a say in what government does. The Organisation for Economic Co-operation and Development (OECD) found that the trust gap between citizens who report having political agency and those who say they do not is 47 percentage points.6 A 2024 Pew survey found that a majority of respondents (74%) across 24 democracies expressed skepticism about their government’s concern for their opinions.7 When people feel that they lack a voice and influence in government decision-making, trust levels tend to decrease.8
Perceptions of crime and safety continue to affect some. While some data sources around the world point toward a declining crime rate over the past decade (with a U-shaped dip and rise during the 2020 and 2021 pandemic years), the global Safety Perceptions Index points toward an increasing sense of “ambiguous risk” citizens experience—the feeling that risks exist around them but cannot be defined well.9 This perception could be aggravated by rising rates of anxiety, depression, uncertainty about the future, loneliness, and the rise of social media as a news source.10
Away from the public eye, a growing trend threatens to turn into a challenge—loneliness and social isolation. The World Health Organization’s data on loneliness reveals that 1 in 4 older adults experience social isolation, while 5% to 15% of adolescents report feelings of loneliness.11 In countries like China, India, the United States, and across Europe and Latin America, 20% to 34% of older adults grapple with loneliness.12 This can often be accentuated further by digital and social media platforms. The tools designed to bring people closer can sometimes drive them apart. Social media platforms can lead to feelings of social isolation and loneliness, especially among teenagers.13 Australia recently passed a law that will ban social media for children under the age of 16 by the end of 2025. The law will fine social media platforms up to 50 million Australian dollars (US$33 million) for failing to prevent children under 16 from having accounts.14
The year 2024 was a massive election year, and political landscapes shifted worldwide.15 Governments face a Herculean task: create economic and social conditions that allow all citizens to thrive. Left unaddressed, these challenges could lead to growing discontent among citizens.16
Some governments are actively working to improve quality of life by tackling affordability, making services more accessible, and designing physical and digital infrastructure to better serve constituents. There is a concerted effort to rebuild a sense of purpose and feeling of belonging among citizens by fostering stronger social connections. These mutually reinforcing approaches are important for a more resilient and engaged society.
Key challenges
- Affordability: A thriving society can afford basic needs such as housing, transportation, health care, and utilities. The COVID-19 pandemic, corresponding economic crisis, rising inflation, housing scarcity, and health care costs have pushed some individuals and families to their financial brink.
- Economic pessimism: Affordability is just a part of the story; the other challenge is the growing sense of economic pessimism driven by stagnating wages, the rising wealth gap, and the dawn of a new technology era.
- Rising disconnect and loneliness epidemic: In an era characterized by unprecedented connectivity, it is paradoxical that, today, we face a rising epidemic of loneliness and social isolation. Social bonds and community ties are weakening amid a sense of alienation.
Trend in action
Policy interventions designed to improve affordability
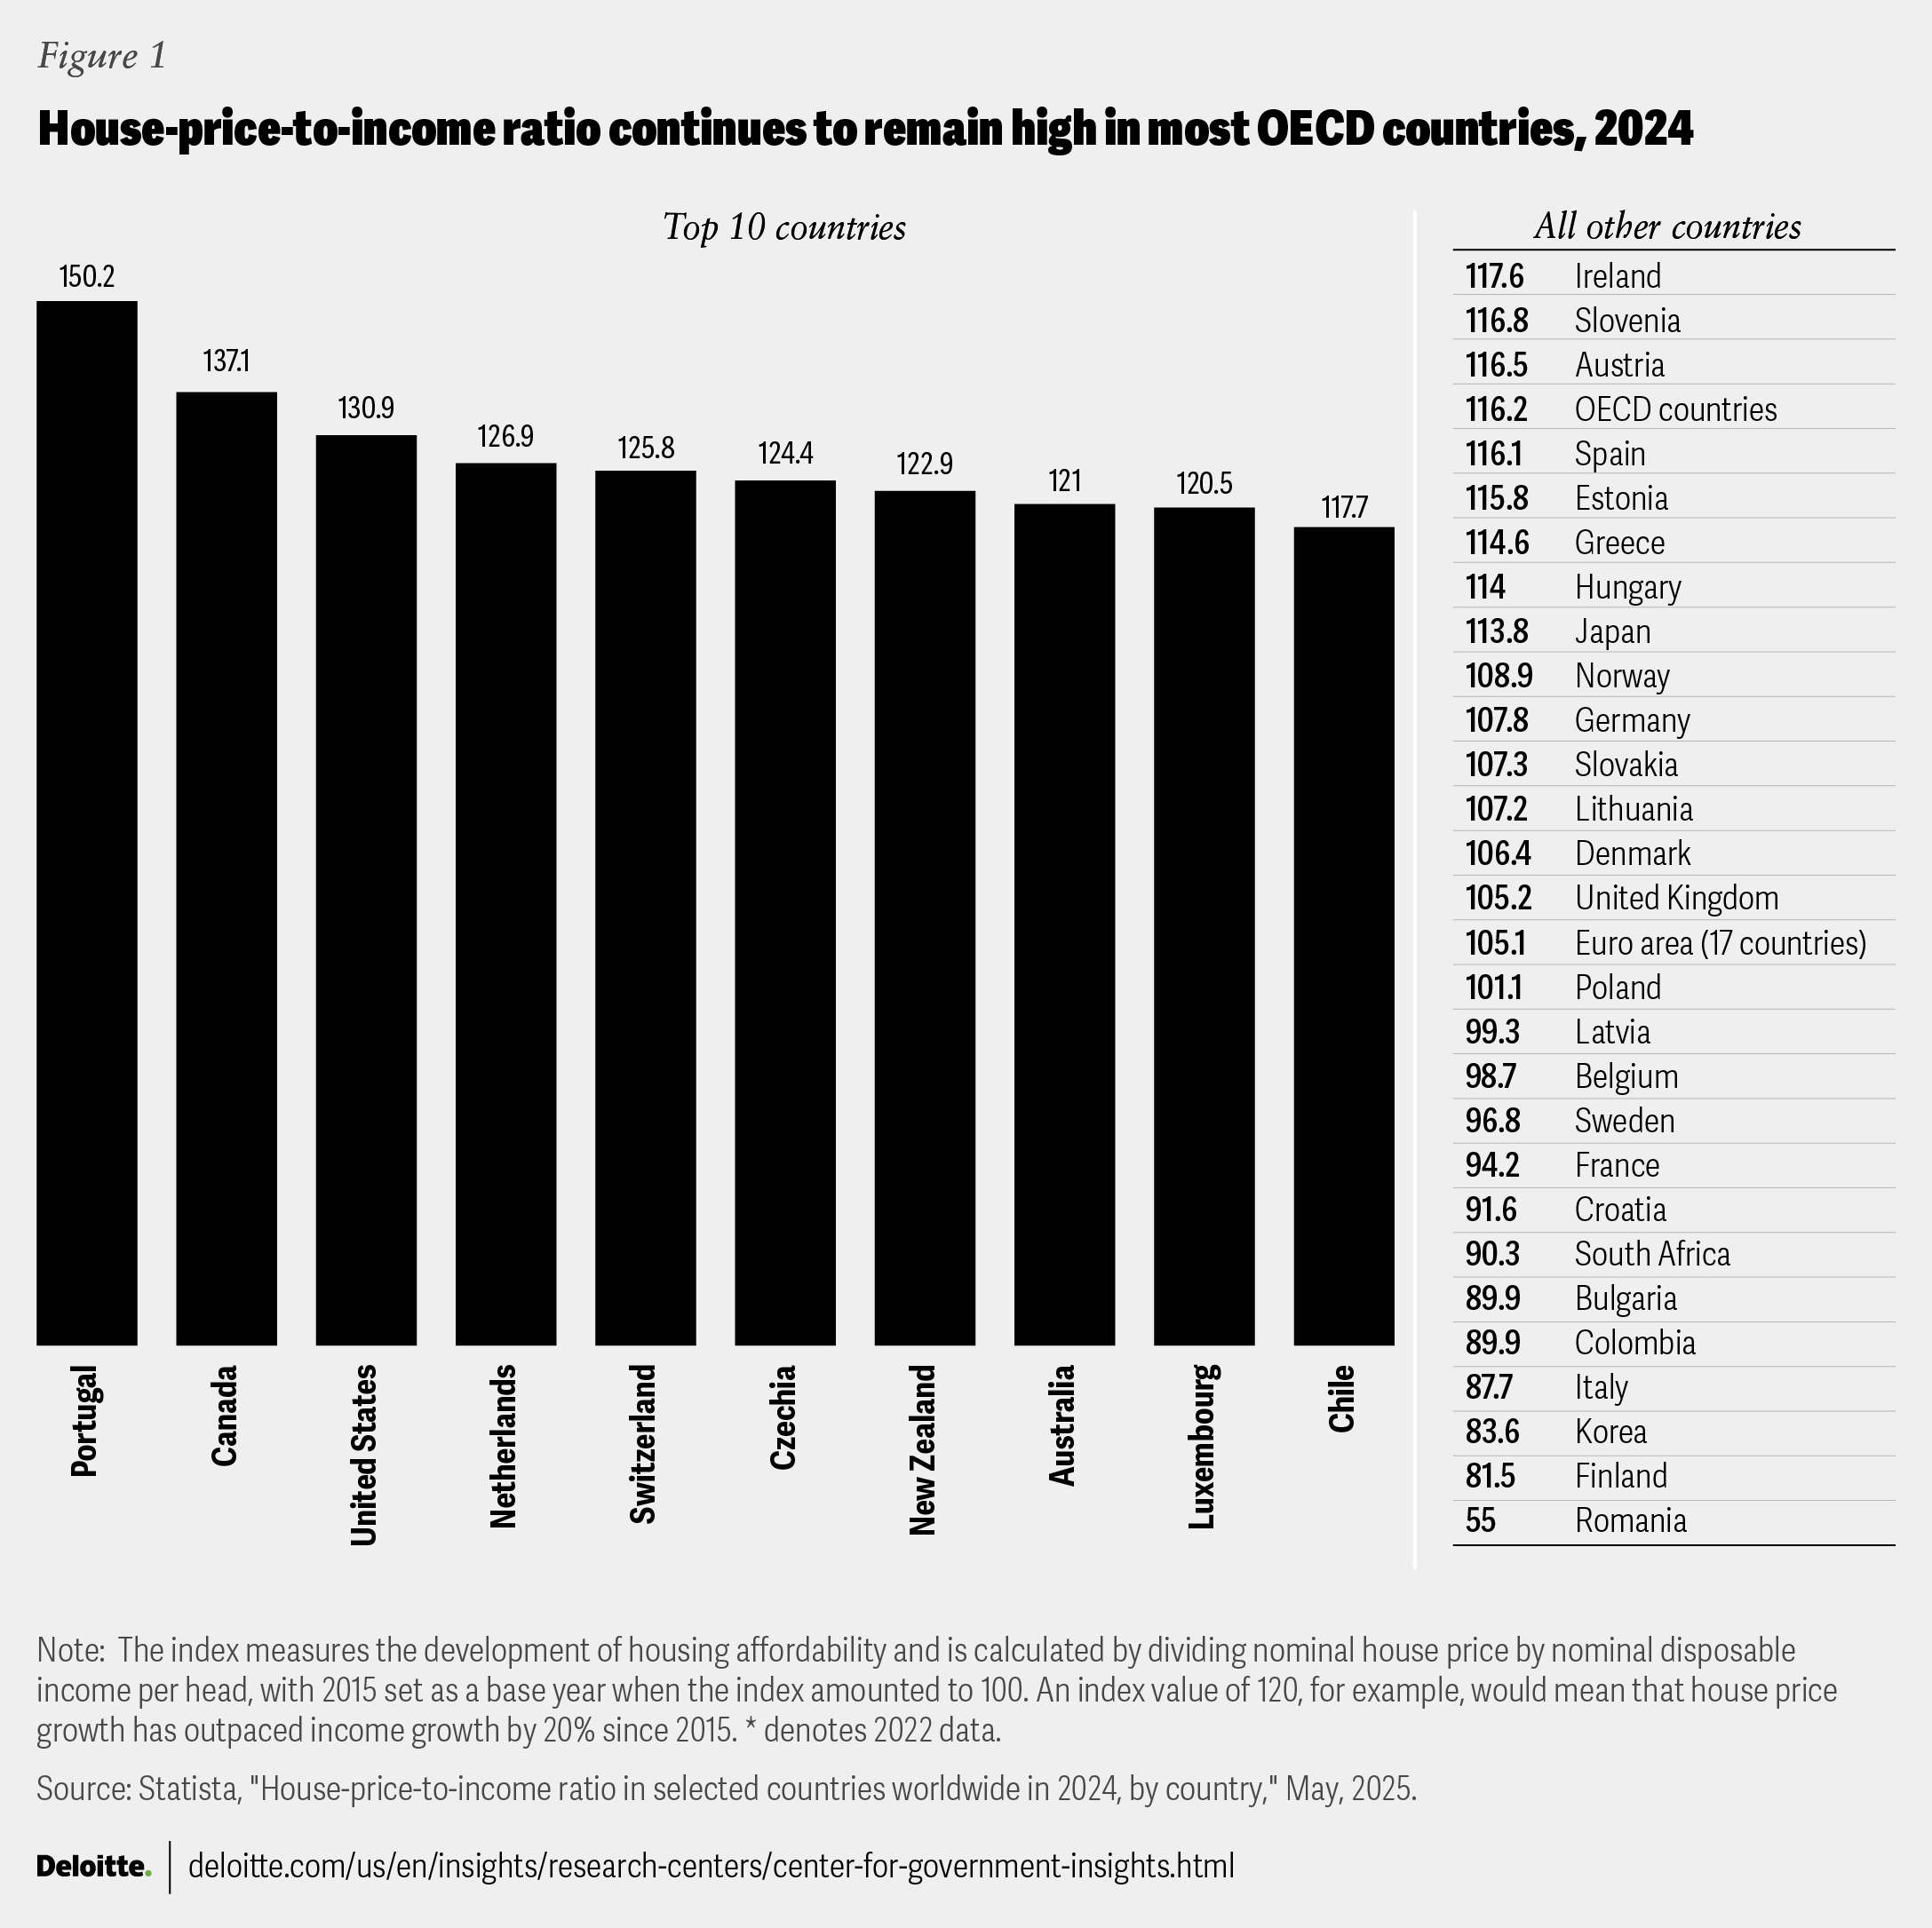
Housing costs represent the largest expense for most households. Over past decades, median home prices and rental costs have consistently risen, while household incomes have not kept pace (figure 1). In OECD countries, one in three low-income tenant households and one in four low-income homeowners with a mortgage spend 40% of their disposable income on rent or mortgage payments.17 In the United States, nearly half of renter households spent 30% of their income on housing costs in 2023.18 That year also saw America’s largest annual real increase in gross rental costs since 2011.19
Transportation is often the second largest household expense. In many countries, transportation and housing account for approximately half of average household budgets.20 Housing and transportation costs reflect the built environment—density, land use mix, and overall accessibility—which, in turn, influences public health and other quality-of-life parameters.
Some governments are retooling their public policy toolkit to improve affordability in housing, transportation, health care, and essential services like internet connectivity. Interventions can manifest in many ways, including shaking up zoning, rethinking rent control, reducing transit deserts, and developing affordable broadband infrastructure.
(Re)zoning to increase the housing stock
Governments, looking to boost housing supply, are updating their regulations. New zoning laws often allow accessory dwelling units like backyard cottages or basement apartments.21
The city of Minneapolis, Minnesota, revised its zoning rules to allow more buildings downtown and near public transit, ended single-family zoning, and eliminated requirements on how many parking spaces each building must provide.22 These zoning changes led to a 12% increase in housing stock between 2017 and 2022.23 In those five years, rents rose just 1% in the city, while rising 14% in the rest of Minnesota.24
In Toronto, Canada, about 70% of the land is zoned for single or semi-detached homes, restricting additional suites and rental opportunities. The city’s Expanding Housing Options in Neighborhoods (EHON) initiative aims to broaden zoning laws to include multifamily units and accessory dwellings.25
Asian countries were early proponents of mixed zoning policies that permit both commercial and residential developments and mix high- and low-income housing. Singapore, in particular, pioneered a social mix housing policy in the late 1960s. Almost 8 in 10 Singaporeans now live in subsidized housing, which 90% of renters eventually buy.26 The neighborhoods have high-quality playgrounds, parks, markets, community centers, and schools.27
Increasing rental housing supply
Rent control has been a prominent social policy in many countries since World War I.28 Decades of research have shown that rent controls have proven effective at making rents affordable, slowing rent hikes, and thereby reducing rental burdens. But they also lead to reduced housing quality, lower mobility, higher rents for uncontrolled units, and less rental housing supply.29
Housing policies should be flexible to match changing markets. Over the years, many cities and regions globally have used different types of rent controls, including rent controls on older dwellings, cap rental increases, and pair rent controls with restrictions like eviction protection.30
Argentina repealed its rent control laws in 2023.31 Over time, the country’s rent controls had reduced rental home supply, created inflexible lease agreements, and increased pressure on tenants during economic crises. The new laws introduced flexible lease terms and market-driven pricing, which in turn led to a surge in new rental homes. Rental housing availability in Buenos Aires increased by 195% within months, stabilizing or even lowering prices in some neighborhoods.32
Affordable housing finance innovations to support homeownership
Owning a home can seem out of reach for some households. Approximately 1.6 billion people globally lack adequate housing; this number could rise to 3 billion by 2030.33 Housing them also requires affordable financing mechanisms.
Vancouver, Canada, is the third-most expensive city in the world.34 Housing researchers call it “impossibly unaffordable.”35 To help reduce that burden, the province of British Columbia worked with the First Nations of Musqueam, Squamish, and Tsleil-Waututh (the MST Nations partnership) to help finance homebuyers at 40% below market value at a housing development in Vancouver. As a part of the initiative, the buyer pays 60% of the market price of the unit and the province covers the other 40%. The buyer pays back the 40% contribution to the province when the home is sold or after 25 years, whichever comes first. The MST Nations partnership provides the land, and the British Columbia government provides the financing.36
Rethinking public transit to help make it affordable and financially sustainable
Public transit systems in developed economies are struggling to restore pre-pandemic ridership levels. Transit’s long-term financial sustainability depends on riders, who may abandon an underfunded or unreliable system, which can set off rate hikes or service cuts. A poorly functioning public transportation system can impact economically disadvantaged communities.
Australia has the third-most expensive public transport system in the world, behind Switzerland and the Netherlands.42 To help remedy this, the state of Queensland is experimenting with a flat fee of 50 cents across all public transit options in its Translink network, which includes buses, trains, ferries, trams, and on-demand services.43 This initiative is a part of the broader cost of living action plan that also subsidizes energy bills, reduces vehicle registration costs, and subsidizes children’s activities like swim lessons.44
Meanwhile, in 2022, the city of Lisbon introduced free public transport for all residents under the age of 18, students up to the age of 23, and seniors over 65.45 The effort aims to improve affordability for certain population groups and promotes greater access to transport and mobility for city residents. The move helped bring 33,000 additional commuters into the public transportation system within a year, an increase of nearly 60%.46
Heavy subsidies and free public transportation are not new.47 But a flat fee plan aims to address shifting mobility choices by improving affordability for riders who depend on public transport and bringing back leisure riders post pandemic by offering them a cost-effective alternative.48 That said, accessibility can remain a challenge, especially in transit deserts (see “Micro-transit to improve first-mile and last-mile connectivity” in the next section).
Partnering to build connectivity infrastructure
Internet connectivity is a basic need in today’s digital economy. This need has put pressure on governments to extend internet infrastructure into rural and hard-to-reach areas. And the private industry’s interest in connectivity can set up a win-win scenario for broadband expansion.
In West Virginia, Indiana, Ohio, Iowa, and Nebraska, for example, Meta's subsidiary Middle Mile Infrastructure is laying hundreds of miles of fiber optic cables to connect the company’s data centers. The company plans to lay approximately 275 miles of fiber optic cable through West Virginia’s western border and another 160 miles of fiber infrastructure in Indiana along the I-70 corridor.49 Buildouts like these are possible through continual efforts and coordination between state agencies, state legislatures, federal agencies, and private industry.50
While this infrastructure was intended to connect data centers, excess capacity can be leased to broadband providers, speeding up broadband to previously unserved areas. Public-private partnerships can also share physical infrastructure. In October 2023, the California Department of Technology announced a partnership with Lumen to build 1,900 miles of fiber optics by laying new fiber in Lumen’s existing conduit.51
Expanding access
Some governments are making significant strides toward increasing access to public services. This includes investing in infrastructure, designing for user convenience, and transforming back-end operations to improve both physical and digital access to services.
Digital identity–driven access to government services
Digital identity lets individuals prove their identity securely online, eventually enabling citizens to access government services without logging into multiple websites. As of mid-2022, 186 countries have some kind of digital identity program.58 India’s Aadhaar program represents the largest global digital identity project, with over 1.3 billion digital IDs. More than 1,700 state and federal government initiatives use Aadhaar to provide benefits and services. During the COVID-19 pandemic, linking bank accounts to Aadhaar enabled the Indian government to transfer US$3.9 billion to 318 million beneficiaries.
Community or place-based approach
Community-based approaches embed services within the very communities they aim to serve. These programs build on a community’s unique strengths.
Logan Together uses a place-based approach for families in Logan, Queensland, Australia. Logan Together unites early-childhood and prenatal community programs, and connects families with resources, building early childhood education opportunities around local indigenous elders and following the community’s lead when deciding what services to offer. As of 2022, Logan reported a 42% decrease in birthparents receiving inadequate care, and a 7% decrease in substantiated cases of child abuse in children under the age of 5.61
Micro-transit to improve first-mile and last-mile connectivity
Accessible transportation is tricky because of the classic “last mile” problem. A train, highway, or subway moves citizens quickly—until it’s time to exit the system and get home. First-mile and last-mile connectivity is often a challenge in transportation networks.
Jakarta, the capital of Indonesia, is one of the most congested cities in Asia.62 But starting in 2017, the city launched the Mikrotrans service, integrating informal private bus operators called angkots into the city’s formal public transportation TransJakarta network. The micro-transit network, which now makes up 60% of the total network, helped the city double its public transportation coverage to 82% by 2022 and increase daily ridership from 300,000 to over a million during the same period.63
Improving social connections and social capital
A growing feeling of social isolation and loneliness is becoming more common.64 The digital era exacerbates the problem.65 Designing for social connections could mean reimagining the built environment to encourage more community connections, making communities not just livable but also lovable, and creating avenues for residents to contribute and cocreate with the government.
Building human connection in communities
Urban planners often discuss cities in terms of livability and smartness. Livability refers to a city’s ability to meet practical needs like safety, mobility, jobs, education, public space, and political stability. Smartness involves using connectivity, Internet of Things, and artificial intelligence to help manage traffic, enhance safety, and provide digital services. But statistics can overlook a third dimension: lovability. Lovability is driven by human connection—a city’s ability to foster community and evoke a sense of belonging.66
The Lovable Singapore project, led by the DesignSingapore Council (Dsg), is the city’s first effort to understand how to make Singapore more lovable. It involves public agencies and private organizations and aims to balance economic and cultural pursuits for a diverse population.67
Dsg surveyed 2,500 citizens about what makes Singapore lovable and how it can improve. The study identified four personas mapped to six “lovability” connections: unloved but attached, loving but disengaged, loved and engaged, and loved but disengaged. Dsg used these insights to identify interventions, such as addressing a lack of vibrancy in public spaces caused by over-curation and regulation68 (see “My Take: Leading with Design to foster a sense of belonging in Singapore”).
Data and evidence-based approach to individual well-being
Traditionally, governments have tried to meet the needs of citizens by distributing benefits. However, a shift toward data-driven and evidence-based policy measurements is inspiring more targeted interventions.
New Zealand was an early pioneer of the evidence-based social investment framework which is seeing renewed focus and institutional commitment.69 The social investment framework considers populations across multiple cohorts: individuals in crisis, individuals with complex but manageable needs, and individuals with stable or simpler needs. The framework uses data, evidence, and modern analytics to determine interventions. These can help break cycles of dependence and intergenerational poverty.70
In the 2024 budget, the New Zealand government earmarked an initial US$6.25 million and an additional US$51 million to support the strategy.71
Addressing loneliness and social isolation in society
A teenager can be connected to social media but feel disconnected from society. A young mother may struggle to find her place among her peers. A grandfather could feel alone after the death of his partner. Social isolation and loneliness can affect anyone. In 2023, the World Health Organization officially recognized loneliness as a global health priority.72 In 2019, the United Kingdom appointed a loneliness minister, with Japan following suit in 2021.73
The human need to be social is part of our neurobiology, which can shape how we think, feel, and behave. The scale and severity of social isolation and loneliness are challenges, but they are also opportunities for governments to reimagine and redefine how societies can overcome this barrier to quality of life.
The United Kingdom was the first country to introduce a loneliness strategy in 2018. It focused on destigmatizing loneliness and helping organizations that connect people. In 2021 to 2022, the government introduced the Loneliness Engagement Fund to provide over 260,000 pounds in grants to support groups most affected by loneliness.74
Similarly, Mount Sinai Hospital in Toronto debuted a targeted effort toward reducing loneliness among the elderly. The hospital launched a clinical trial called “How R U” that aims to reduce loneliness in older hospital patients by facilitating social video calls between patients and volunteers.75
Tools and strategies to deliver on quality of life
Improving affordability
- Easing housing restrictions: Streamlining and simplifying housing regulations can help lower construction costs, speed up the development process, and provide more affordable housing.
- Improving access to finance: Enhancing financial access through affordable loans and subsidies can help more people afford homes.
- Strengthening public-private partnerships: Collaborating with private entities can help government agencies leverage additional resources and expertise to bear in the development of housing and infrastructure projects.
Increasing accessibility
- Building the foundation of digital identity systems: Establishing robust digital identity systems can help streamline access to various essential services and benefits.
- Embracing a place-based approach: Focusing on local needs and conditions can help ensure that solutions for basic services are tailored and effective for specific communities.
Improving social capital
- Adopting an evidence-based social investment approach: Governments can optimize their investments to improve community well-being using data-driven strategies.
- Improving micro-community networks: Building strong micro-community networks can strengthen citizens’ sense of connection and inclusion.
BY
Miguel Eiras Antunes
Martin Joyce
香野 剛/Tsuyoshi Kono
Mahesh Kelkar
Tiffany Dovey Fishman
The authors would like to thank Adithi Pandith for providing feedback and suggestions at critical junctures and Apurba Ghosal for research support. In addition, the authors would like to thank Dawn Lim and Minister Miguel Pinto Luz for their valuable input in the “My take” section.
Cover artist: Sofia Sergi; Adobe Stock.
Visit the Deloitte Center for Government Insights
Access more insights for the defense, security and justice, government health care, state and local government, transportation and infrastructure, human services, and higher education sectors.