
Drug launches reflect overall company performance
Deloitte analysis uncovers lessons that large pharmaceutical companies could glean from their smaller rivals’ drug launch strategies.
Developing and implementing a successful launch strategy has become increasingly challenging for pharmaceutical companies. Today’s drug launches require manufacturers to have more resources, deeper clinical expertise, better cross-functional coordination, and greater agility. And this rings especially true for larger companies preparing to bring a new product to market. Thinking of product launches as microcosms of the company’s overall performance can help uncover where traditional organizational structures and approaches could be revamped to keep pace with broader market trends. We call upon pharma organizations to rethink the usual ways of doing business that often contribute to poor launch performance.
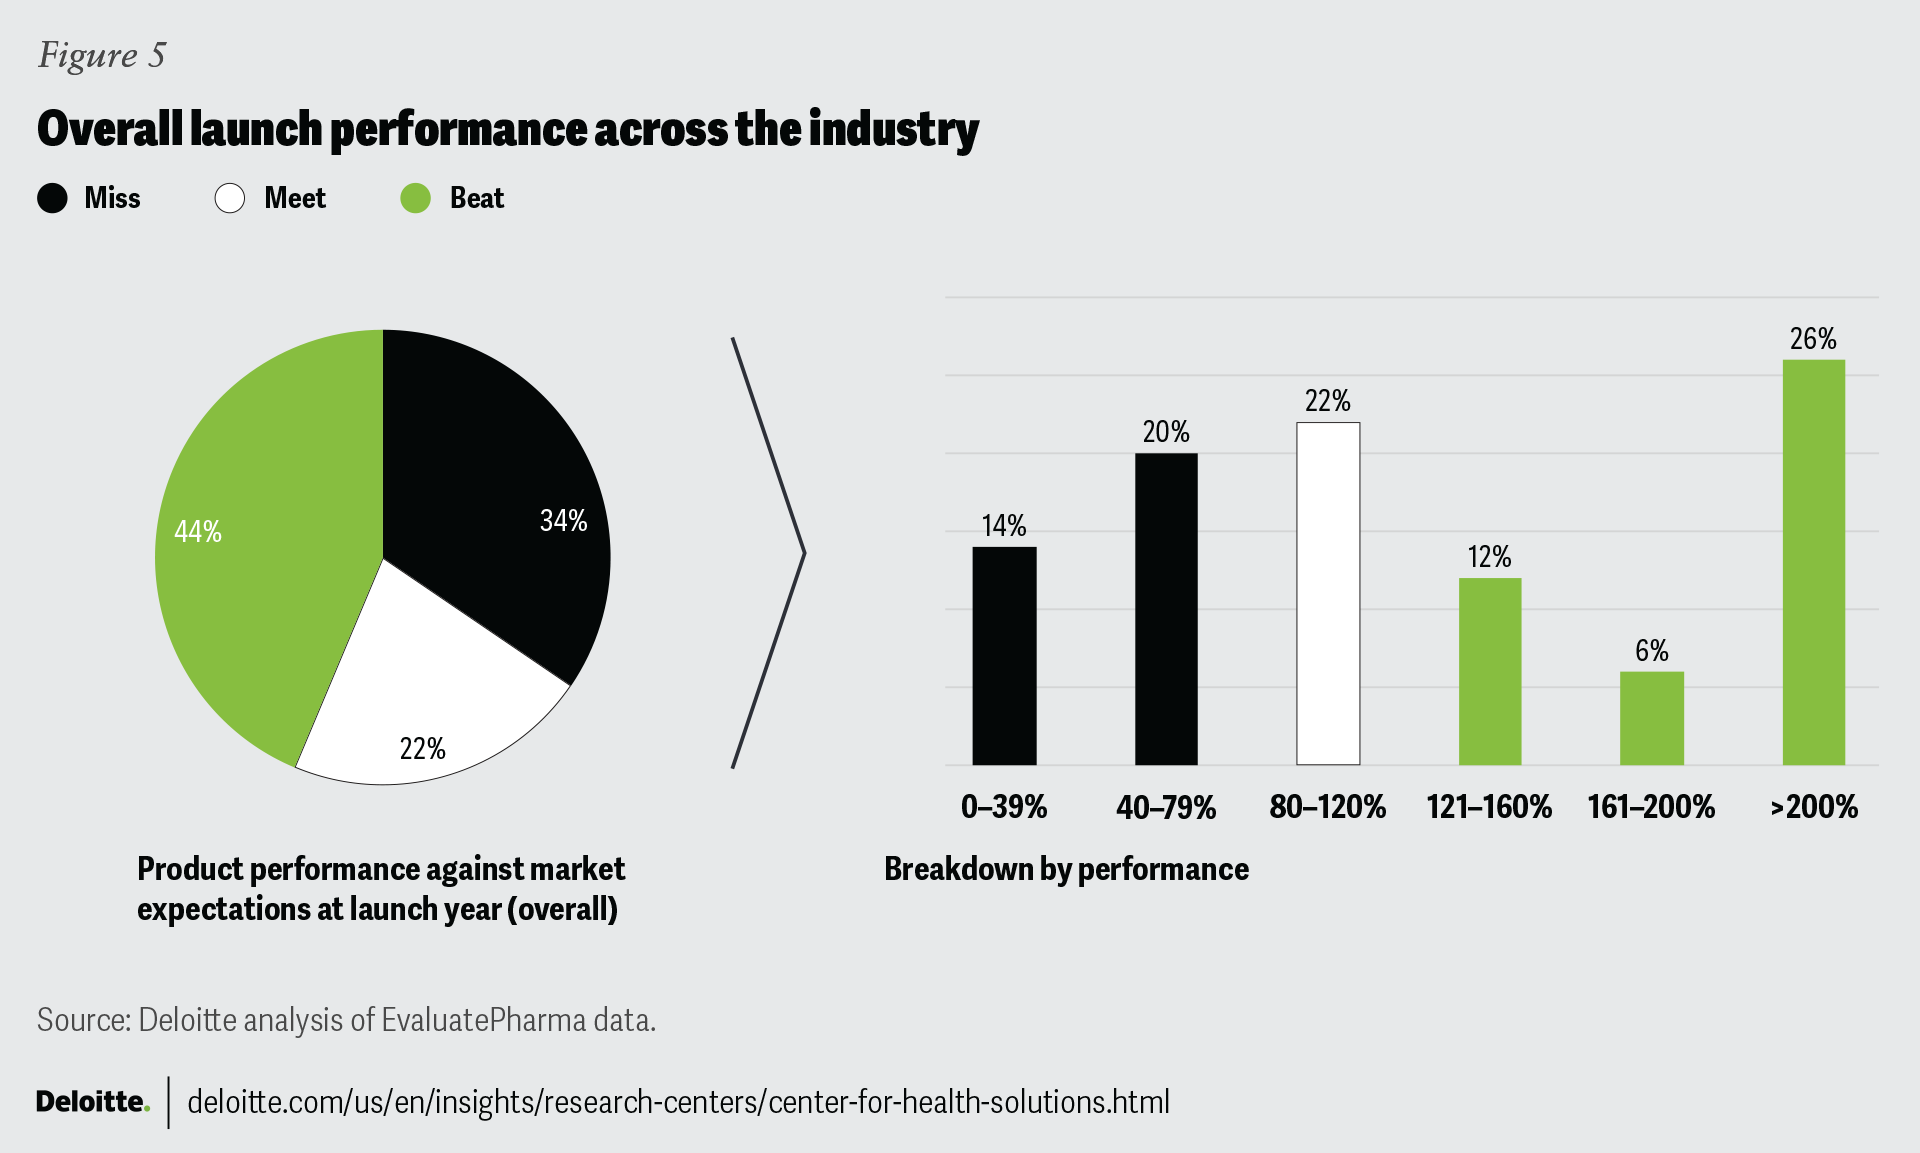
One-third of today’s drug launches miss expectations, according to the analysis conducted by the Deloitte Center for Health Solutions of 284 new drugs (new indications for both small molecule drugs and biologics) launched in the United States between 2012 and 2021. We compared the forecasts analysts made at the time of launch with the actual sales of novel drugs approved by the FDA’s Center for Drug Evaluation and Research to deepen our understanding of differences by company size and therapeutic archetype.
Meeting analyst forecasts is one important measure of a successful launch: Products that meet analyst forecasts in the first year have a high probability of continuing to do so in subsequent years. When considering sales in absolute dollar terms, launches from small companies (launch year revenue less than US$1 billion) appear to be in a category of their own due to far smaller revenues than launches from midsize (launch year revenue between US$1 billion and US$25 billion) or large (launch year revenue greater than US$25 billion) companies. Nonetheless, smaller companies’ experiences may offer useful lessons.
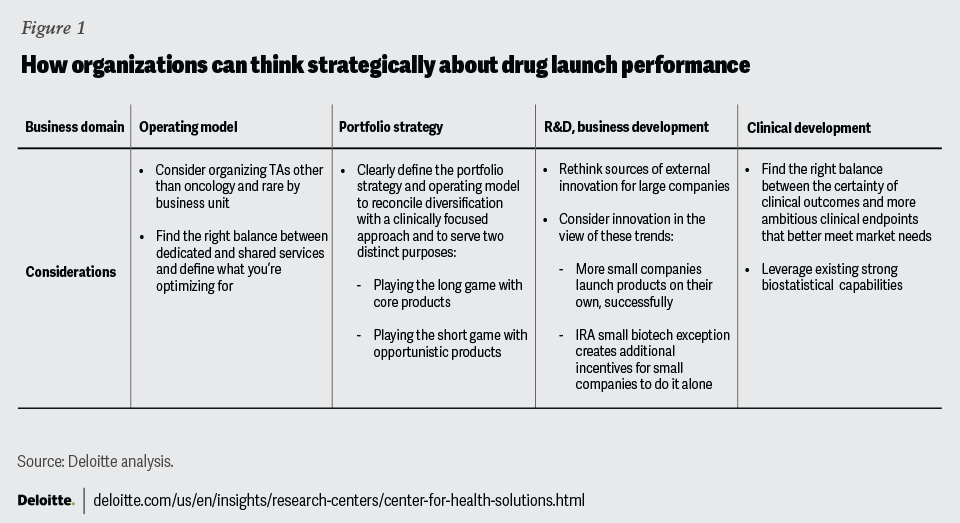
Similar to the 2020 analysis, we noted relatively low performances from large pharma companies and took a look at the reasons behind launches that miss expectations. Our view is that companies should treat launches not as isolated events that are the sole responsibility of brand teams but a reflection of a company’s overall strategy. And they should question whether their operating model, portfolio strategy, research and development, and ways of collaborating enable launch success (figure 1). Based on the findings of the analysis, we pose three strategic questions to help pharma companies think more holistically and jumpstart their preparations for future launches.
Is your operating model optimized for today’s market?
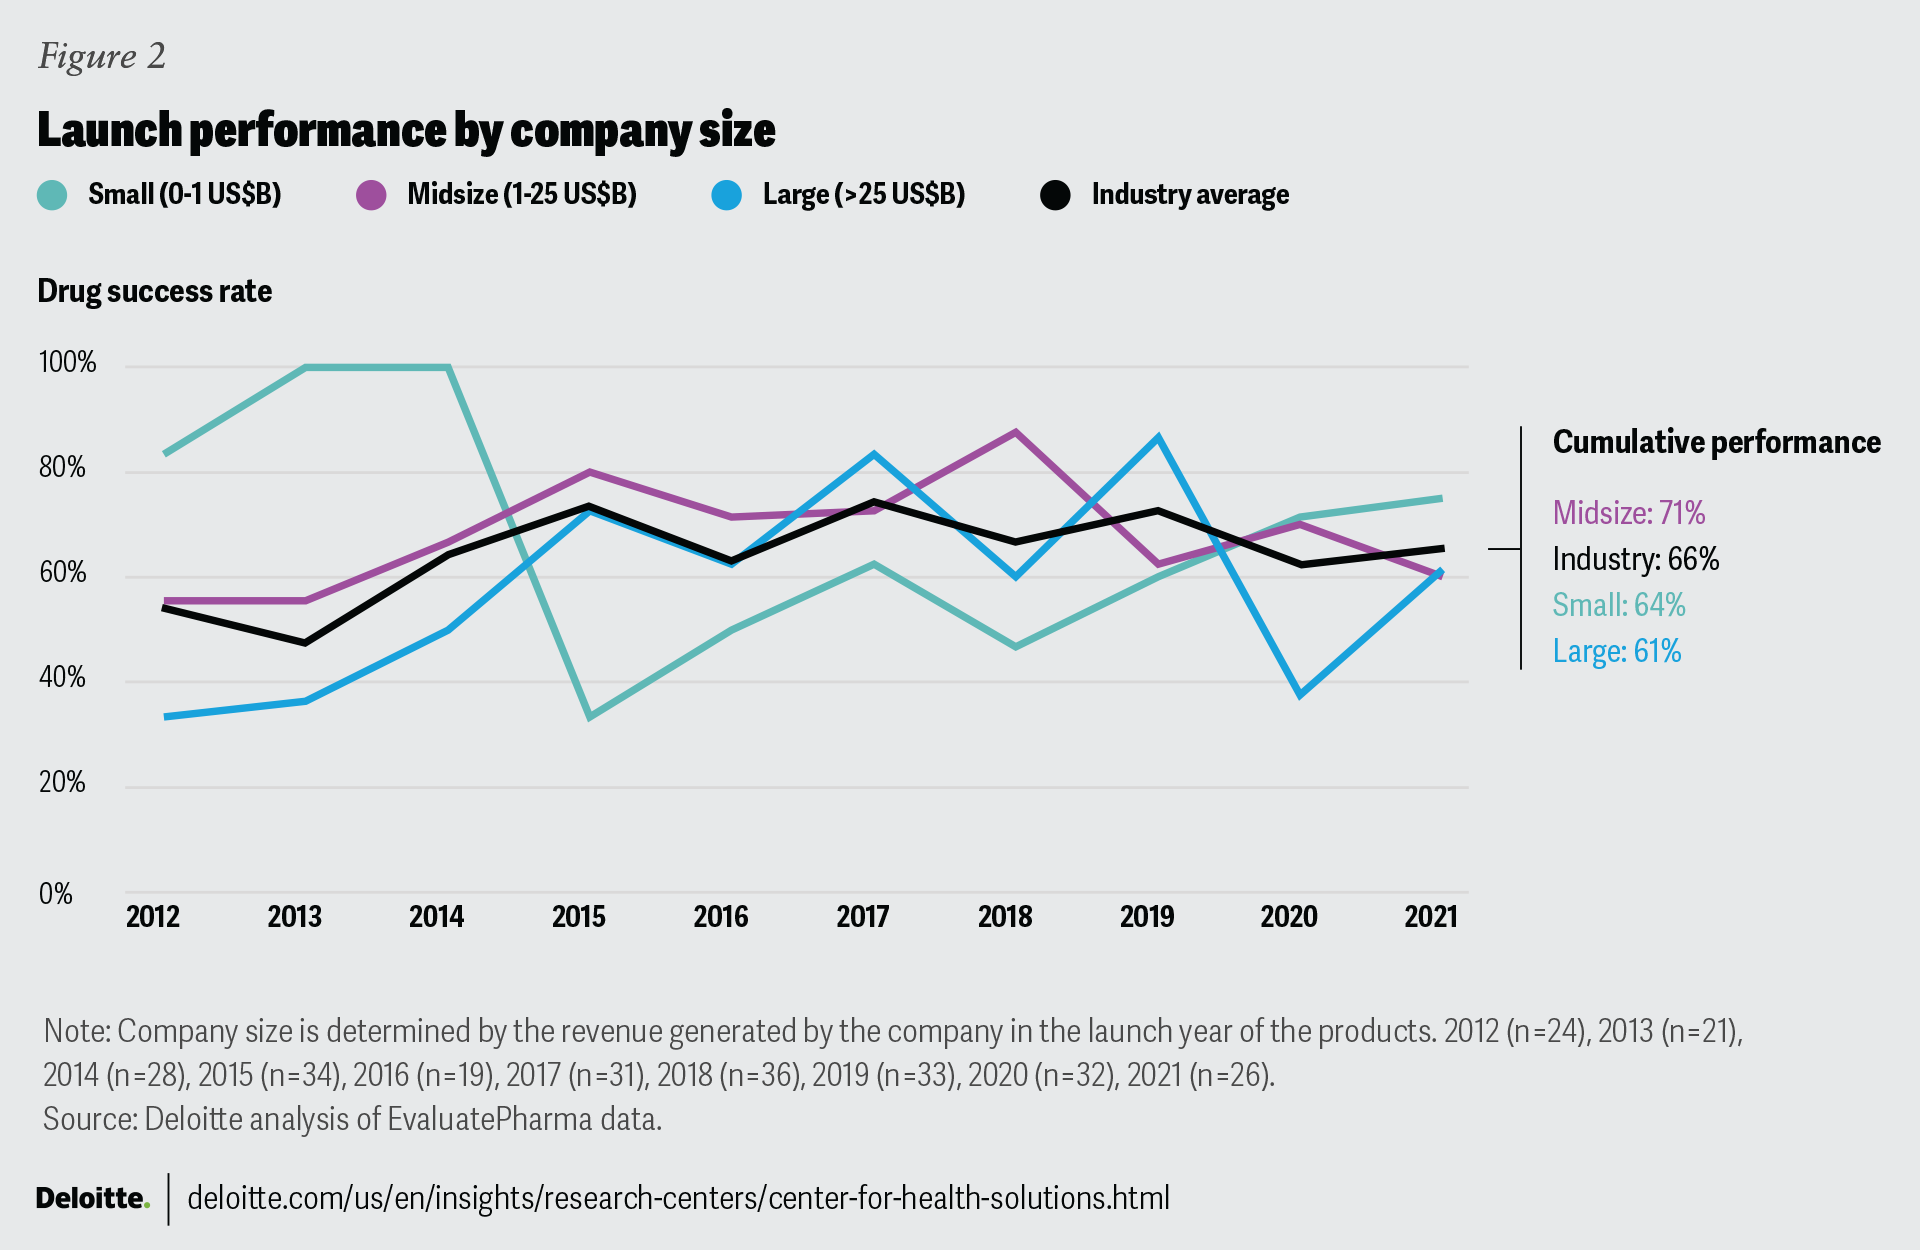
Over the years, midsize companies have outperformed the industry average in their ability to meet or exceed analyst forecasts. Although the differences do not reach statistical significance, the consistency over time warrants attention. While large companies generally track the industry average, their performance over time is most variable. The average revenue that launches generate in the first year varies widely: US$142 million for large companies, US$283 million for midsize companies, and US$40 million for small companies.
Except in 2019 and 2021, midsize companies have shown sustained above-average performance with less variability than the rest of the industry over the last 10 years (figure 2). Midsize companies may have the right number of people with a diversity of views that helps protect against tunnel vision, as well as sufficient depth of expertise and access to resources. At the same time, they are not burdened by bureaucratic organizational structures. Small companies are constrained by their scale and access to resources: They may have just a single asset and staff that are exceptionally knowledgeable but lack alternative perspectives due to small teams or having just a single expert. For large companies, we believe expertise is not a challenge in concept, but matching the right expertise to the right project, moving with agility and coordination, and overreliance on legacy playbooks and processes are common pitfalls.
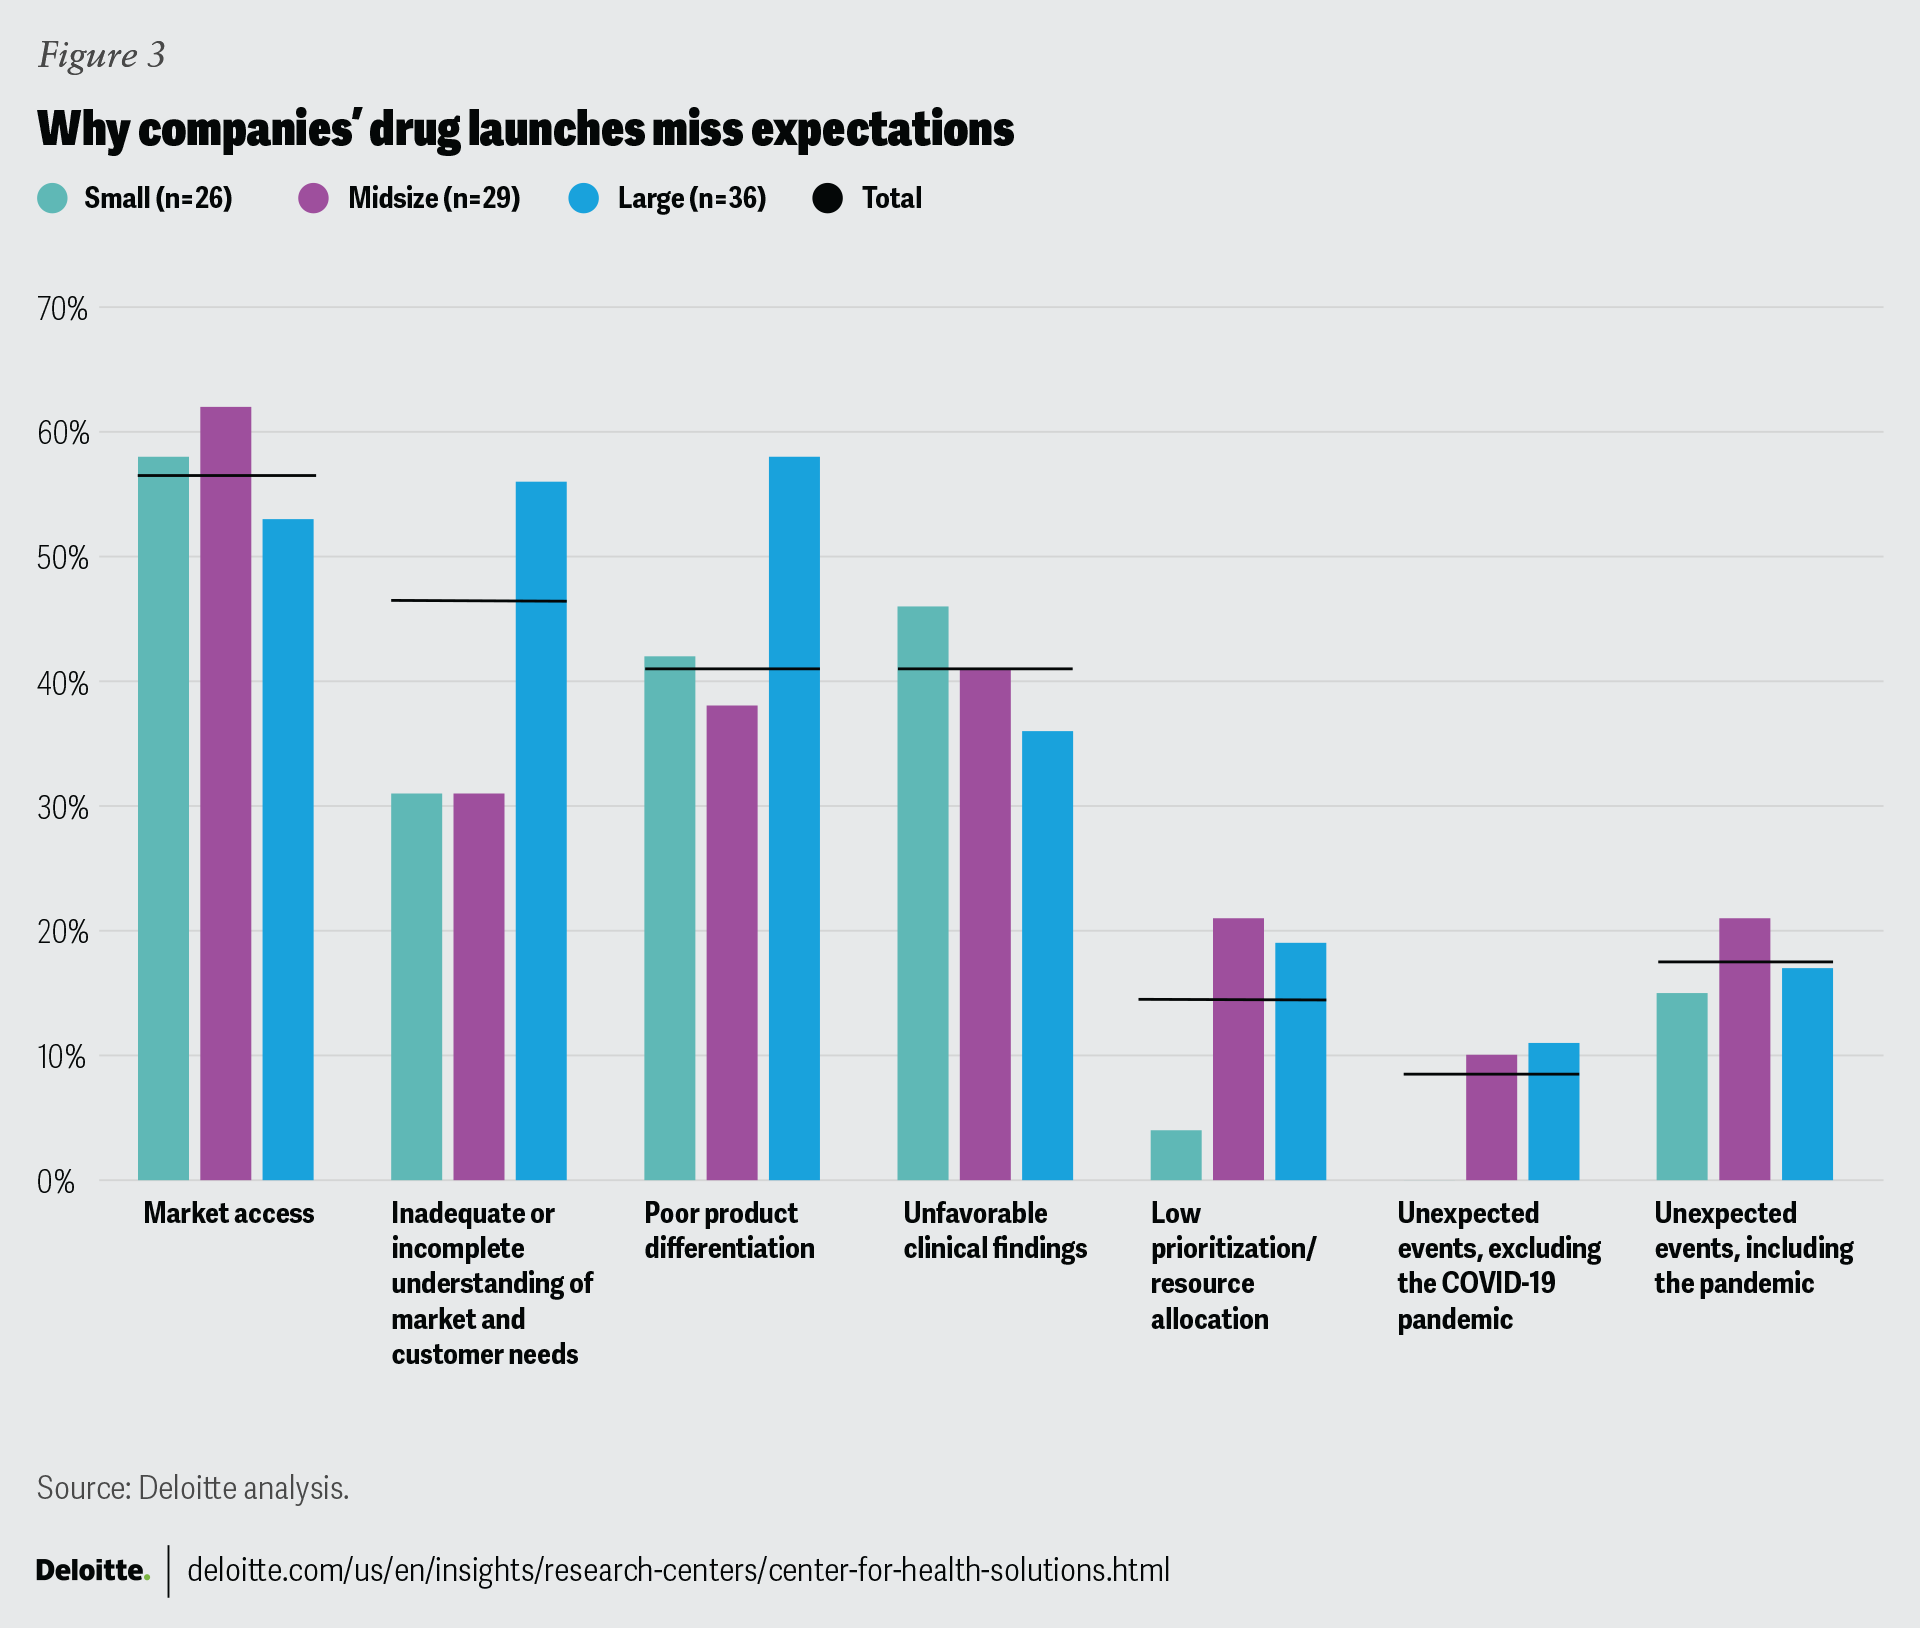
The reasons for missing analyst expectations (figure 3) also point to potential challenges with cross-functional coordination, especially at large companies. Launches by larger companies miss expectations due to an inadequate understanding of the market and poor product differentiation more often than launches by their smaller rivals. This can happen when clinical teams do not take input from commercial colleagues or perhaps the input comes in too late. As a result, important market insights might not get incorporated into the clinical development process. This can also happen when an asset is acquired or in-licensed, a common scenario for large companies. In such instances, the acquirer inherits the missed opportunities, and certain choices are already baked into the product development process. Both scenarios can have consequences during commercialization. For complex therapies, commercial teams should weigh in as early as phase 2 and sometimes even sooner, providing input on indication sequencing, product formulation, delivery mechanism, and forward-looking competitive assessments.1
But scale has advantages. For large companies, market access is less likely to be a reason for missing expectations, presumably due to stronger relationships and greater negotiating leverage with large payers and institutional buyers.
So how can large companies leverage the positive attributes of their size while being nimble like their smaller counterparts? Looking at existing operating models and asking whether they are fit for purpose and determining whether there is too much process complexity and competition for resources are two good starting points. Another avenue is to adjust legacy operating models that are optimized for blockbuster mass-marketed drugs, as portfolios continue to shift to specialty and rare disease products. For instance, many companies have moved their oncology and rare disease assets into separate business units, with dedicated resources (e.g., marketing, sales, medical affairs, insights and analytics, trade relations). Can this be the right model for other therapeutic areas (TAs)? Does the business unit approach encourage earlier collaboration between commercial, clinical, and medical affairs functions, and does it produce better cross-functional coordination around launch planning and product lifecycle management? If so, which functions should be dedicated vs. shared? And what should you optimize for in making these decisions: speed and agility, cost, or collaboration?
Can you play the long and short games at the same time?
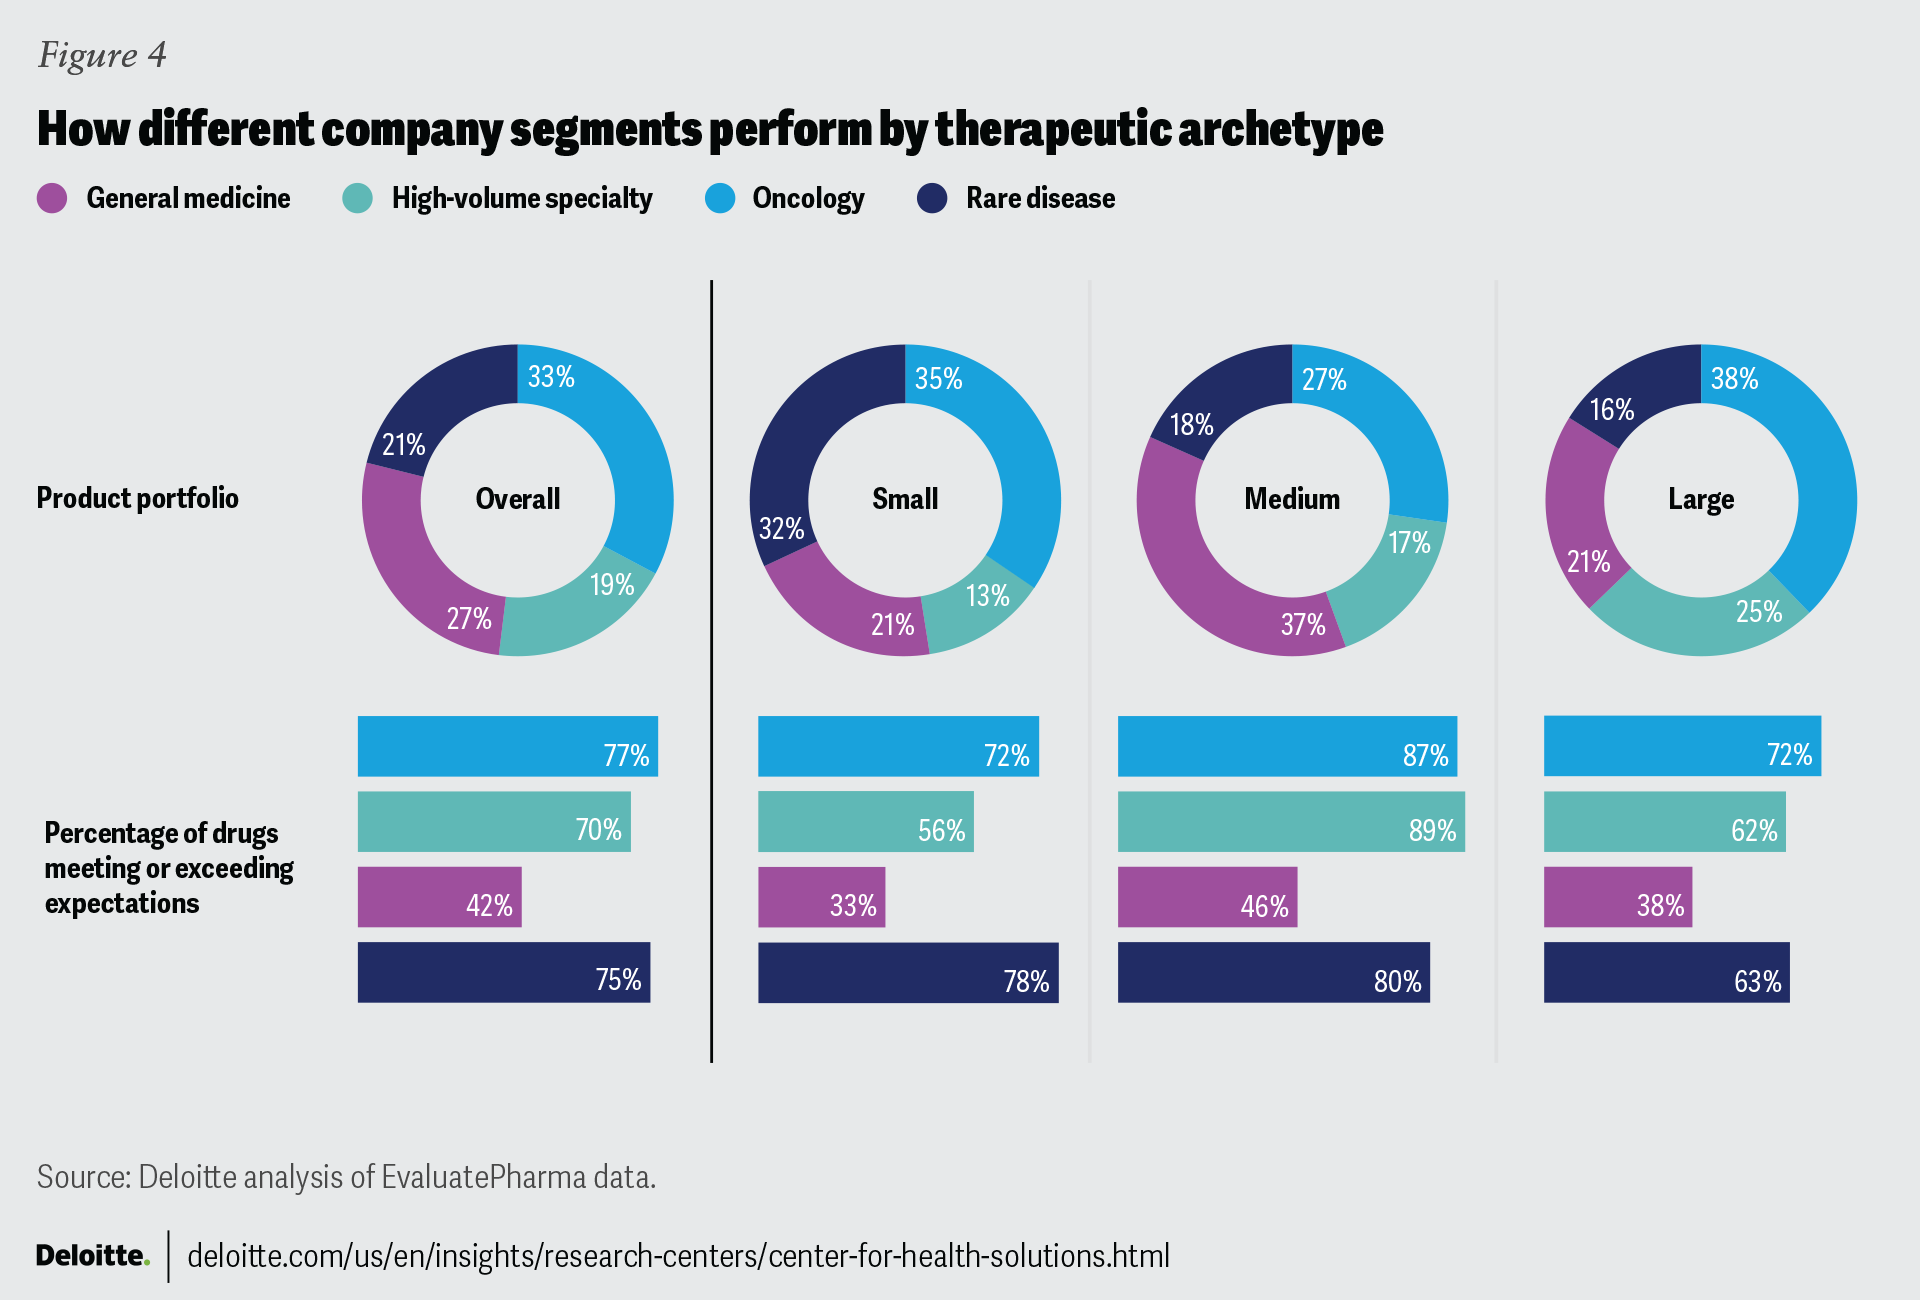
We observe a consistently strong track record from midsize companies across all four therapeutic archetypes (figure 4).
Launching general medicines has become exceptionally challenging: More launches (58%) miss expectations than meet or exceed them (42%). General medicine products usually have a large number of competitors, including generics. Additionally, the market’s willingness to pay is low and the threshold for safety and efficacy is high.2 The so-called small molecule penalty in the Inflation Reduction Act (IRA) is expected to further curb pharma’s appetite for developing and commercializing general medicine products,3 which are almost always small molecule drugs. But even with general medicine products, midsize companies do markedly better (46%) than large companies (38%). And this seems counterintuitive: Large pharma’s commercial model should be well-suited for highly competitive and commoditized general medicine products that require scale, sizeable sales forces, large direct-to-consumer ad spending, contracting prowess, and relationships with institutional buyers and distributors, and where historically large pharma has held clinical expertise.4
For similar reasons, high-volume specialty should be a sweet spot for large companies. Commercializing these products also requires large investments, sophisticated payer contracting, strong trade relations, and robust hub services. Yet, our analysis shows that large companies’ launch performance is significantly lower than midsize companies.
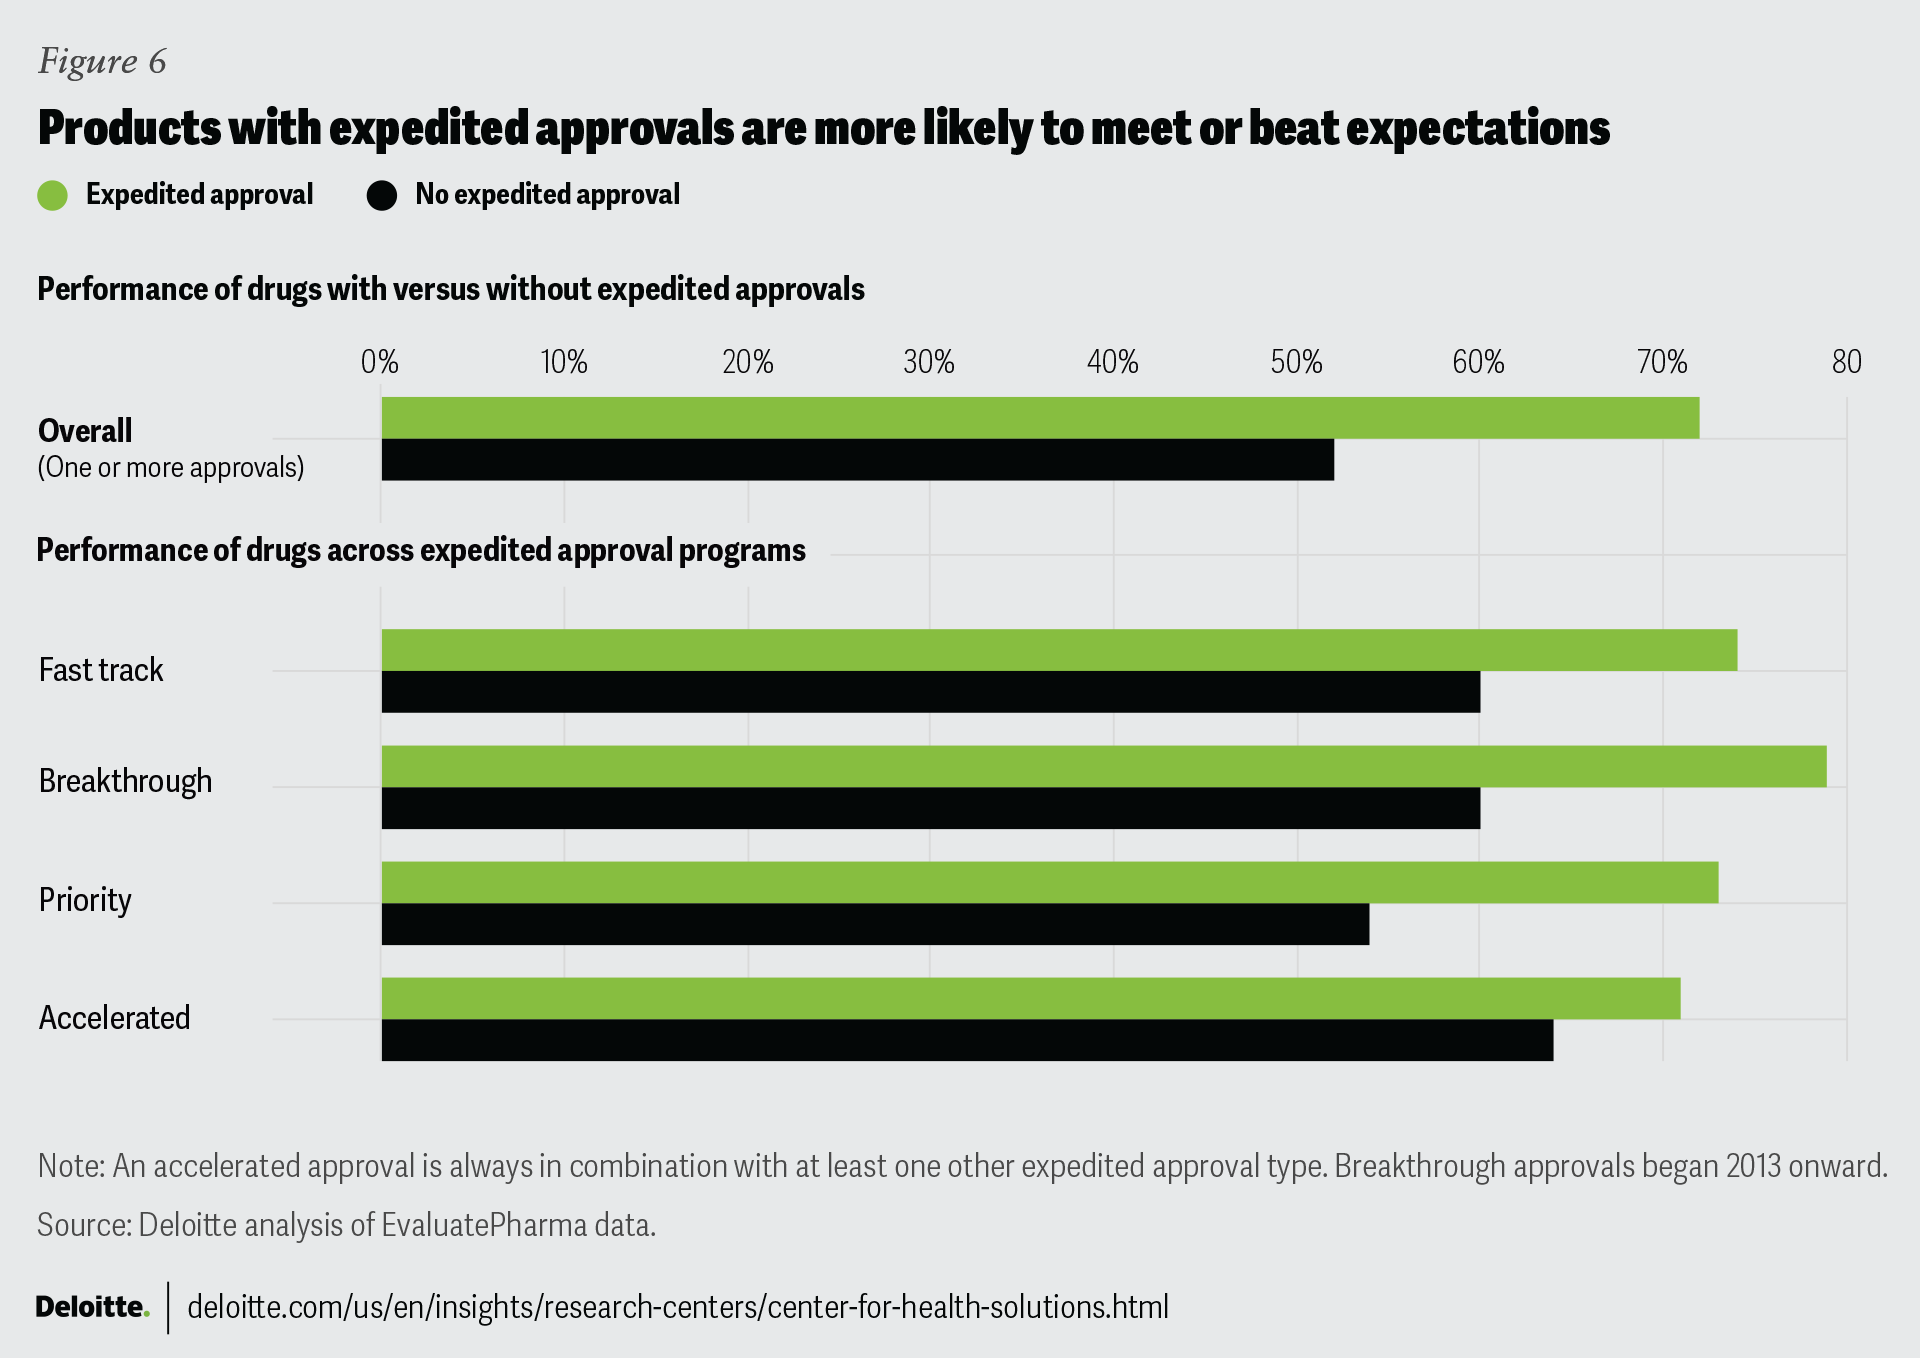
All company segments do well with oncology launches; midsize and small companies do well with rare disease launches. As we determined in our previous research and confirmed again, products receiving any type of expedited approval are more likely to meet or exceed expectations. Because these approvals are granted when there is a large unmet need in the market, they may be seen as a proxy for novelty or significant clinical advancements over existing therapies. Almost all oncology products (94%) and a large proportion of rare disease products (80%) have at least one expedited approval, which contributes to their strong launch performance. Additionally, because of expedited approvals, launches for oncology and rare diseases may get greater visibility and resources. Among high-volume specialty drugs, 59% have any kind of an expedited approval and among general medicine products only 29% do.
The reason we believe midsize companies do better across all four therapeutic archetypes is because they tend to be less diversified than large companies and are able to maintain a defined clinical focus backed by years of investments to develop this expertise and cultivate relationships with customers and key opinion leaders. This is reflected in their better ability to meet market needs and deliver differentiated products: Launches by smaller companies are less likely to miss expectations due to these factors (figure 3).
Some large companies choose diversification as a strategy, and at first glance, diversification does not seem compatible with a clinically focused approach. But does it have to be a contradiction? Perhaps it is possible to reconcile the two if the portfolio strategy and the operating model are clearly defined to serve two distinct purposes: playing the long game with core products versus the short game with opportunistic products.
Core products reflect a company’s clinical specialization: This is where it has built its brand, track record, and stakeholder relationships, and how it’s become a destination for talent. These assets are typically developed in-house or acquired at an early stage. Core portfolio strategy is about a vision, a product mix that will help achieve this vision and drive future growth, and the discipline to walk away from a deal or clinical asset that is a poor fit or from making investments that do not yield immediate returns. The operating model to support core products may tolerate some inefficiencies in the service of achieving the vision.
Pursuing opportunistic products may resemble financial engineering, especially when it is done to satisfy Wall Street’s short-term earnings expectations. Here, the operating model powered by mergers and acquisitions should emphasize financial metrics, efficiency, agility, and speed to market, with corresponding implications to culture and talent.
Are you playing it too safe?
Unfavorable clinical findings are one reason that small companies miss expectations more often than large companies. We can interpret that one of two ways.
One is that small companies’ biostatistical capabilities are limited and they often outsource clinical trial design and development.9 This lack of experience makes them more prone to oversights that can lead to unanticipated clinical outcomes. Large companies, on the other hand, have more sophistication, experience, and in-house resources to design and execute clinical studies that pass regulatory muster. Plus, their methodologies around the probability of technical and regulatory success are well-tuned to estimate likely outcomes.
Another way to think about the mismatch is that the reasons a company might miss launch expectations are interdependent. And unfavorable clinical findings tend to be somewhat contrary to poor product differentiation and inadequate understanding of market needs. The interpretation that follows is that smaller companies take bigger risks aiming for clinical endpoints that are better aligned with customer needs. And while large companies are more successful at getting their products through clinical trials because their clinical goals are simply less ambitious, this comes at the expense of meeting market needs and product differentiation.
This brings us to another strategic question: What is the right balance and tradeoff between the certainty of clinical outcomes and ambitious clinical endpoints that truly meet market needs?
Launch success: An organization-wide effort
Based on our analysis of drug launches over the last 10 years, we do not see a significant change in launch performance, overall. Although there is a slight performance improvement compared to our 2020 analysis, the reasons that drug launches miss expectations have largely remained the same. Our interpretation is that as the market continues to evolve, companies’ traditional organizational structures and approaches have not kept pace.
Through our analysis, we have concluded that a company’s overall performance is reflected in the way their drug launches perform. As such, companies have the opportunity to rethink their operating model, portfolio strategy, and research and development, as well as their ways of working and collaborating. Companies should think of their drug launch strategy as an organization-wide effort that involves all organizational functions and requires diligent planning and synchronized collaboration.
Appendix
Appendix 1. About the study
The study included all new drugs approved in the United States by FDA’s Center for Drug Evaluation and Research between 2012 and 2021, for which data was available in EvaluatePharma. Diagnostic agents and biosimilars were excluded from the project scope. We also excluded drugs with low actual sales (less than US$50 million over the first three years), except drugs launched in 2020 and 2021—for these years, actual sales data was not yet available.
For this analysis, we considered analyst forecasts to be a general reflection of market expectations for new products and used historical consensus forecasts, as identified by EvaluatePharma, issued at the time of FDA approval. Later revisions to the original forecasts based on actual sales were not considered.
Actual sales and analyst projections for the United States were captured for three years. Year 1 (launch year) is considered from the first year when sales data was reported by the company. For products approved and launched in the last quarter of any calendar year, we treated the next calendar year as year 1 (or launch year). For example, for products approved and launched in the fourth quarter of 2012, 2013 is year 1 in our analysis.
In case of product transfer or company acquisition, actual sales data is captured from both the originator and the acquiring company, while company characteristics are from the company responsible for the product launch.
We used the correlation test to measure statistical significance of trends over years. We used the chi-square test to compare within-group variance between company segments. We used the chi-square test to also compare launch performance across comparison groups.
To identify the reasons for missing analyst expectations, we used analyst reports from Refinitiv and Biomedtracker and news reports from multiple sources. The information in the reports was available for 91 out of 98 drugs that missed expectations.
Criteria and definitions used in the study
Performance against analyst expectations:
- Missed: Drugs generating up to 80% of expected sales
- Met: Drugs generating between 80% and 120% of expected sales
- Beat: Drugs generating more than 120% of expected sales
Company size based on annual revenue at the time of each product launch:
- Small: Less than US$1 billion
- Midsize: Between US$1 billion and US$25 billion
- Large: Greater than US$25 billion
New drugs: New molecular drug entities, including New Drug Applications and Original Biologics License Applications approved by the FDA between 2012 and 2021.
Specialty drugs: Drugs classified as specialty by major payers
Orphan drugs: Drugs whose initial indications received orphan designation from the FDA
Rare disease drugs: Drugs for diseases with extremely low prevalence (fewer than 6.37 in 10,000 people)
Benefit type (hospital-administered drugs were excluded from the analysis):
Pharmacy benefit: All oral, topical, and subcutaneous (unless package insert said health care professional (HCP)-administered)
Medical benefit: Intravenous and intramuscular and some subcutaneous (when PI said HCP-administered)
Appendix 2. Overall launch performance
While in aggregate, 66% of drugs in our analysis met or exceeded expectations, the longitudinal trend may point to an improvement: From 2014 onward, the industry’s performance has averaged at 68% and has remained relatively stable.
Consistent with our previous research, our analysis shows that drug performance in year 1 remains highly predictive of product performance in two subsequent years.
Of the 34% of the drugs that missed expectations at launch, only 26% managed to reverse the trajectory either in year 2 or in year 3, and only 18% reversed course in both year 2 and year 3.
Of the 66% drugs that met or exceeded expectations at launch, 77% and 70% continued to meet or exceed analyst expectations in year 2 and year 3, respectively.
Appendix 3. Launch performance by product characteristics
In line with our 2020 study, certain product characteristics are strongly associated with better drug launch performance: expedited approvals (72%), orphan drug designation (76%), specialty drugs (71%), first-in-class drugs (67%), and reimbursement through the medical benefit (73%).
Our analysis shows that across different types of expedited approvals—fast track, breakthrough therapy designation, priority review, and/or accelerated approval—72% of the products with one or more expedited approvals have met or beat expectations. But only 52% of products without an expedited approval meet or beat expectations.
Appendix 4. Launch performance by company size across product characteristics
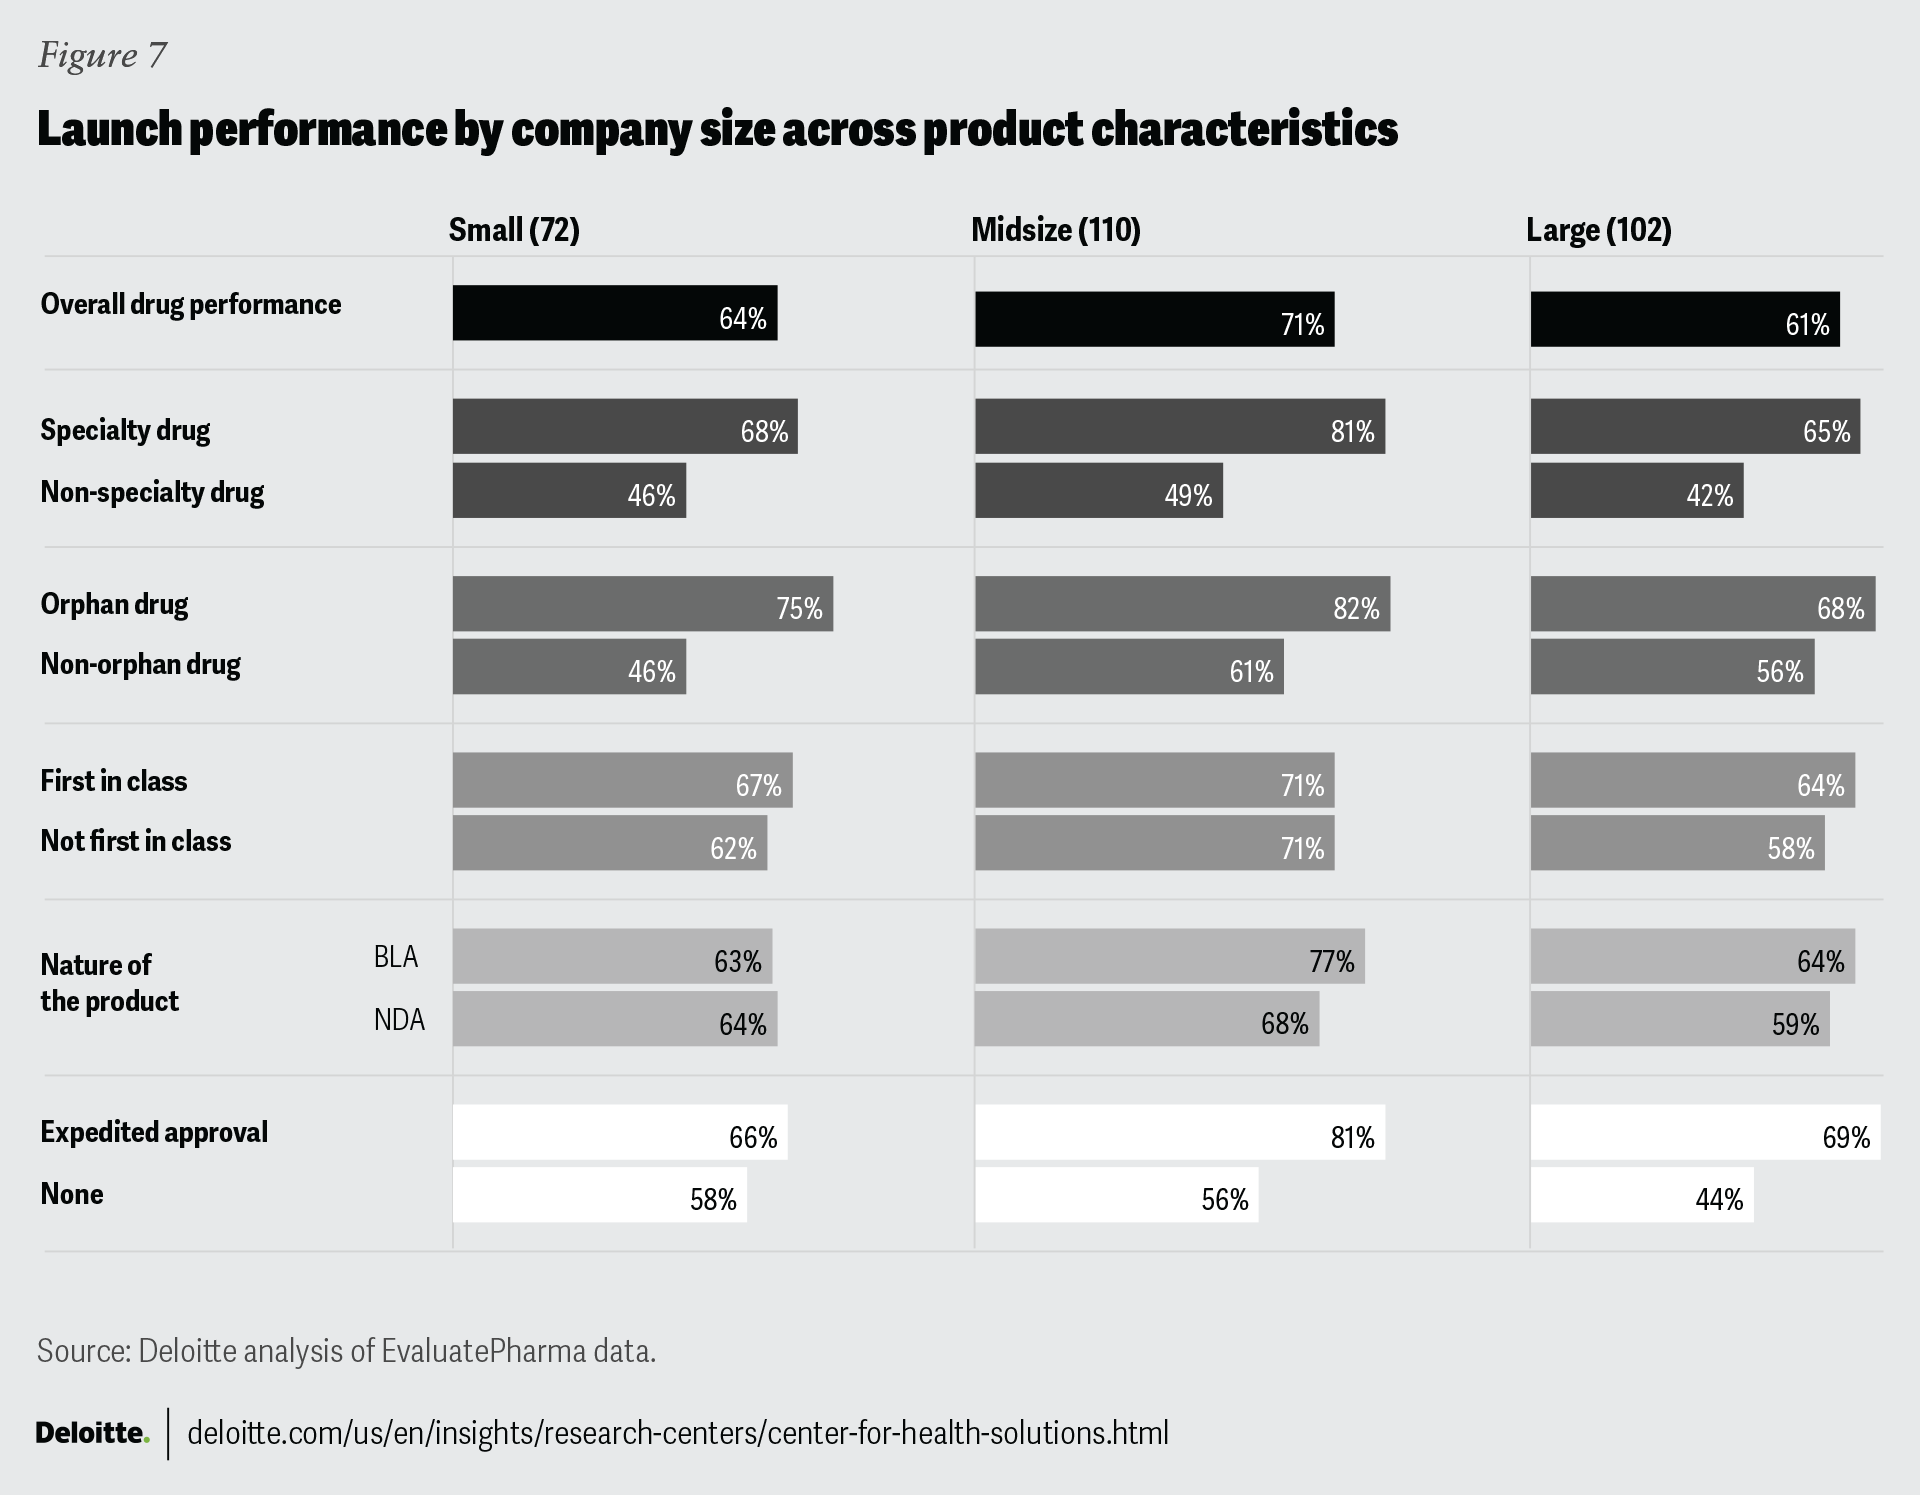
Launches from midsize companies were more likely to perform better than smaller and larger companies regardless of the product characteristics.
Jeff Ford
Brian Corvino
Alex Blair
Natasha Elsner
Madhushree Wagh
The authors like to thank the following from the project team:
Darshan Gosalia who has contributed to organizing the findings, helped with analysis, and conducted secondary research.
Pavan Kumar Bhoslay who has worked on the data analysis to provide valuable insights.
Namrita Negi, Rachel Johnson, Minhhy Truong, Scarlett Zheng, Sapna Vijayakumar, Shaye Morrison, Sayantan Choudhury, Mayuresh Gaikwad, and Anmol Bansal who’ve provided industry expertise and led secondary research to analyze the reasons for missing launch expectations.
The authors would also like to thank John Jaeger, Tom Yang, Candy Lurken, Alessandro Ucci, Mathias Cousins, Carl Engle, Rob Jacoby, Holly Darov, Kristina Schapiro, Thibault Ducarme, Wendell Miranda, Debra Assay, Rajesh Medisetti, Anjan Roy, Rebecca Knutsen, Laura DeSimio, Zion Bereket, and the others who have contributed to the success of this project.
Cover image by: Sonya Vasilieff
More from the Deloitte Center for Health Solutions
Access more insights for the hospitals, health systems & providers, pharmaceutical manufacturers, health plans & payers, medtech & health tech organizations sectors.