Shifting value chains and capital flows are transforming oil and gas M&A
A new deal trigger zone, natural gas M&A set for breakout, yield-over-growth focus, converging megamerger drivers, and evolving private flows are reshaping the industry’s M&A landscape
This analysis was prepared and finalized based on market information and developments available as of December 2025.
Key takeaways
- Oil and gas (O&G) mergers and acquisitions are shifting from price-driven cycles to tech- and capital-led disruptions.
- Profit pools are shifting across the O&G value chain, setting up new trends in future M&A.
- The M&A trigger zone has shifted down by nearly US$15 per barrel; the new “buy zone” now sits at US$45 to US$55 per barrel.
- Natural gas is back in the M&A spotlight—this time backed by strong demand drivers.
- Focus on payouts may weigh on growth via M&A, but generative AI and equity deals are bright spots.
- Private equity is redeploying capital to export- and growth-oriented infrastructure opportunities.
- Six converging external developments suggest megamergers may be on the horizon.
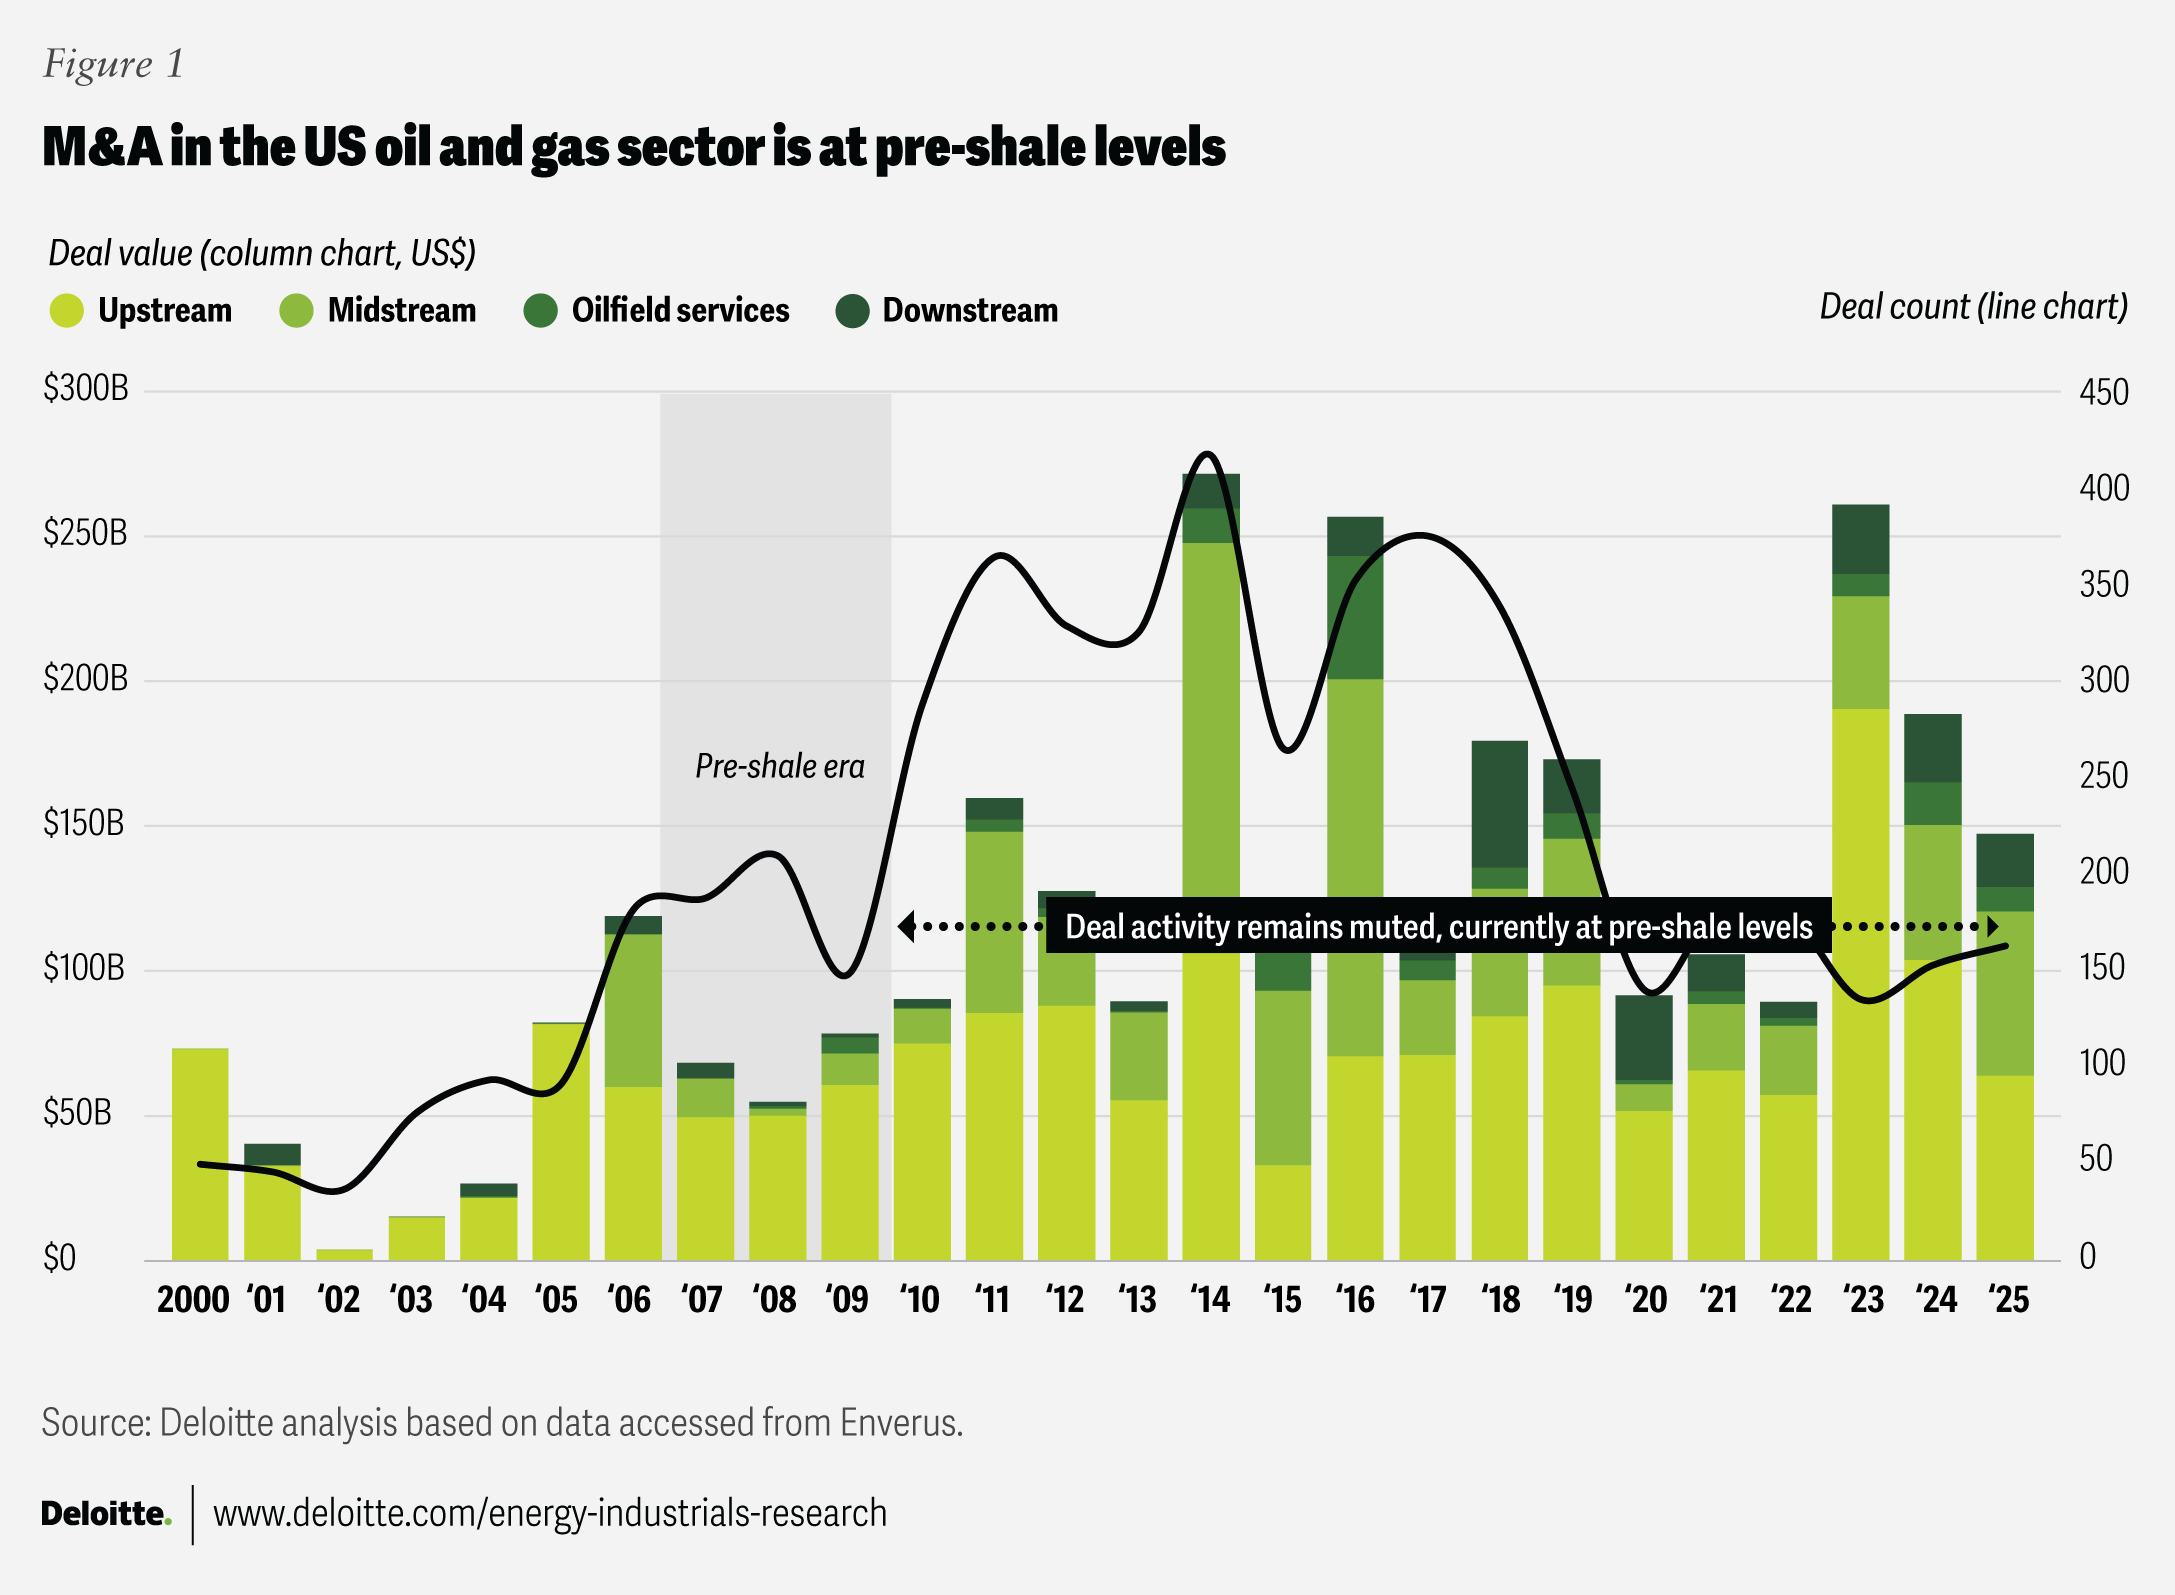
Mergers and acquisitions in the oil and gas industry have hit an inflection point, with traditional drivers such as oil price volatility, reserve replacement, and asset lifecycle management playing a diminished role. Despite some large deals in 2023 and 2024, US oil and gas M&A activity remained subdued between 2020 and 2025. In fact, the 2021 to 2025 average deal value and deal count were about 4% and 44% lower, respectively, than the 2016 to 2020 averages.1 This reflects a shift toward balance sheet strength and portfolio optimization over opportunistic buying, with 2025 deal volumes close to pre-shale levels despite the robust capital markets and supportive policy environment (figure 1).2 Within this landscape, upstream and midstream segments have demonstrated resilience, while oilfield services and downstream sectors have experienced relative weakness.
Table of Contents
- Key takeaways
- A new deal trigger zone
- Natural gas-based M&A
- Yield over growth
- Private equity flow
- Megamergers
- The future of oil and gas M&A
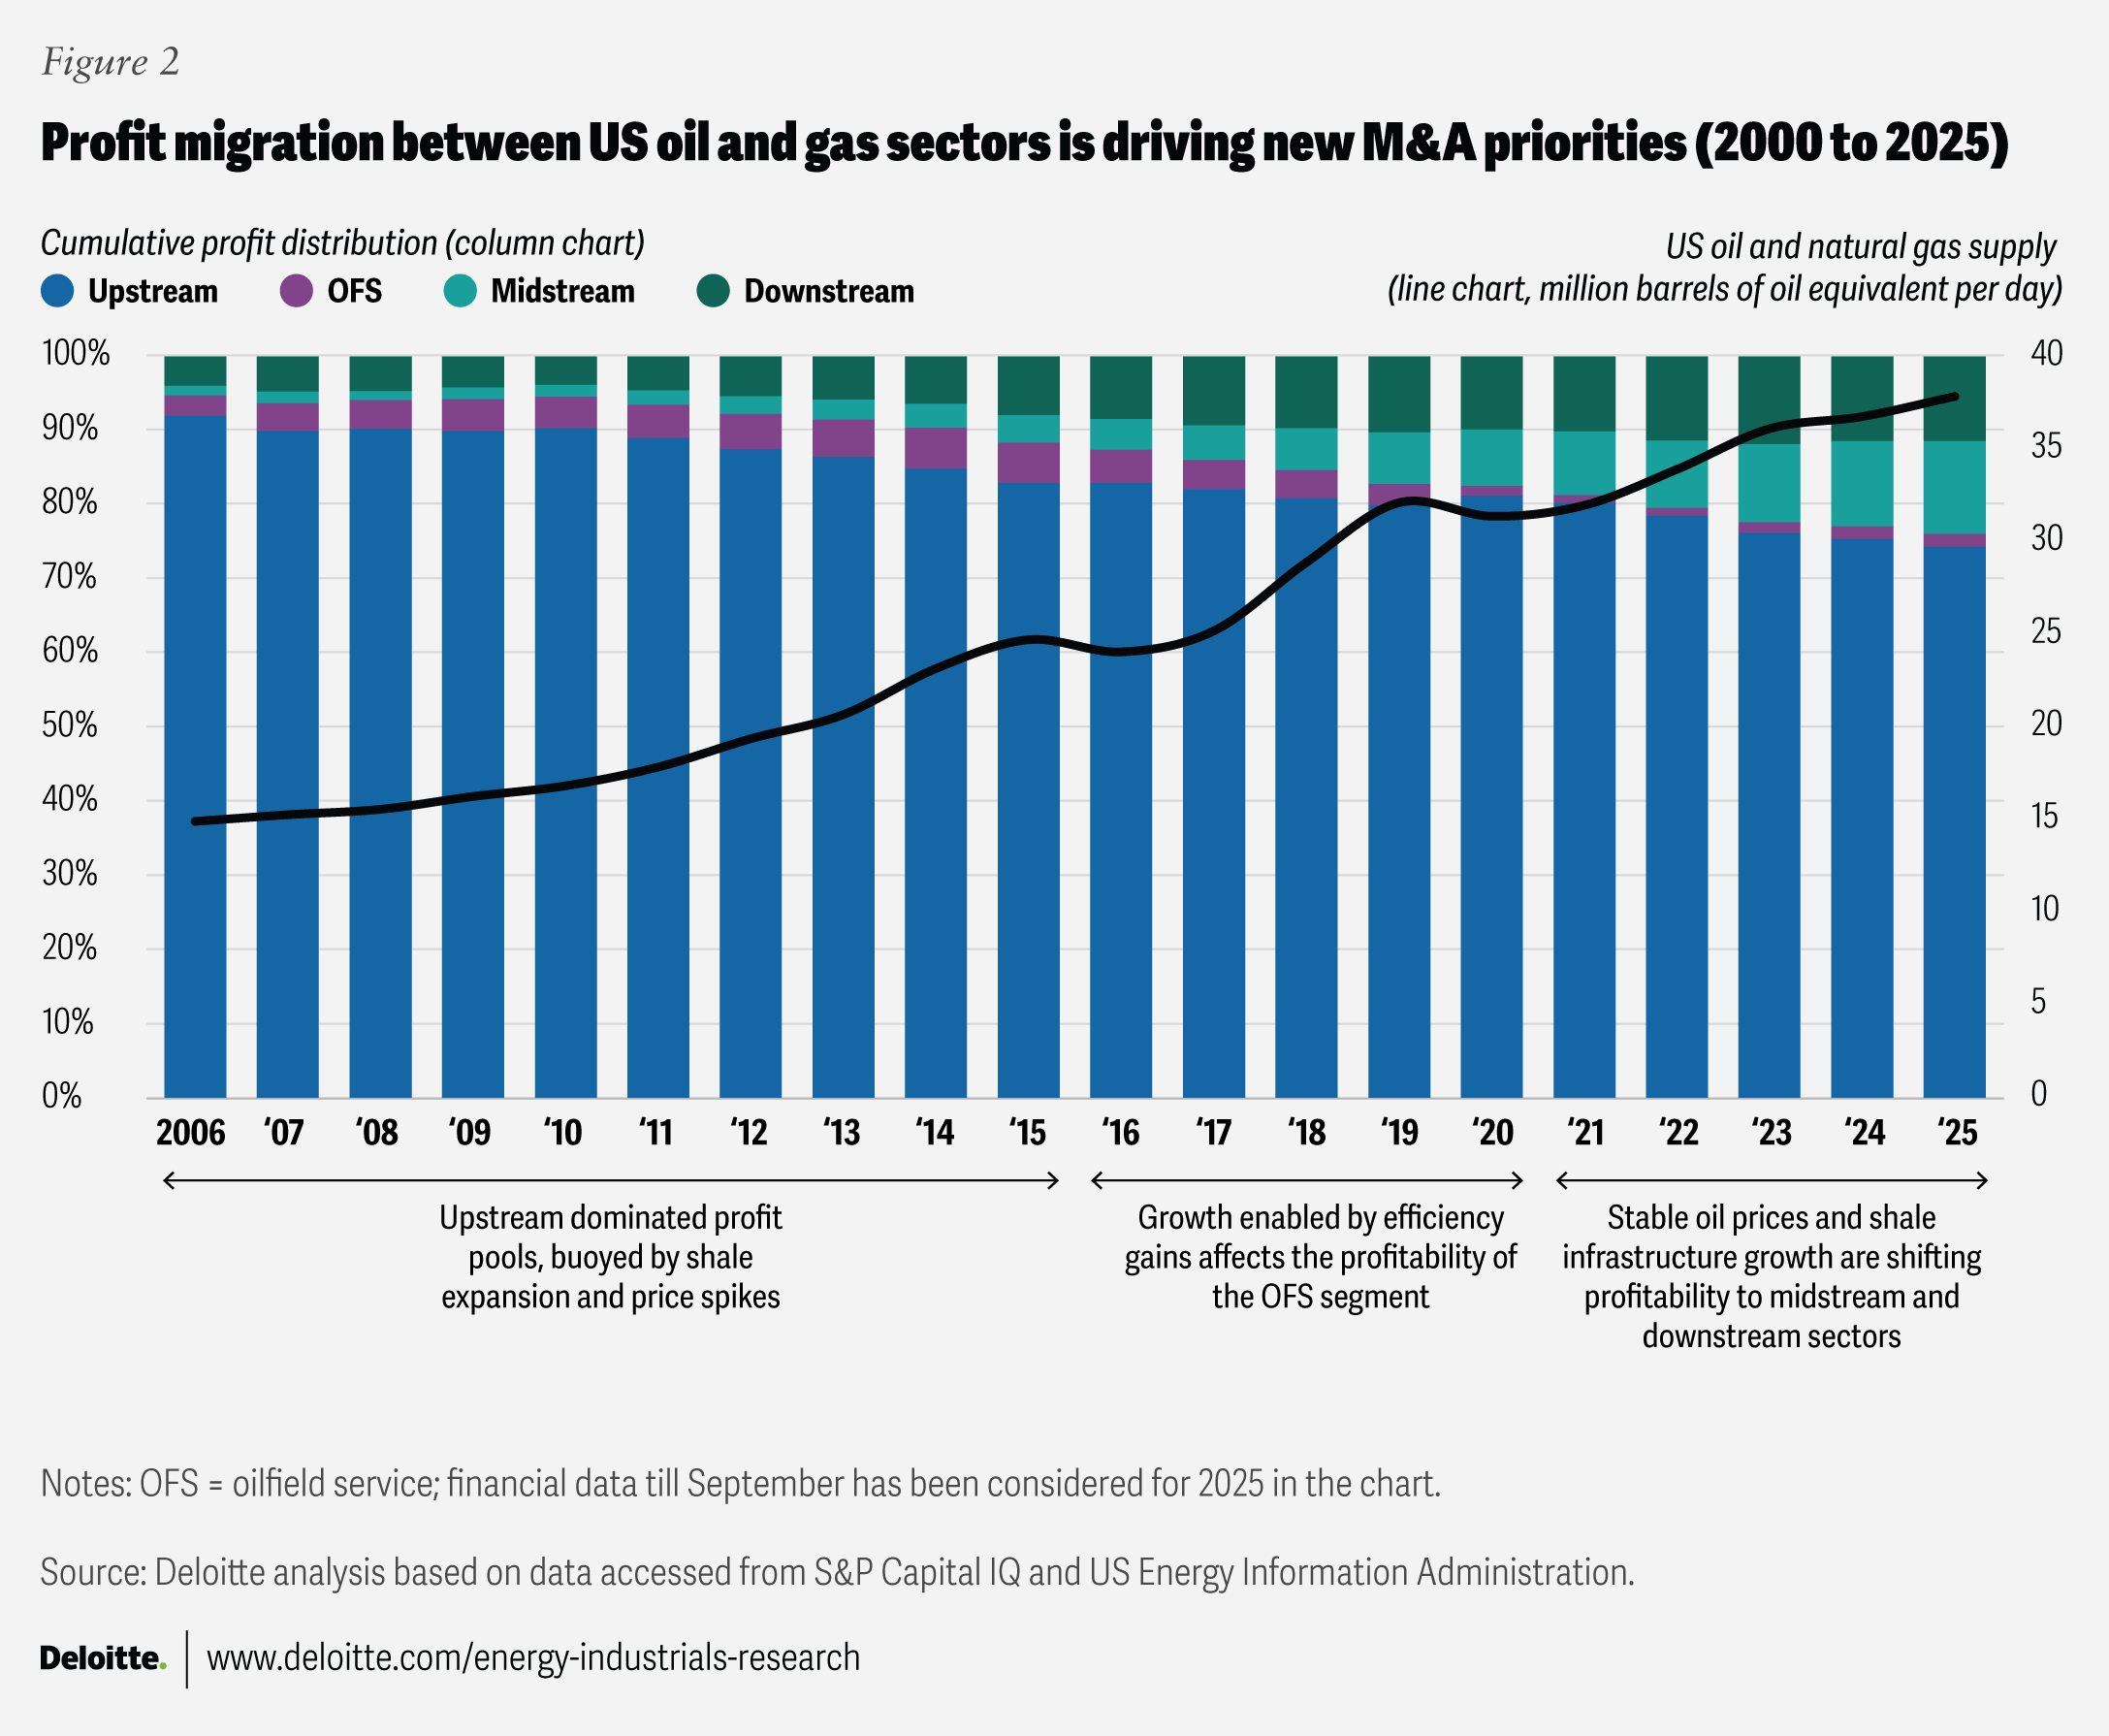
This new M&A landscape reflects a shift in financial strength across the O&G value chain, as the share of midstream in cumulative net profit has nearly tripled, whereas the share of oilfield services has halved over the last decade (figure 2). The rise of the midstream augurs well for all O&G subsectors, enabling them to better navigate supply challenges and seize future opportunities—from expanding global trade to meeting the rising energy demand of data centers. The distinct impacts and dynamics for each subsector are detailed below.
- The upstream sector continues to dominate oil and gas dealmaking, accounting for 43% of deal value and 57% of deal volume in 2025.3 Shifting commodity margins are reshaping buyer criteria, as gas-weighted assets—historically delivering EBITDA margins of approximately 11% below oil-weighted peers—become more competitive amid improving demand visibility. At the same time, premium oil-rich acreage in core basins such as the Permian remains highly sought after, with the value of contiguous positions rising as operators drill longer laterals enabled by automation and emerging semi-autonomous technologies.
- Oilfield services deal activity remains constrained by upstream capital discipline and subdued drilling, with only 18 transactions totaling $8 billion in 2025.4 While prolonged stress may drive further consolidation or restructurings, it also creates opportunities for strategic turnarounds and technology-led investments. Digitalization and automation are stabilizing employment cycles and supporting margins, while leading oilfield services players are expanding into adjacent services and AI-enabled offerings, signaling a shift toward higher-value, technology-driven revenue streams.
- Midstream continues to witness resilient M&A activity, with 35 deals worth $57 billion in 2025.5 Growth in natural gas infrastructure will likely spur innovation in general partner or limited partner models and attract new market entrants, with general partners backed by private equity (PE) firms increasingly acting as sponsors and aggregators to build scaled platforms. These models combine stable, long-duration cash flows with growth exposure to liquefied natural gas (LNG), data centers, and decarbonization, while offering limited partners access to larger, more customized transactions.
- The downstream sector is undergoing a structural transformation, steering the industry away from many headline large deals toward strategic mid-market transactions. However, assets benefiting from capacity rationalization, advanced catalyst technologies, high-value chemical synergies (notably for semiconductors and electric vehicles), and technology-driven efficiency gains will likely remain in demand.
While there has been a shift in industry strategy toward capital discipline and portfolio alignment, is it a permanent reset? Or is it a momentary slowdown before transformation? Which scenario plays out may depend on how the following five pivots unfold in the years ahead.
1. A new deal ‘trigger zone’: How far must oil prices fall to reignite M&A?
Oil’s buy zone is no longer US$60 to US$80 per barrel. Buyers may hold out for a steeper drop.
A review of 25 years of oil and gas M&A data reveals that deal activity accelerates when crude prices (West Texas Intermediate) fall into the US$60 to US$80 per barrel range—buyers’ typical “trigger zone” (figure 3). While M&A has at times remained robust above US$80/bbl, such periods are increasingly uncommon and misaligned with current market fundamentals, particularly in the downstream.6 With current prices at around US$60 to US$65 per barrel—both within the trigger zone and below the long-term average of US$75 per barrel—historical data suggests M&A activity should increase if prices hold steady at this level.7
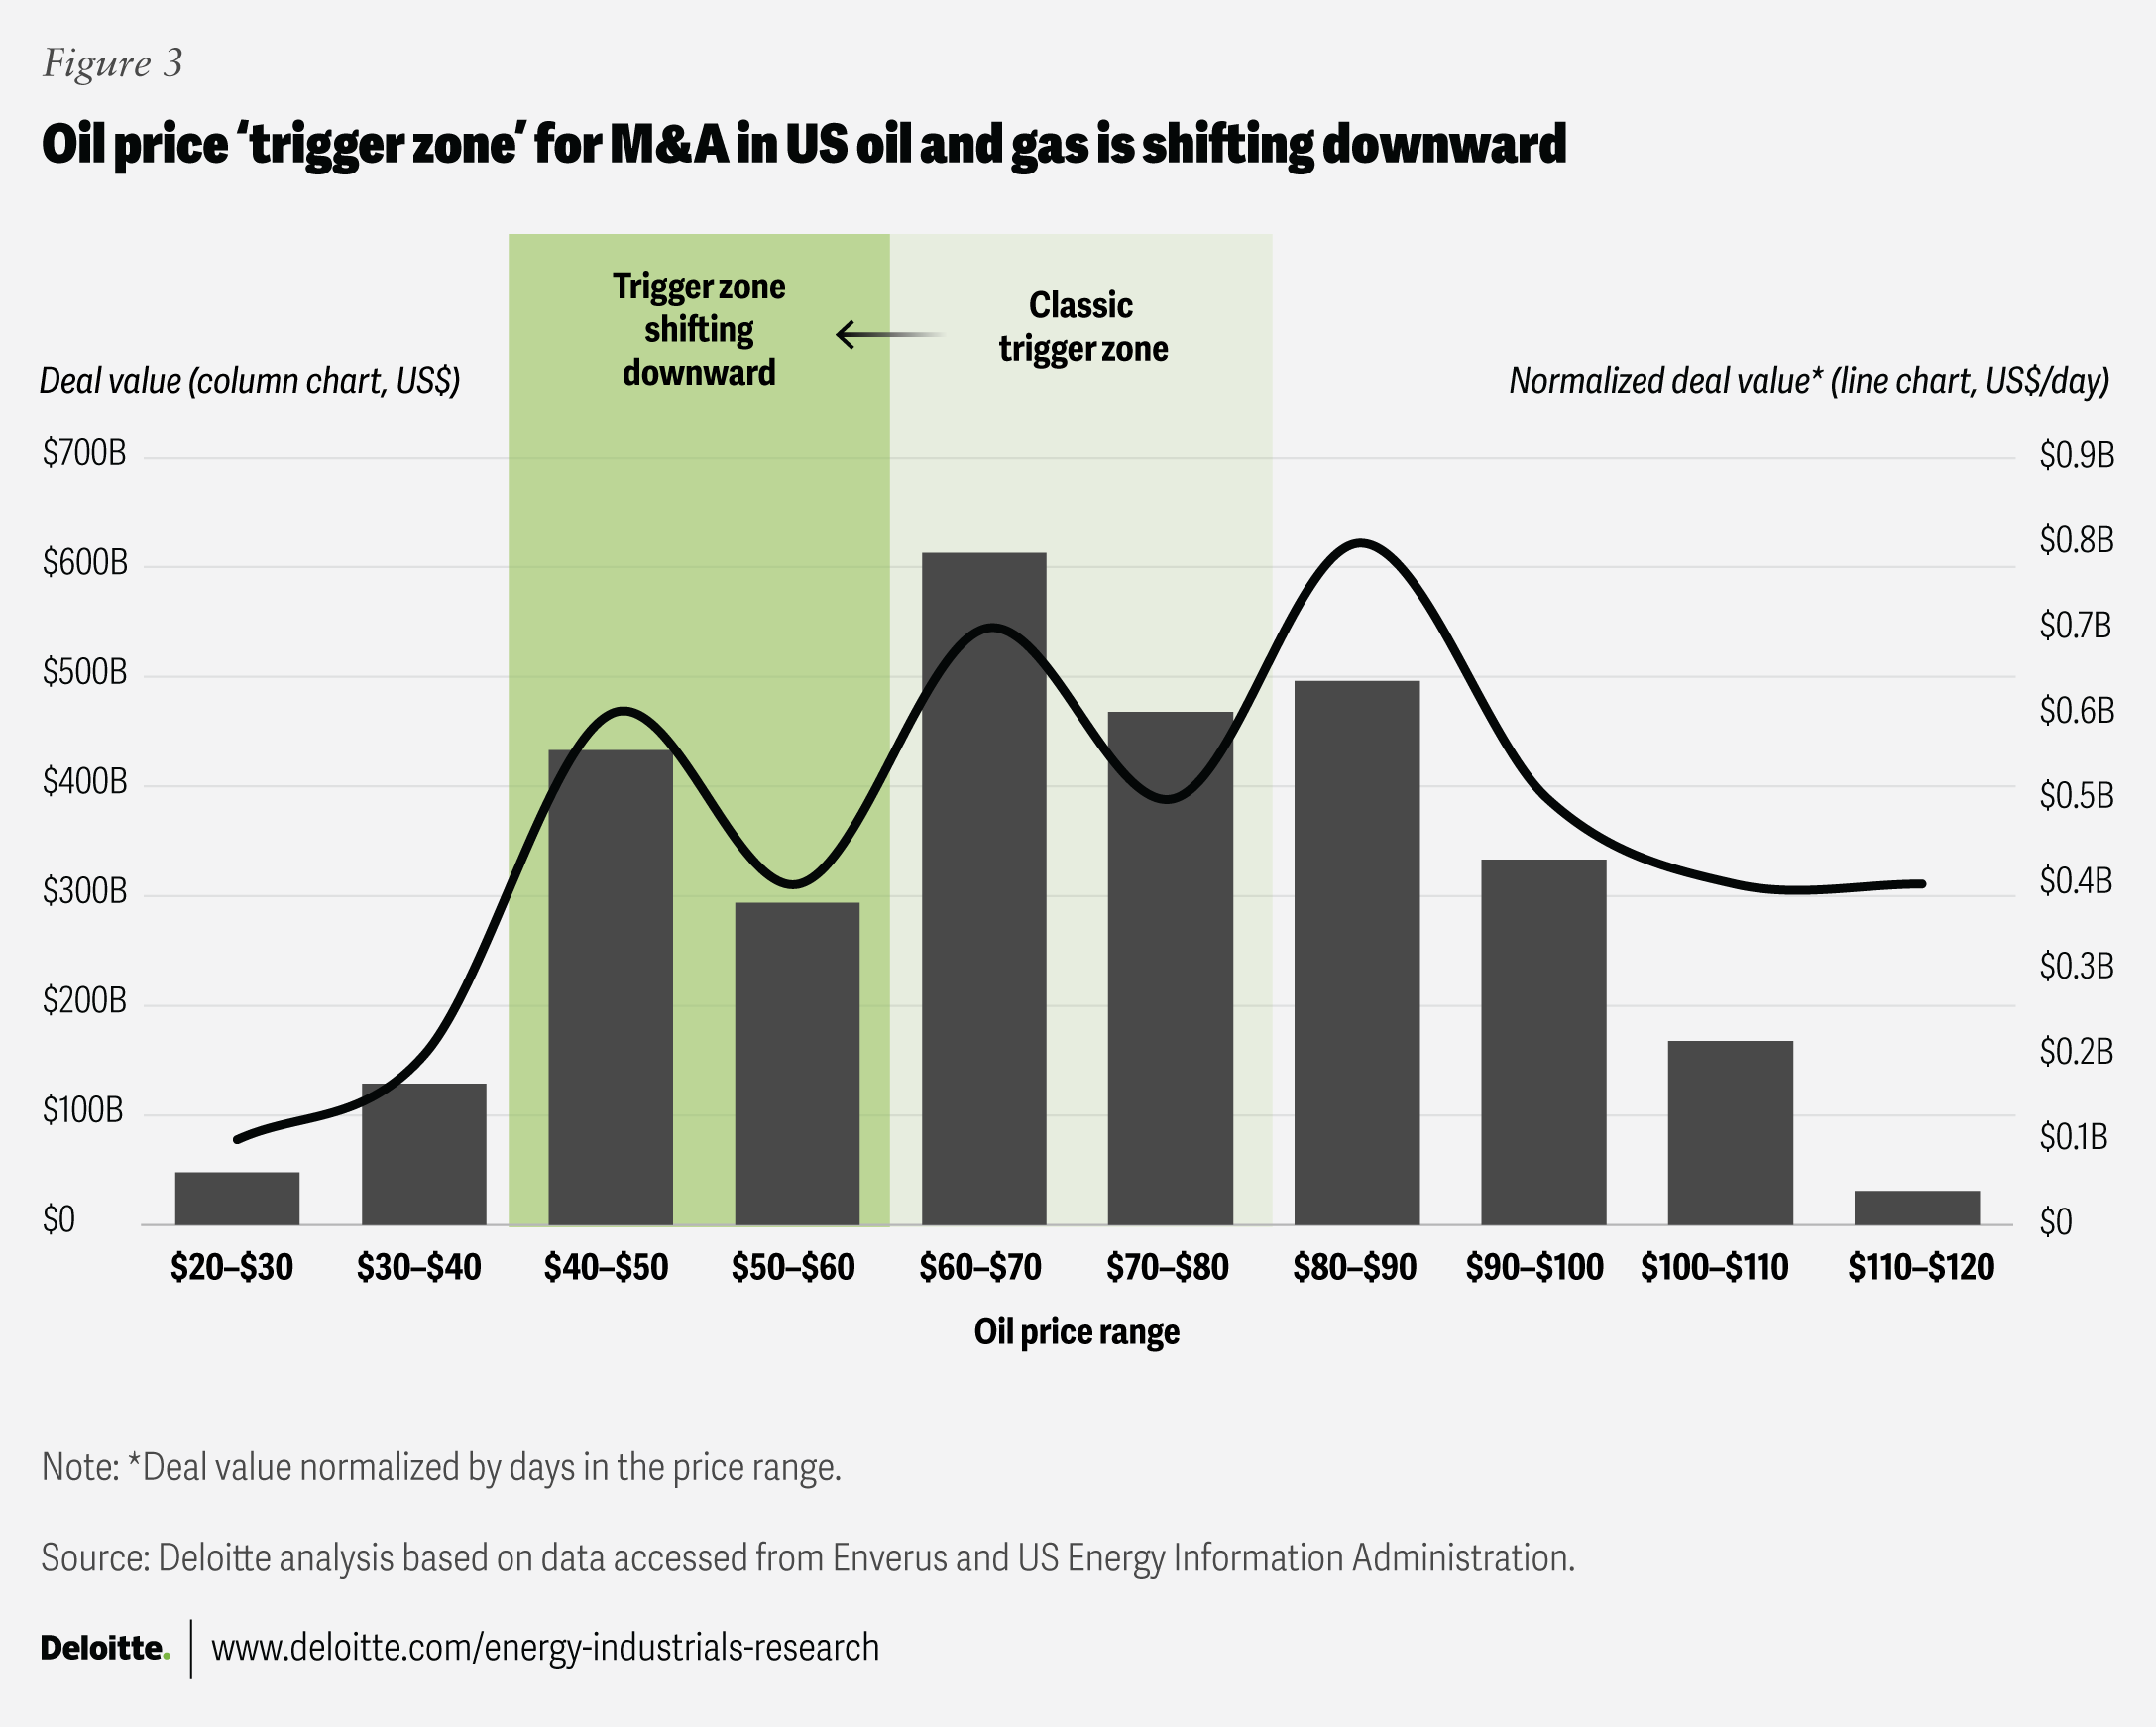
Today, however, the long-term average itself has decreased by US$10 to US$15 per barrel, with US$60 to US$65 per barrel now closer to a structural clearing price than a cyclical low.8 Consequently, meaningful buying interest is likely to emerge only if prices decline further, potentially into a “new trigger zone” of US$45 to US$55 per barrel, assuming market participants view such a drop as temporary rather than a sign of structural change. This price range also broadly aligns with declining breakeven prices across US shale, which have fallen from around US$65 per barrel to US$45 per barrel between 2014 and 2025.9 Put simply, the M&A price floor has shifted lower, with ongoing cost pressures and demand uncertainty reducing sensitivity to moderate price dips and pushing buyers to wait for a deeper disruption.
2. Natural gas–based M&A: Can historical underperformance evolve into a sustainable, structural growth opportunity?
AI’s energy appetite and LNG exports will likely spark the next great gas play.
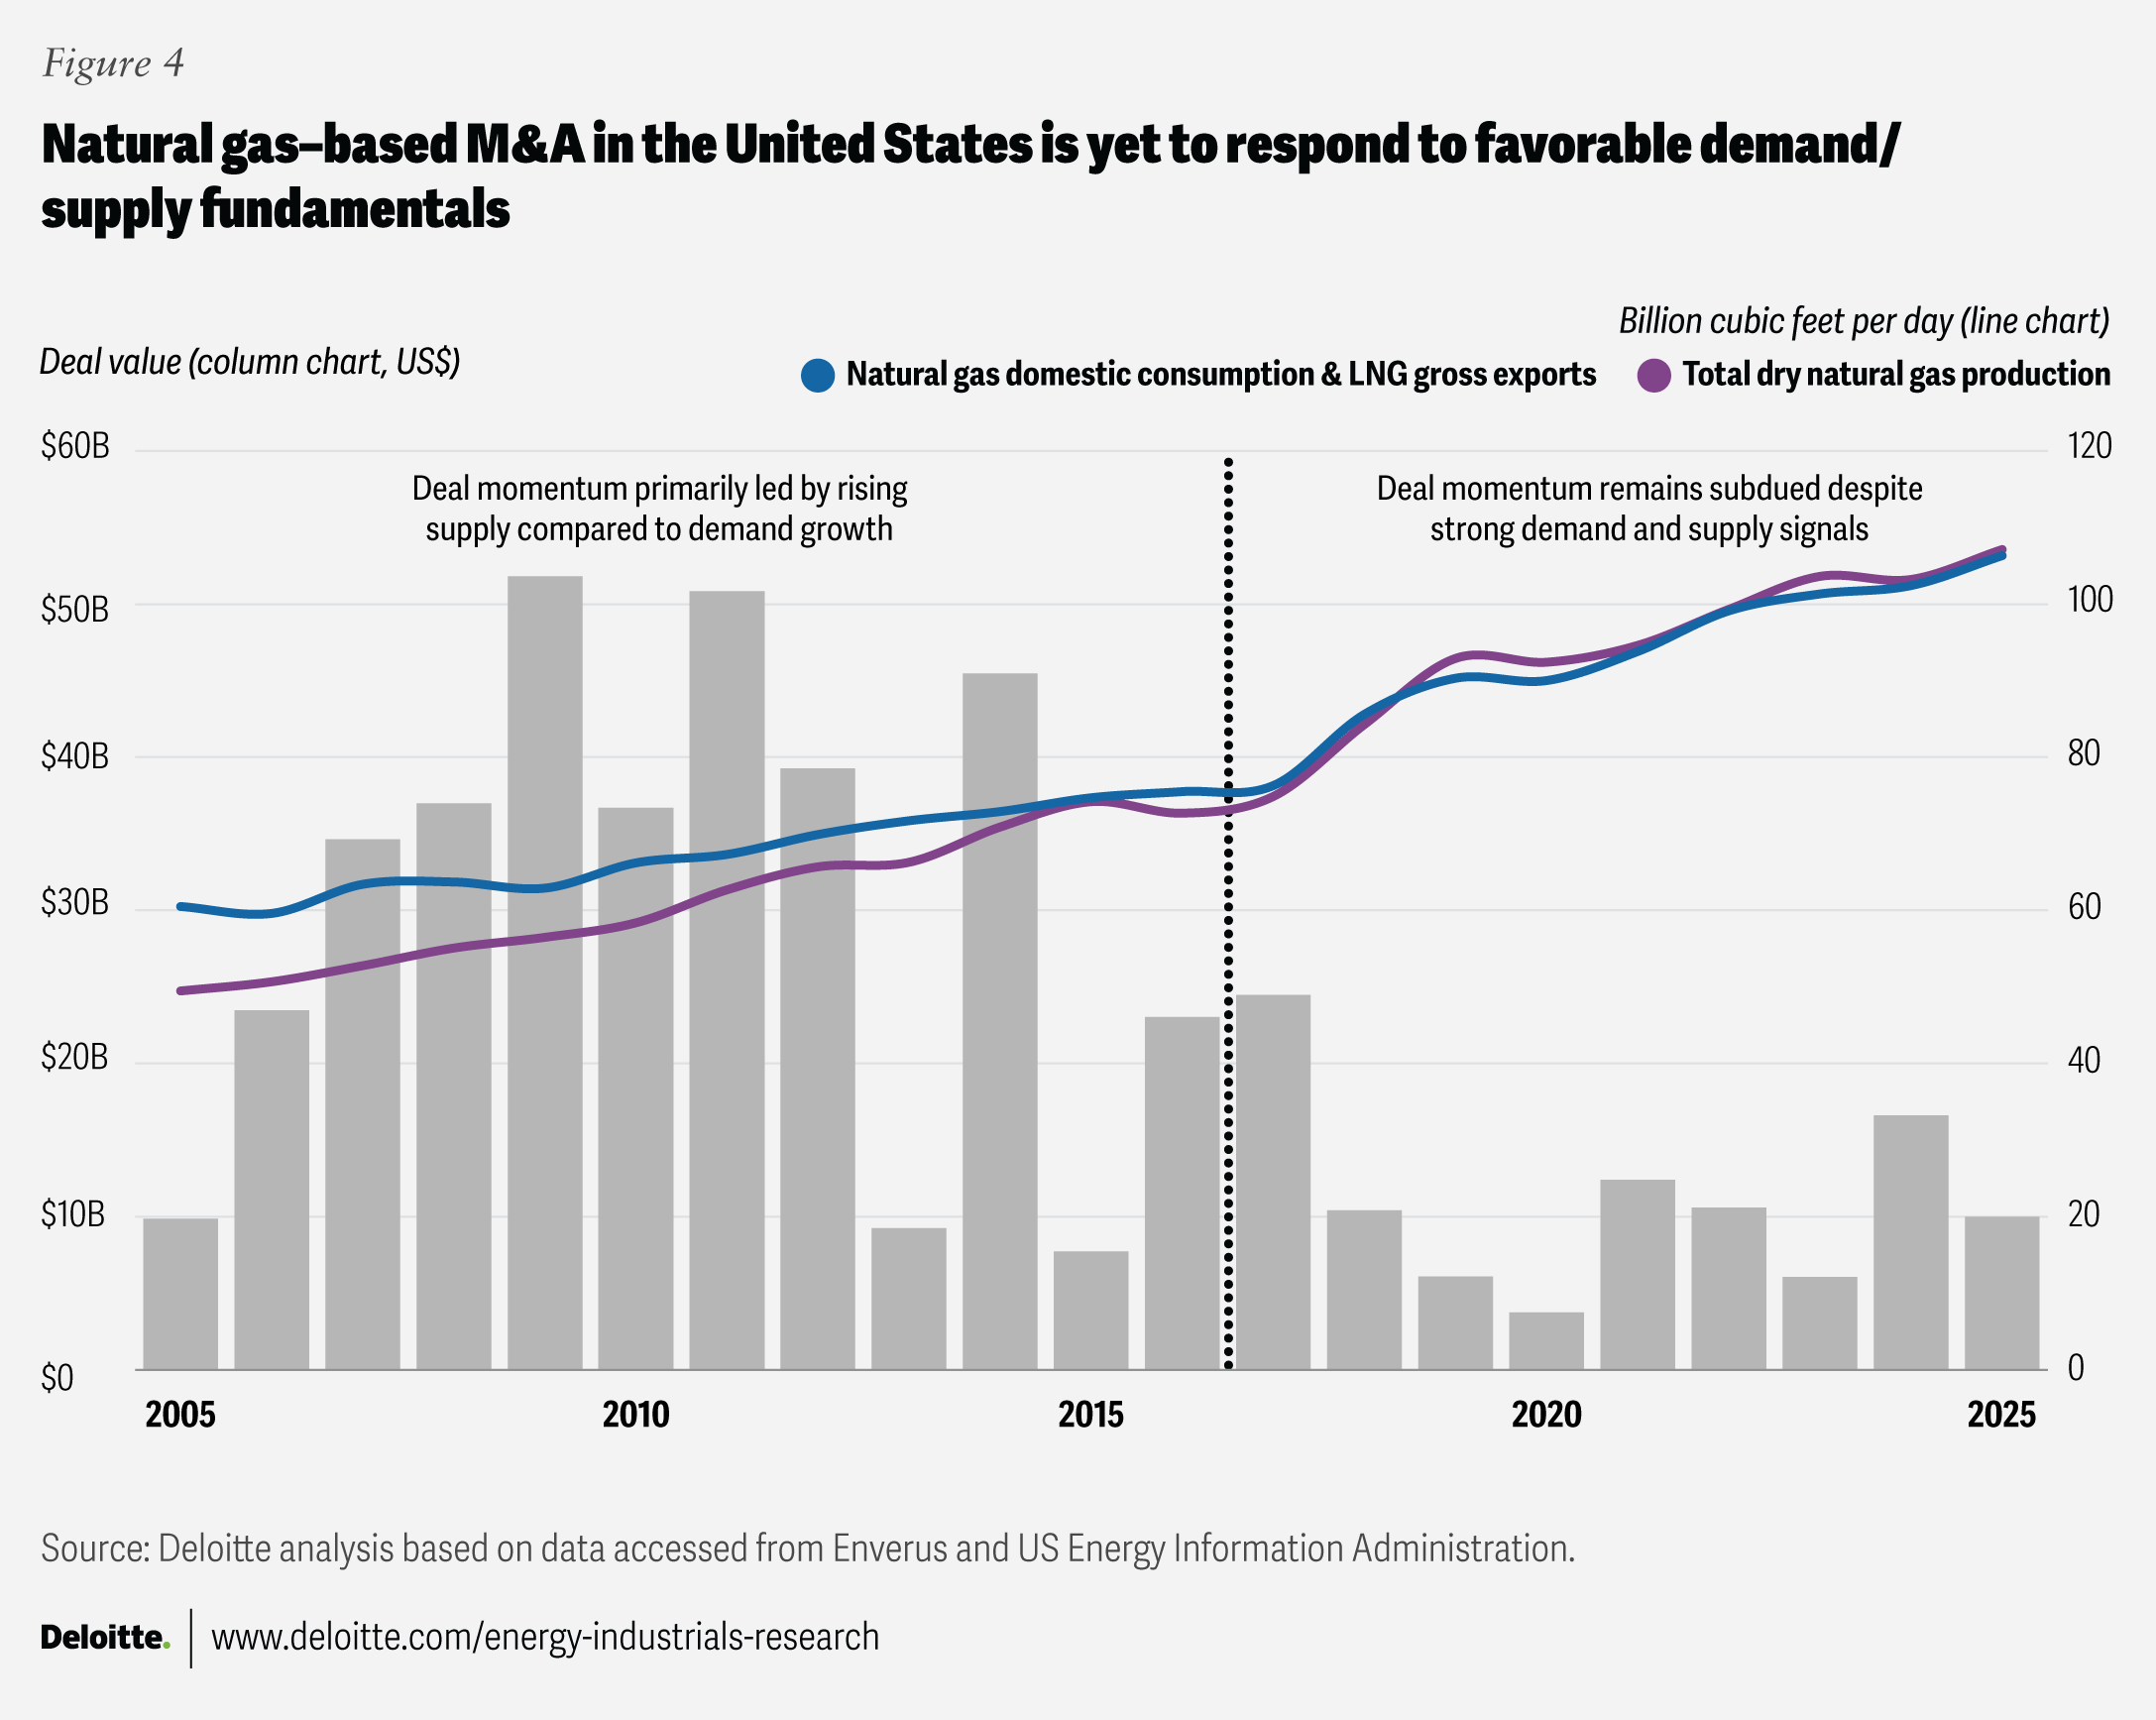
In the years leading up to 2015, natural gas–focused deal activity surged as companies pursued scale and reserves. More than 400 transactions worth US$182 billion were made between 2010 and 2014, with major deals struck when Henry Hub prices hovered near US$4 per million British thermal units (MMBtu).10 However, this momentum faded as pipeline bottlenecks, sluggish domestic demand, and limited LNG export capacity led to regional price discounts and drove prices below US$3 per MMBtu for much of the period.11 With compressed margins and capital shifting toward oil, many gas-focused deals underperformed.
But there’s been a distinct shift since 2015, especially in recent years. Surging demand from data centers, robust growth in LNG exports (expected to have grown 25% year over year in 2025), and corresponding expansion in production and midstream infrastructure are supporting natural gas prices and deal economics (figure 4).12 Yet amid these seemingly strong buy signals, gas-related M&A remains subdued, totaling just US$55 billion since 2021—the lowest five-year figure in two decades.13
This disconnect reflects buyer caution rather than a lack of opportunity, as buyers look for confirmation that these positive trends or policy shifts are sustainable. AI and data center expansion lifting domestic gas demand by 8% to 10%, LNG exports potentially doubling by 2030 and nearly tripling in the early 2030s if all approved projects proceed, and a structurally narrowing spread between US Henry Hub-indexed LNG and international benchmarks such as TTF and JKM would together validate structural demand growth.14 While spread compression may limit peak arbitrage opportunities, increased price convergence enhances cash-flow visibility and boosts underwriting confidence for long-duration gas assets. Taken together, these dynamics point to a more supportive dealmaking environment by 2027 to 2028, with 2026 likely to emerge as a breakout year for gas-related deal activity.
3. Yield over growth: How is capital discipline helping redefine M&A strategy?
As payouts rival acquisitions, the next frontier of M&A is precision, not scale.
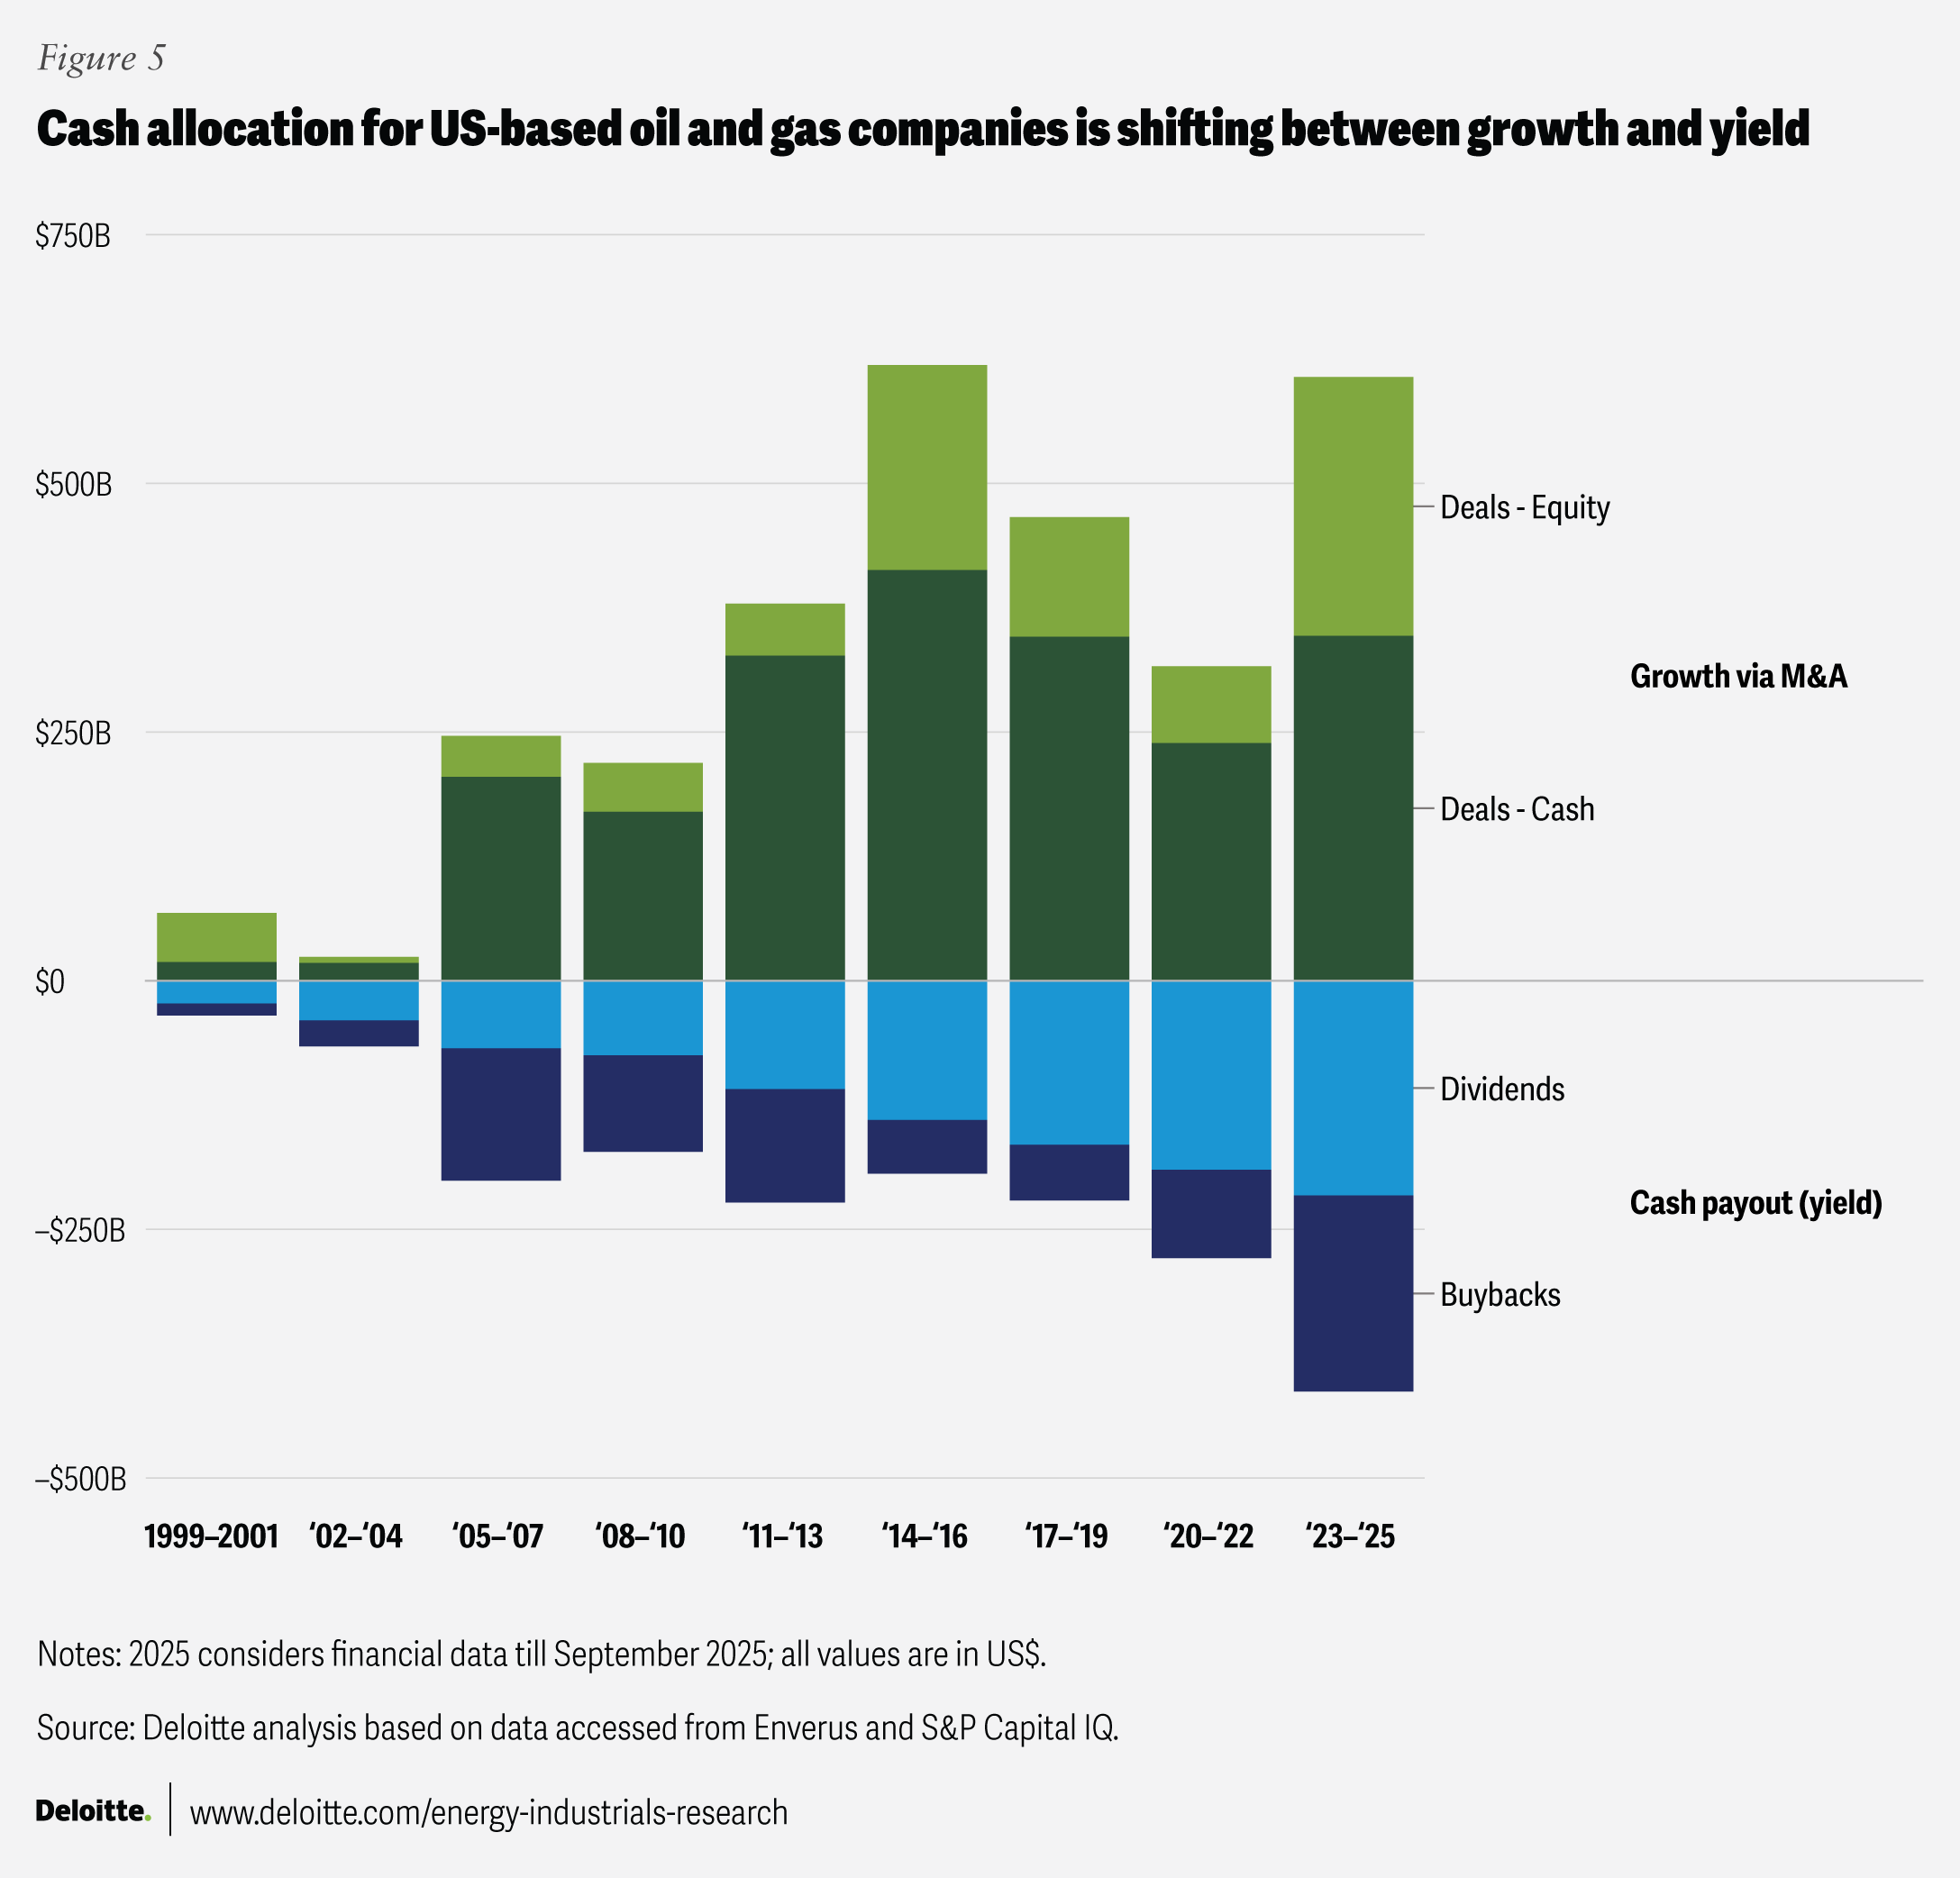
The competition for capital between growth (via M&A) and yield (via distributions and buybacks) is sharper than ever in the O&G industry (figure 5). In recent years, capital returns have risen to nearly match M&A spending, with many large O&G companies now targeting payout ratios above 50%, leaving limited financial flexibility for transformative deals.15 Some even contend that this balance now clearly favors yield, as nearly half of M&A transactions by value are conducted through equity exchanges instead of cash.16
Sustaining elevated payouts could likely reshape deal behavior over time. Companies are expected to strengthen risk management practices, rebalance their asset portfolios, and apply greater discipline to M&A decisions, with success increasingly dependent on more comprehensive pre-deal diligence and faster realization of post-merger synergies. Gen AI is already beginning to play a meaningful role, accelerating data synthesis, scenario analysis, and integration planning, particularly in complex or asset-heavy transactions.
Even so, effective dealmaking continues to increasingly depend on the interplay between seasoned human judgment and gen AI–driven analysis. Deloitte’s 2025 M&A Generative AI Study shows that 86% of 1,000 corporate and PE leaders now integrate gen AI into their M&A workflows. Adoption, however, remains concentrated in the early stages of the M&A life cycle, such as strategy, screening, and due diligence, where expert human oversight remains essential.17 The most effective deal teams pair AI-driven insights with industry experience to find mispriced assets in overlooked infrastructure, smaller acquisitions, and related businesses.
4. Private equity: Moving toward export-oriented infrastructure
Private equity is redirecting funds toward growth-oriented and export-driven infrastructure.
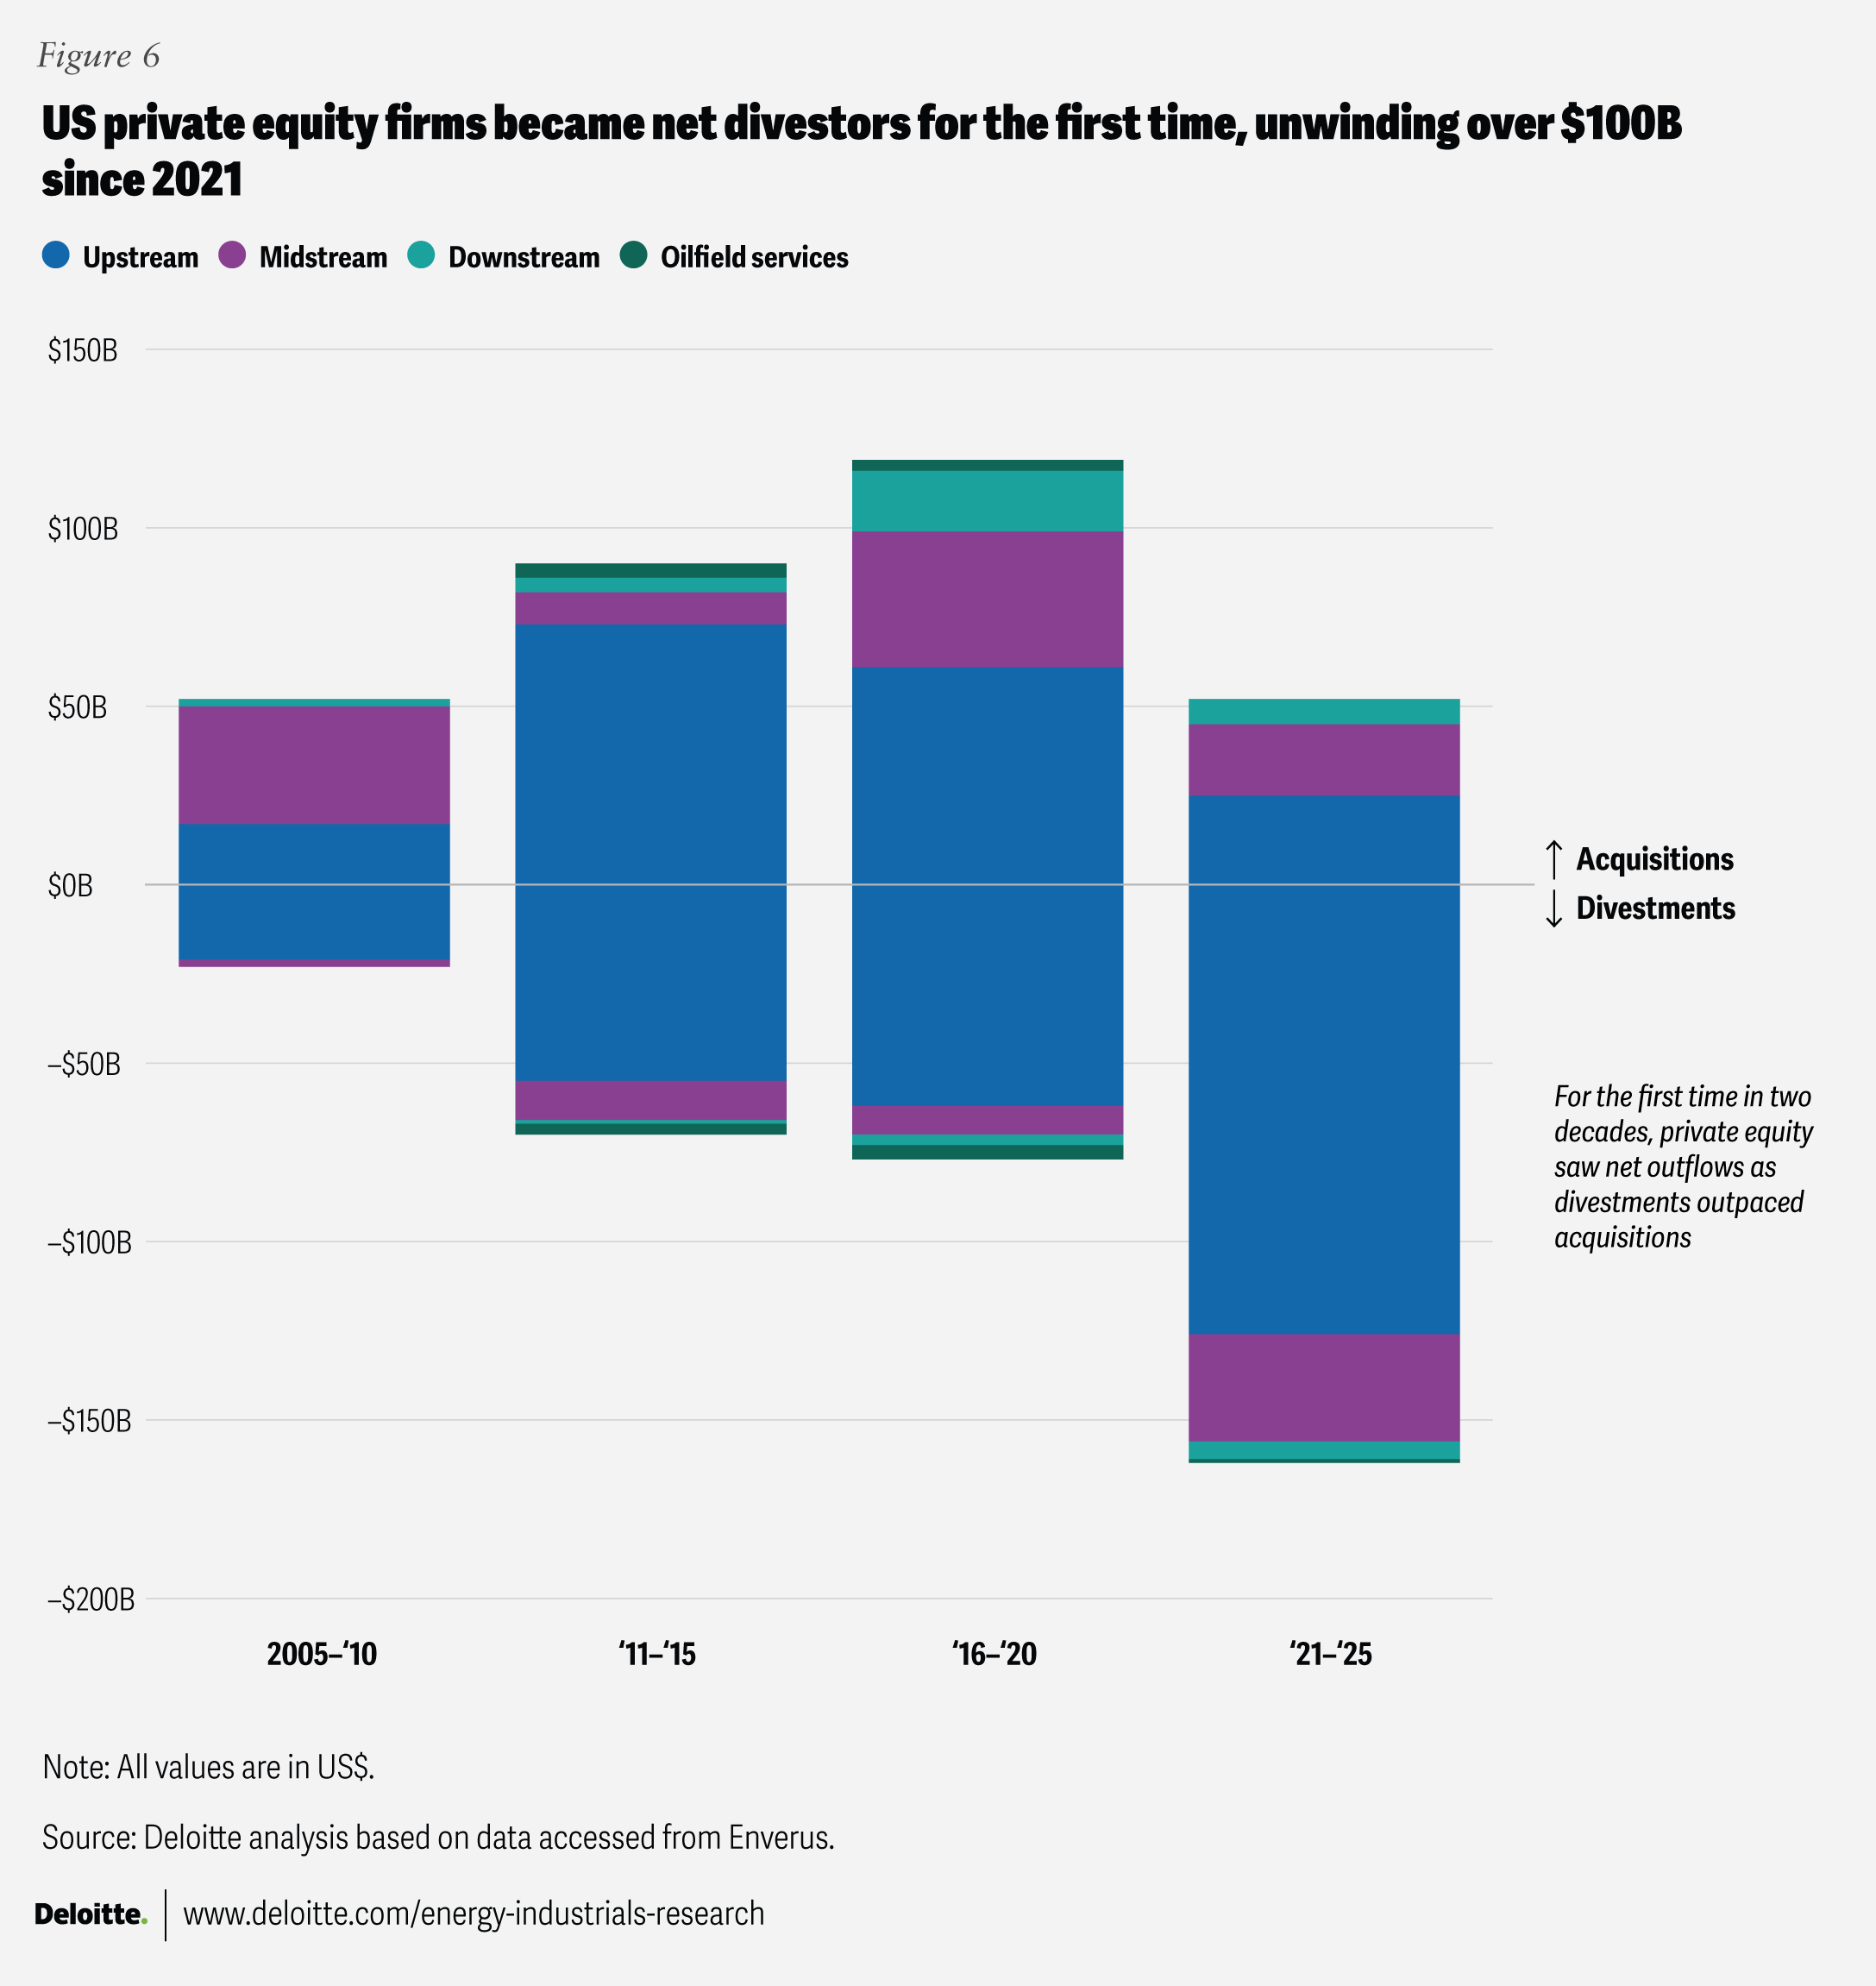
Private equity has shaped US O&G since the early 2010s, funding growth and consolidation across upstream and midstream. Through the mid-2010s downturn, sponsors made US$42 billion in net acquisitions from 2016 to 2020 and moved from single-basin strategies toward diversified national portfolios to weather volatility.18
Lately, this capital cycle has reversed from inflows to outflows (figure 6). Between 2021 and 2025, PE sponsors have divested over US$100 billion in assets, driven by softer demand growth, rising near-term supply, fewer attractive low-cost opportunities, and expectations of continued supply strength that supported timely exits. Upstream-focused activity peaked in 2023, when almost US$27 billion in Permian assets were sold.19 Over the past few years, divestiture activity has shifted toward midstream, as PE firms are now reshaping portfolios toward scalable, export-oriented strategies. This is reflected in about US$8 billion in net divestitures of oil and gas distribution assets and roughly US$2 billion in net acquisitions in pipelines serving export terminals and national transport corridors between 2024 and 2025.20
Concurrently, private equity is being redeployed into adjacent infrastructure, with data centers worldwide attracting more than US$100 billion in investment in 2024 alone.21 This rotation is reshaping market structure and creating opportunities in the O&G sector for non-PE buyers. Large assets exiting PE portfolios can help oil majors and infrastructure funds accelerate scale, enter new basins, and unlock integration gains across gathering, processing, and long-haul transport. New entrants can use platform deals to secure market access and optionality across domestic and export routes.
5. Megamergers: Are external factors aligning for large transactions?
When multiple accelerators converge, the industry buys big.
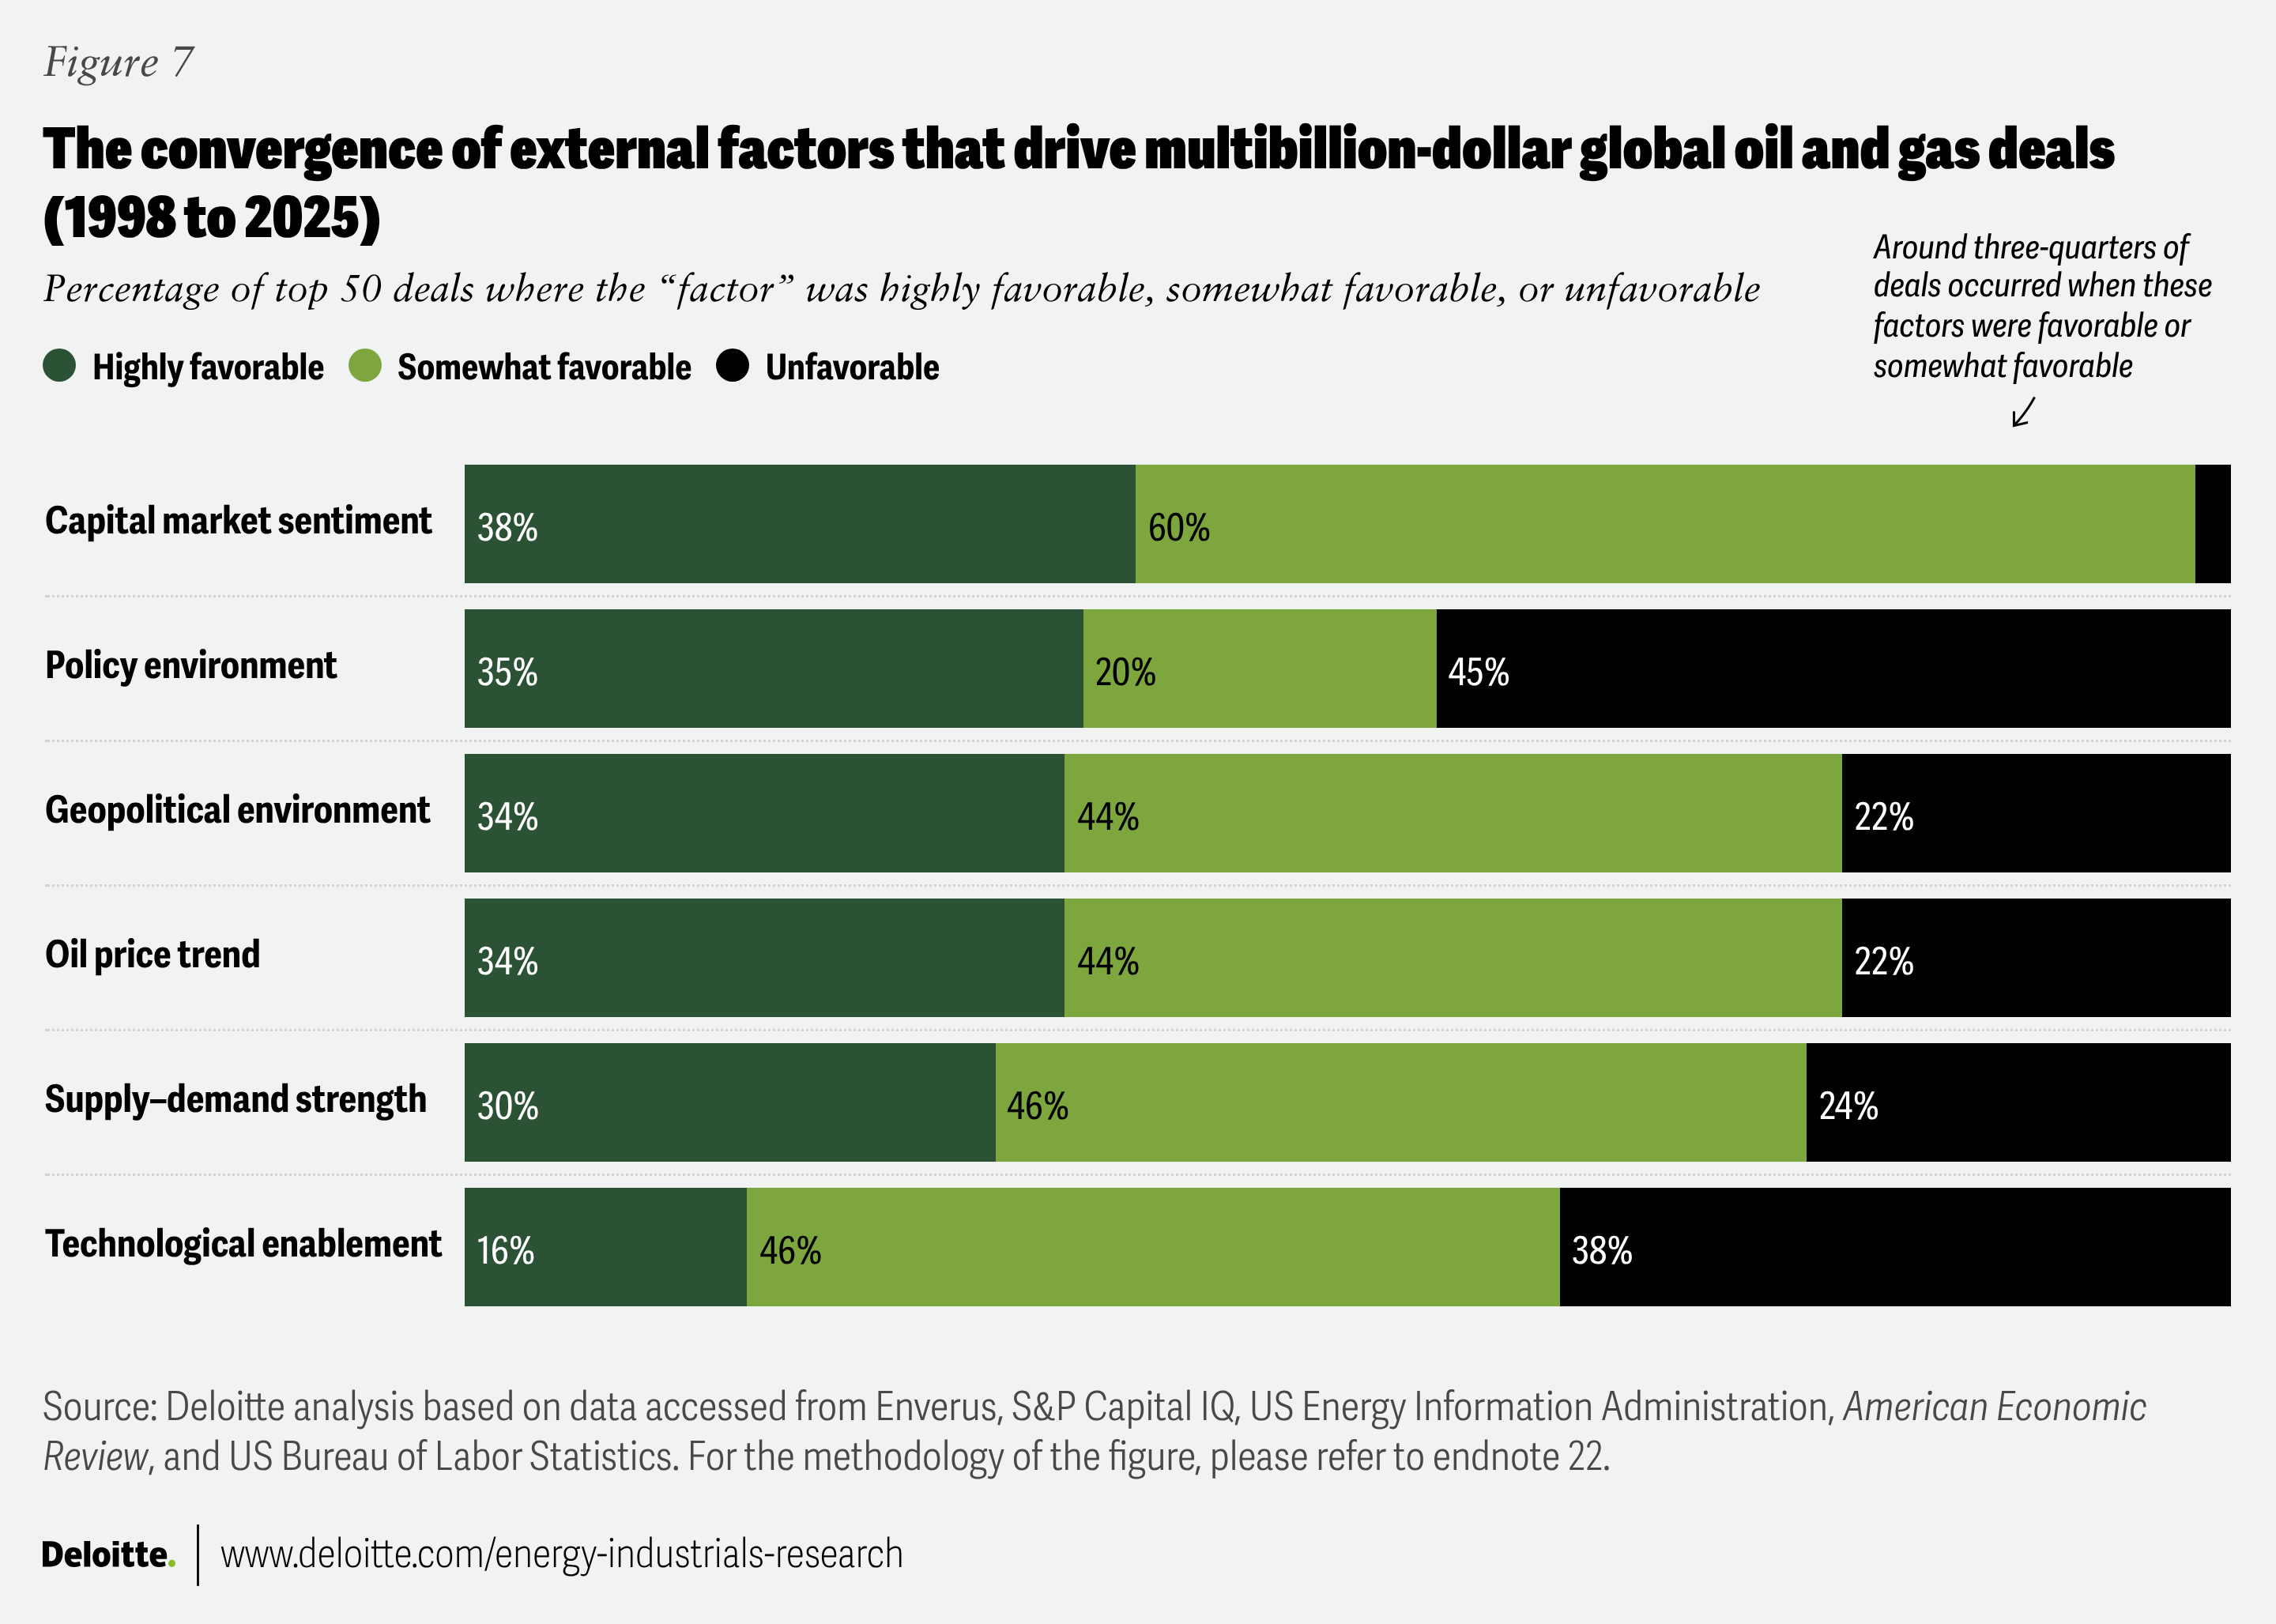
Given the scale of capital and assets at stake, companies considering megamergers closely monitor external conditions before acting. They evaluate oil prices, equity and credit markets, supply-demand dynamics, technology shifts, policy stance, and geopolitics. In our review of the top 50 global O&G deals, about 75% occurred when these factors were favorable or somewhat favorable (figure 7).22 Nearly 70% coincided with strong equity markets, stable oil prices, and major technological advancements, notably the shale revolution.23 The largest transactions, averaging US$35 billion to US$40 billion, typically occurred when multiple external factors were highly favorable, and timing advantages were clear.24
Today, many of these external factors remain supportive. Financial markets are robust, and enterprise tools, including gen AI, are improving integration and productivity.25 However, geopolitical challenges and muted demand continue to weigh on valuations and delay board approvals, tempering the otherwise supportive environment. This raises an important question: Are conditions truly ripe for another cycle of megadeals?
Possibly, but only under clearer conditions. Without stronger demand or a defined push for portfolio realignment, capital discipline will continue to outweigh otherwise favorable deal settings. The coming phase will differ from earlier waves, marked less by sweeping consolidation and more by strategic selectivity. The industry will more likely see select large transactions where synergies and strategic fit are clear, rather than a broad consolidation wave. A meaningful improvement in end-market demand or a credible strategic shift would be the catalyst for a sustained pickup in deal activity.
Will this M&A cycle rewrite the rules?
Oil and gas M&A are no longer about chasing barrels, achieving scale, or timing commodity price cycles, but about positioning for the industry’s future. As US petroleum product demand matures, future deals will be increasingly driven by the growing need to power the “digital economy”—meeting the surging energy demands of data centers and digital platforms. Companies pairing sharper capital discipline with tech-forward strategies will be best positioned to bridge the gap between physical energy networks and soaring digital demand. To capture value in this shifting landscape, O&G leaders should focus on the following:
- Carefully evaluate natural gas assets. Conduct rigorous due diligence on natural gas opportunities, which involve complex infrastructure, evolving regulatory scrutiny, and unique margin profiles that differ from oil.
- Prepare for regulatory and market shifts. Build flexibility into deal timelines and due diligence to anticipate policy shifts, evolving geopolitical developments, and valuation volatility caused by commodity swings.
- Seize mid-market and non-core divestitures. Regularly scan for mid-sized deals and non-core asset carve-outs from larger peers, which are expected to accelerate and may present high-value entry points for growth.
- Track emerging PE strategies. Monitor dynamic dealmaking of PE firms, like joint ventures, partial sales, staged exits, or creative buy-sell cycles. These strategies will likely create new avenues for O&G companies to acquire, partner, or divest.
- Synchronize capital discipline with tech-forward integration. Balance rigorous capital allocation with purposeful investments in gen AI, advanced analytics, digital enablement, and tech-based alliances to ensure that caution does not limit opportunity and digital adoption is implemented only where it delivers clear value.
Continue the conversation
Meet the industry leaders
Zillah Austin
Nichelle McLemore
Melinda Yee
Kate Hardin
Anshu Mittal
By
Zillah Austin
Nichelle McLemore
Melinda Yee
Kate Hardin
Anshu Mittal
The authors would like to thank Abhinav Purohit and Vamshi Guguloth for their extensive contributions to this report, including in-depth research, analysis, and narrative development.
The authors would also like to thank Peter Buettgen, Joelene Mackenzie, Phil Huber, Jason Spann, Greg Huber, Chris Simpson, and Jeff Kennedy for their subject matter input and review.
Finally, the authors would like to acknowledge the support of Clayton Wilkerson for orchestrating resources related to the report; Katrina Drake Hudson and Dario Failla who drove the marketing strategy and related assets to bring the story to life; Kaitlin Pellerin for her leadership in public relations; Rithu Mariam, Aparna Prusty, and Pubali Dey from the Deloitte Insights team who edited the report and supported its publication; and Harry Wedel for the visual design.
Editorial (including production and copyediting): Rithu Thomas, Cintia Cheong, Pubali Dey, and Aparna Prusty
Design: Harry Wedel and Rahul Bodiga
Knowledge services: Agni Wagh
Cover artist: Rahul Bodiga
Visit the Deloitte Center for Energy & Industrials
Access more insights for the aerospace and defense, chemicals and specialty materials, engineering and construction, industrial manufacturing, mining and metals, oil and gas, power and utilities, and renewable energy sectors.