United States Economic Forecast
Investment in artificial intelligence is supporting the economy, but questions remain about how long the momentum can last
Since our last forecast in September, we have continued to see a rapidly changing economic and policy environment. We recognize that conditions remain highly fluid, so the three forecast scenarios we present in this edition are not meant as precise estimates of where the US economy will end up. Instead, they are built on explicit assumptions to help guide thinking about where the economy might go from here. Our baseline forecast reflects our best assessment of how different economic policies will evolve. Our downside and upside scenarios reflect plausible alternatives for the US economy should our assumptions prove to be overly optimistic or pessimistic, respectively.1
The main differences across our scenarios involve assumptions around investments in artificial intelligence, tariffs, and immigration. We model how the economy may evolve under different levels of artificial intelligence investment, including a sudden pullback in AI investment in our downside scenario. Tariff policy remains uncertain, as some of the tariffs are still being adjusted or adjudicated in the courts. However, we assume that tariffs are at least modestly higher than they were at the start of this year across all three scenarios. Given a recent rapid decline in immigration,2 we also model how different levels of net migration will affect economic output.
Scenarios
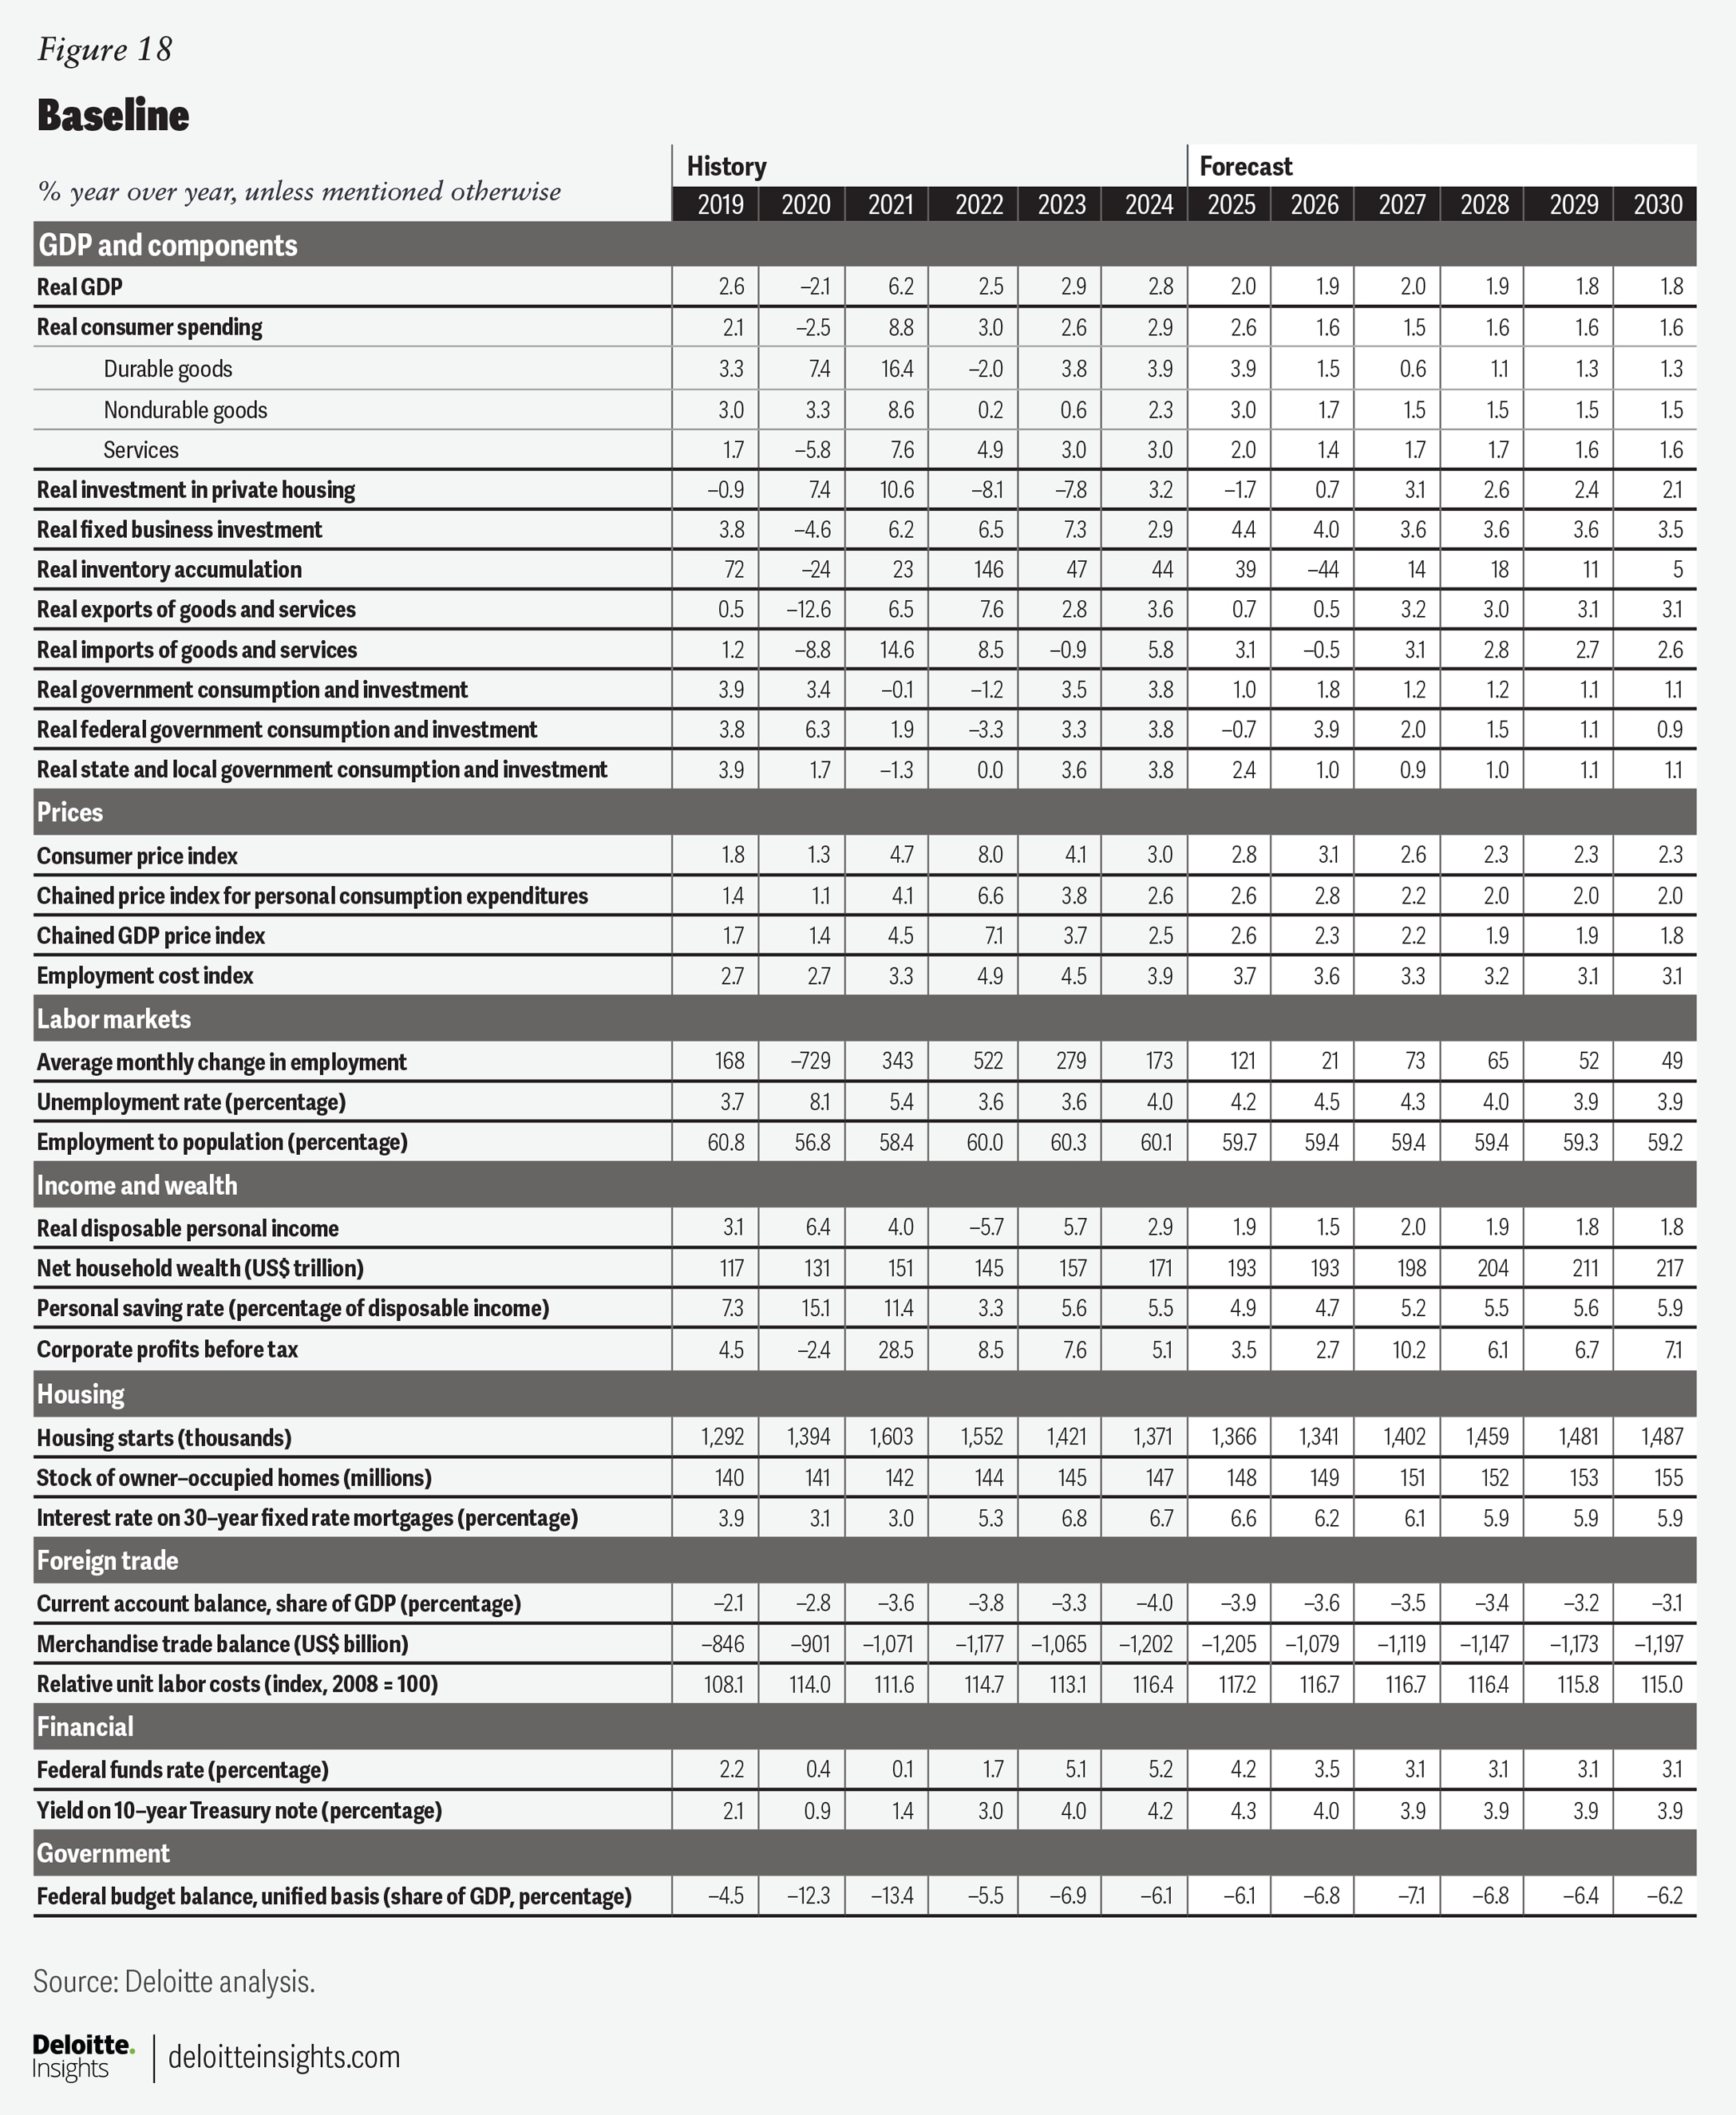
Baseline
Our baseline forecast is closest to how we expect the economy will grow, based on the assumptions made at the time of analysis. We expect that the average tariff rate will remain high throughout the forecast period (2025 to 2030), though the country- and product-specific rates are likely to change. As of August, the average effective tariff rate was just above 10%, up from about 2.5% at the start of the year.3 We assume that this rate rises further to 15% by the first quarter of 2026. Importers who built up their inventories ahead of tariffs will ultimately need to replenish those goods at tariffed rates, as domestic production has not fundamentally changed. This is expected to raise the average effective tariff rate to about 15%. We assume this average tariff rate persists through the end of 2030. However, exemptions, court rulings, or a new administration could lead to deviations from this assumption.
We have also maintained our assumption that net migration into the United States is lower than we had anticipated during the first half of 2025. In January, the Congressional Budget Office (CBO) had anticipated that net migration into the United States in 2025 through 2030 would amount to 6.8 million adults.4 In September, the CBO revised this estimate down to 4 million adults.5 However, based on recent trends in immigration statistics,6 we have assumed net migration of 3.3 million adults over that period. This puts downward pressure on the forecast, as fewer workers contribute to economic output. The lost output accumulates over time, making growth weaker over longer time horizons.
Artificial intelligence is already having a sizable effect on the economy. In the baseline, we have increased the level of business investment relative to our September forecast. This partially reflects the release of stronger data. For example, real business fixed investment in the second quarter of 2025 was initially reported to have grown an annualized 1.9% from the previous quarter. However, that figure was revised up to 7.3%. Although we expect investment to remain relatively strong in the next few years, the growth rate is expected to moderate from 4.4% in 2025 to 4% in 2026.
Similarly, real consumer spending is expected to be stronger in the near term, thanks to AI-driven gains in equity prices. This positive wealth effect helps to explain why aggregate consumer spending has grown faster than aggregate wages. Here, too, some of the anticipated strength in consumer spending comes from upward revisions to the data. The annualized growth rate of real consumer spending between the first and second quarters of 2025 was revised from 1.4% to 2.5%. As equity-price gains slow, we expect consumer spending growth to fall into better alignment with wage growth.
Consumers, however, face some serious headwinds. High tariffs increasingly show up in consumer prices, raising the core personal consumption expenditure (PCE) price index 3% in 2026. This is lower than what had been forecasted in September. We now anticipate that businesses will pass tariff costs on to consumers more gradually, keeping core inflation above the Federal Reserve’s 2% target until the end of 2028.
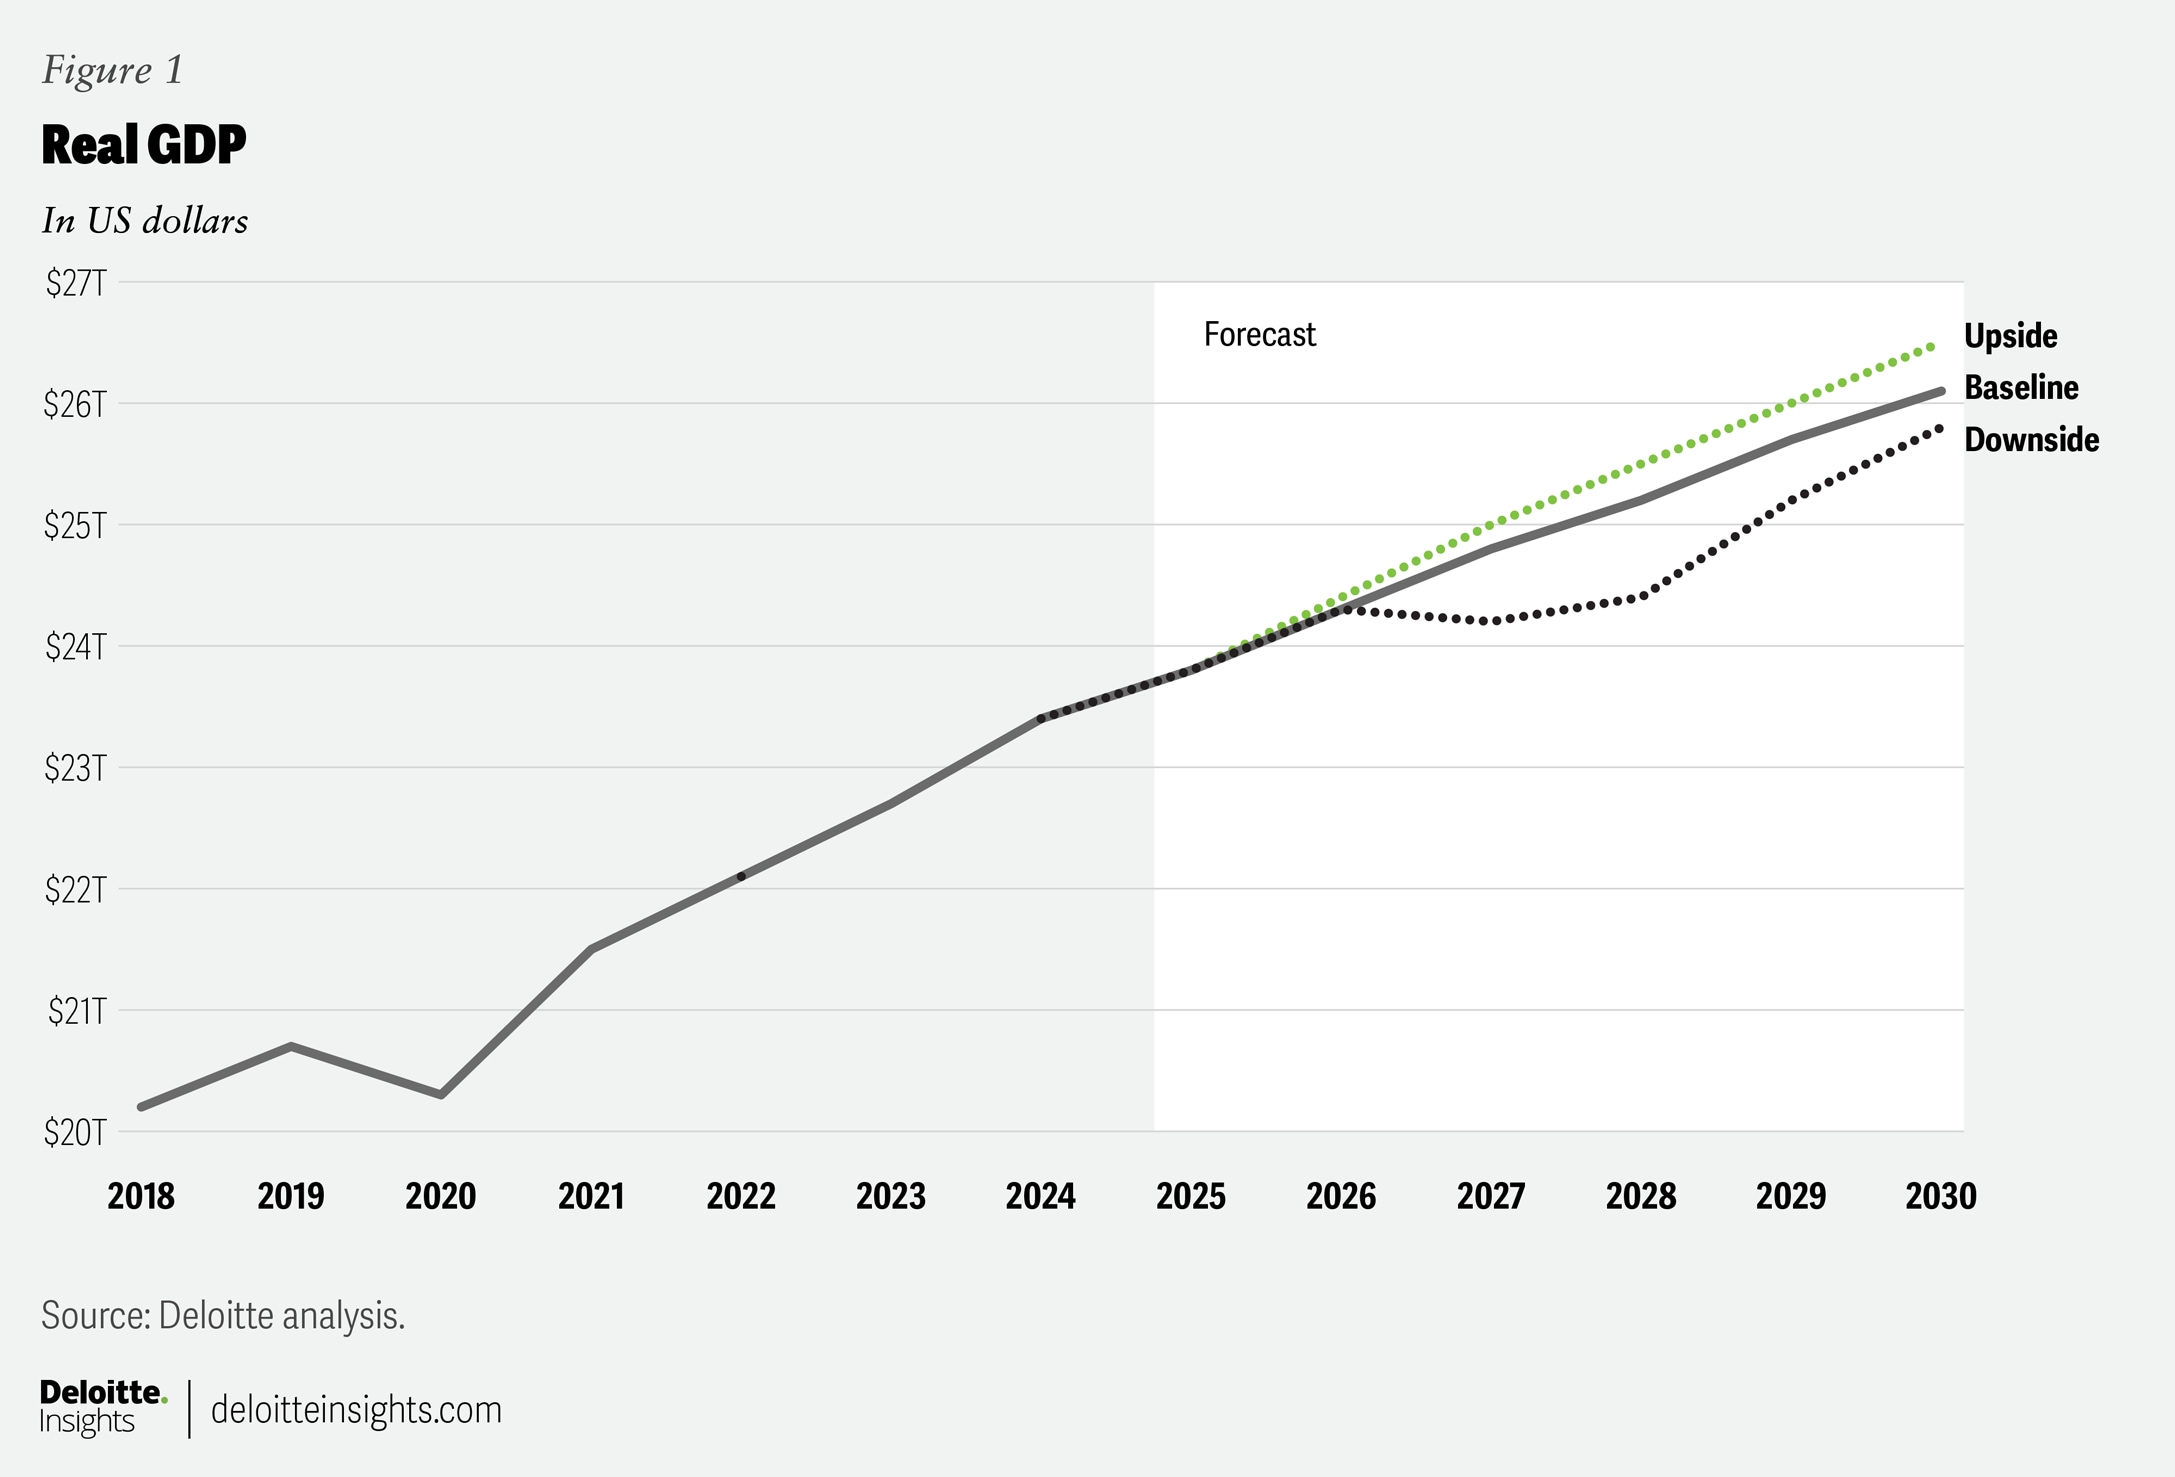
A loosening labor market is expected to push wage growth lower, eroding purchasing power and consumer spending. In addition, weaker population growth from a sharp drop in net migration weighs on aggregate consumer spending. As a result, real consumer spending slows to 1.6% in 2026, down from an anticipated 2.6% in 2025. Unemployment rate rises to 4.5% in 2026, up from 4% in 2024. Despite the pronounced slowdown in consumer spending, real GDP is expected to grow 1.9% in 2026, down slightly from an anticipated 2% in 2025. By 2030, real GDP growth is expected to shift to its potential rate of about 1.8%.
Downside: AI goes from boom to bust
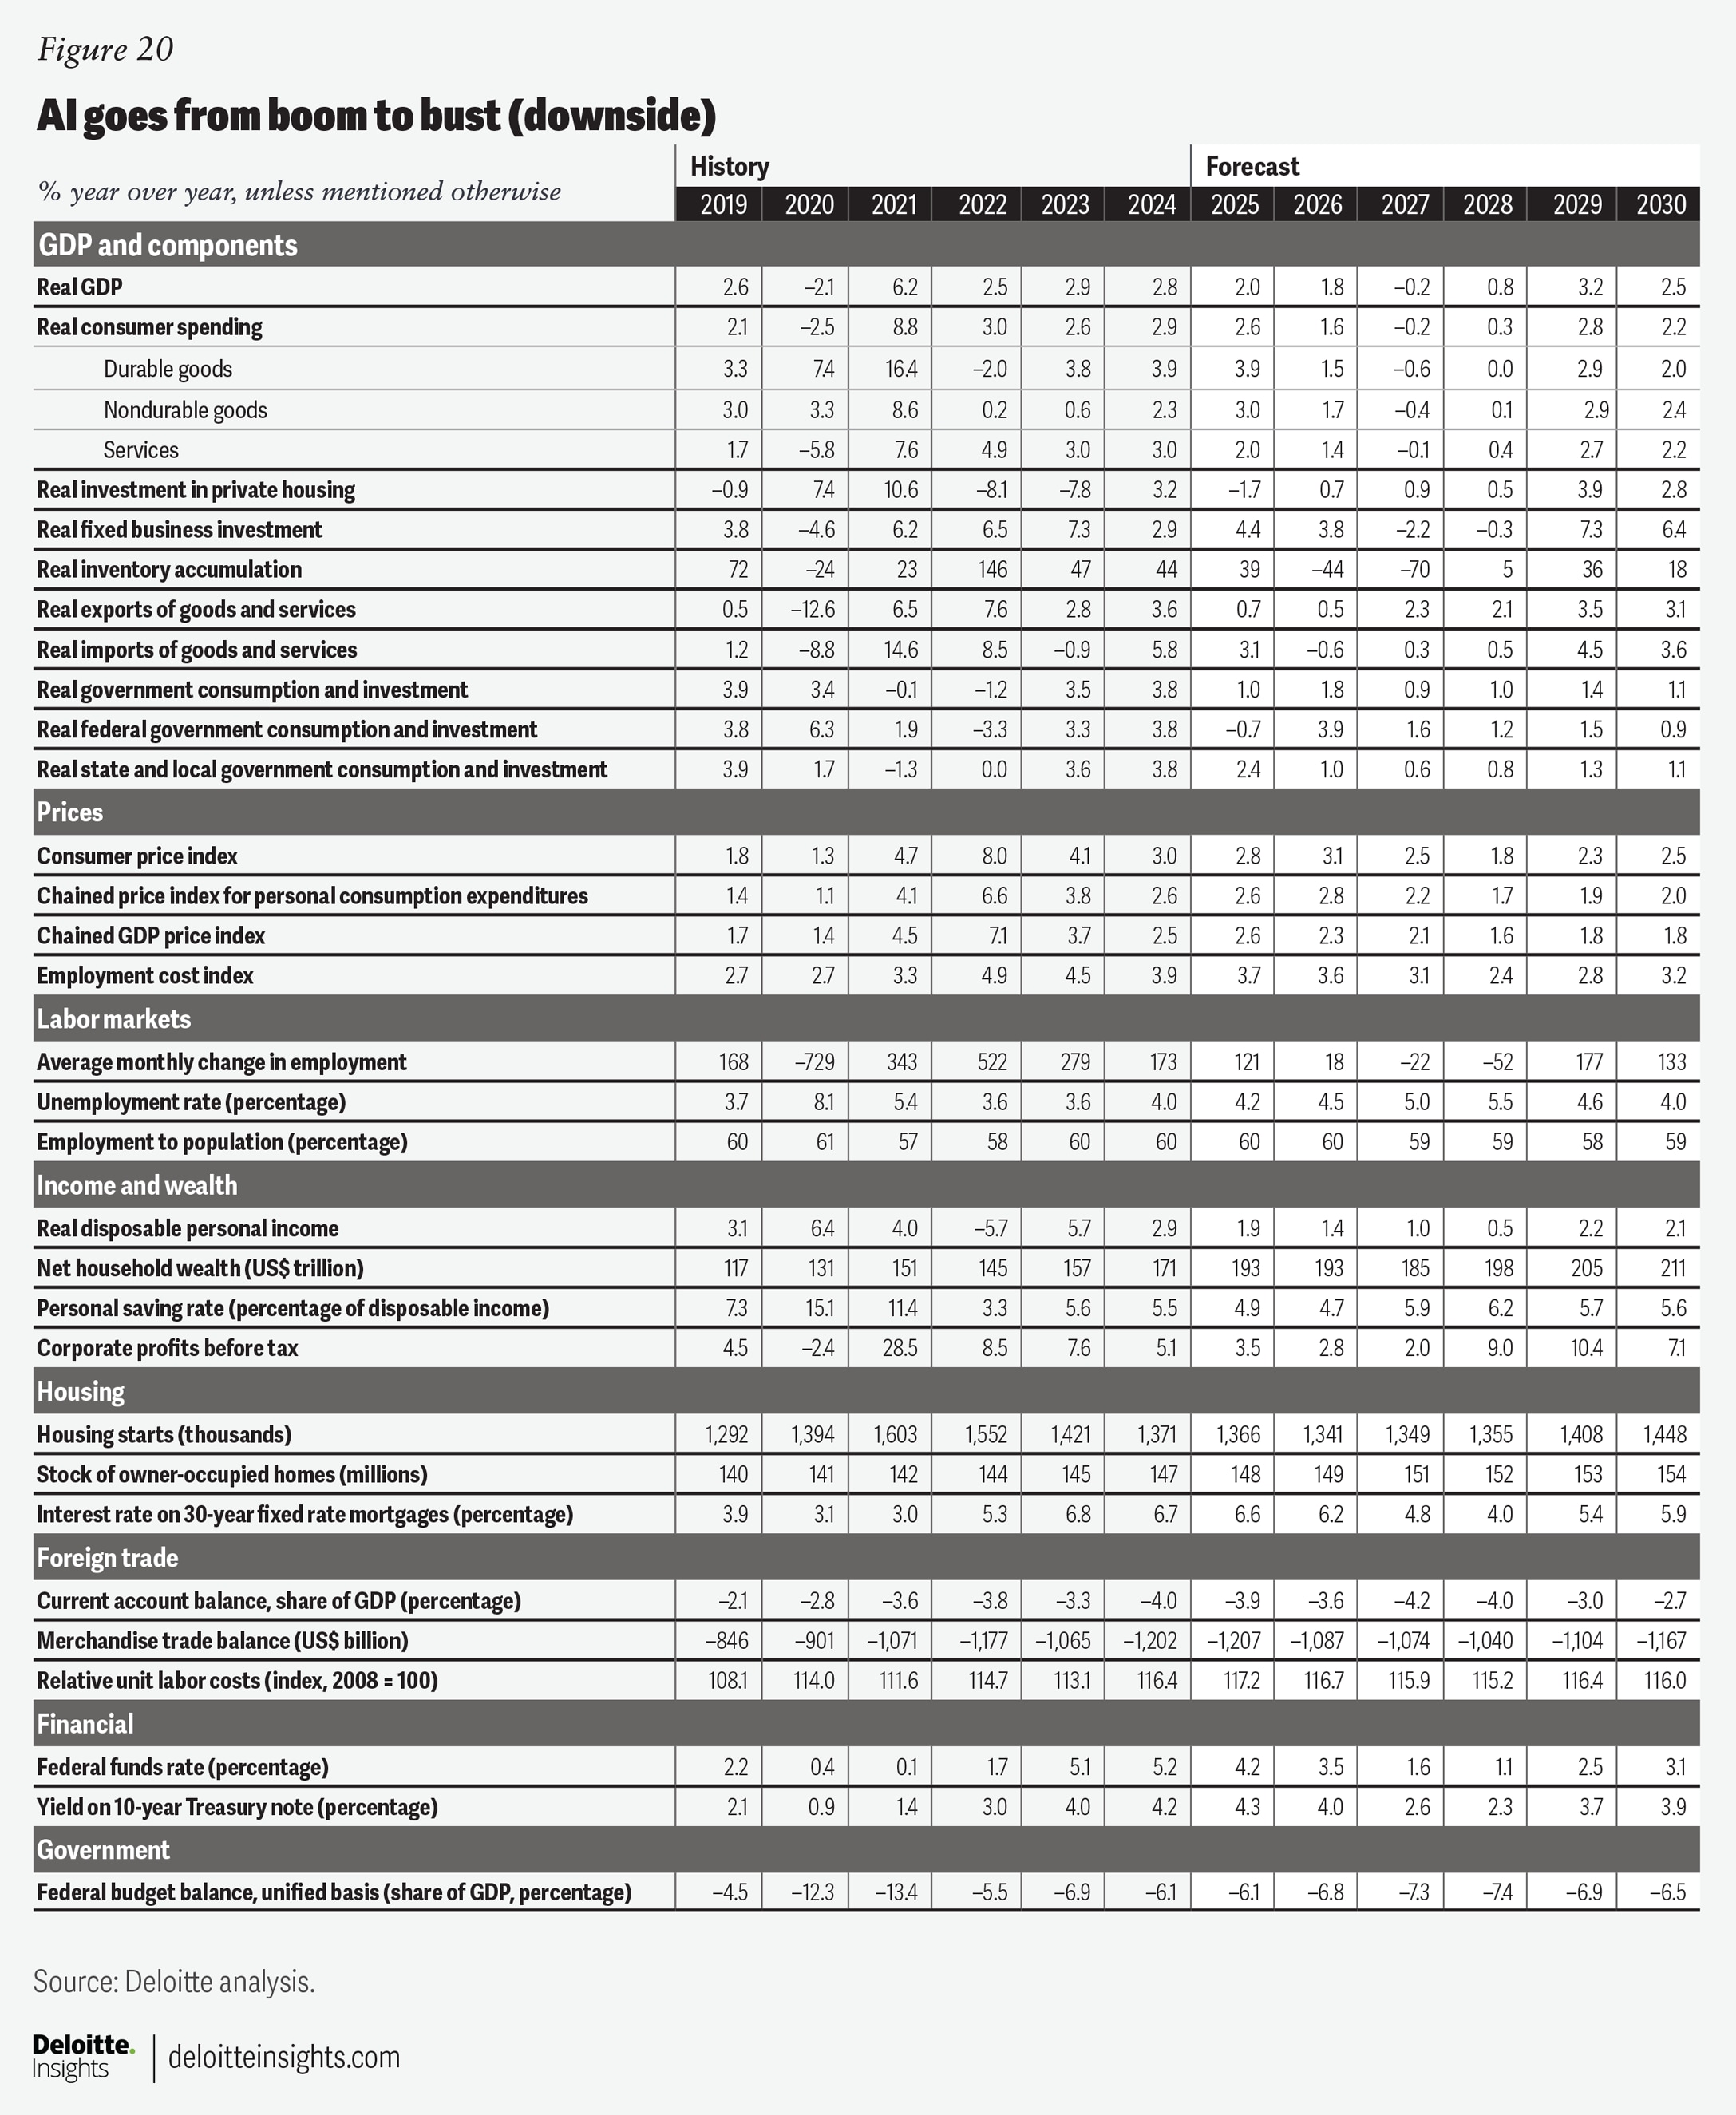
Our downside scenario maintains the same tariff and immigration assumptions that were made in the baseline. However, it assumes that investment in AI becomes overdone, leading to a relatively sharp pullback in business spending in 2027 as companies reassess potential demand for related products. Real business investment is expected to decline by 2.1% in 2027 and another 0.3% in 2028.
Although the contraction in business investment is significant, it is considerably smaller than contractions seen in previous recessions. The peak-to-trough decline in our downside scenario is less than half of the decline seen after the dot-com bubble and less than a quarter of that seen during the Great Recession. This occurs for two reasons. First, businesses unrelated to artificial intelligence have already tightened their belts, which should limit additional declines should AI-related investment prove to be a bubble.
The second reason is that the depreciation cycle for many of the components in AI-related investments is likely much shorter than it was for fiber-optic cables during the telecom boom in the late 1990s. The fiber-optic cables that were initially laid remained useful years later when demand finally caught up. However, this is unlikely to be true for AI infrastructure. Rising obsolescence of existing AI infrastructure will likely force companies to make new investments to just maintain existing capabilities and could need to spend even more to prevent moving further from the technological frontier.
As companies pull back on their investments in artificial intelligence and investors realize that demand for related products will be weaker than previously anticipated, stock prices are expected to fall roughly 10% from peak to trough. This brings price-to-earnings ratios to less optimistic levels than those seen through much of 2025. This sudden drop in wealth has an outsized effect on consumer spending. Recently, consumer spending growth has been heavily dependent on top income earners7 who are likely more influenced by changes in their financial portfolios. As a result, we expect real consumer spending to fall 0.2% in 2027 and grow by just 0.3% in 2028.
The weakening of domestic demand raises the unemployment rate to 5.5% in 2028. It also provides a stronger disinflationary impulse, allowing core PCE price index growth to dip below the Fed’s 2% target by the end of 2027 before returning to 2% by 2030. As a result, the midpoint of the federal funds rate drops below 1% by the end of 2027. Real GDP is expected to decline 0.2% in 2027 and grow just 0.8% in 2028. A stronger recovery is expected to take hold in 2029 and 2030.
Upside: AI investment boom endures
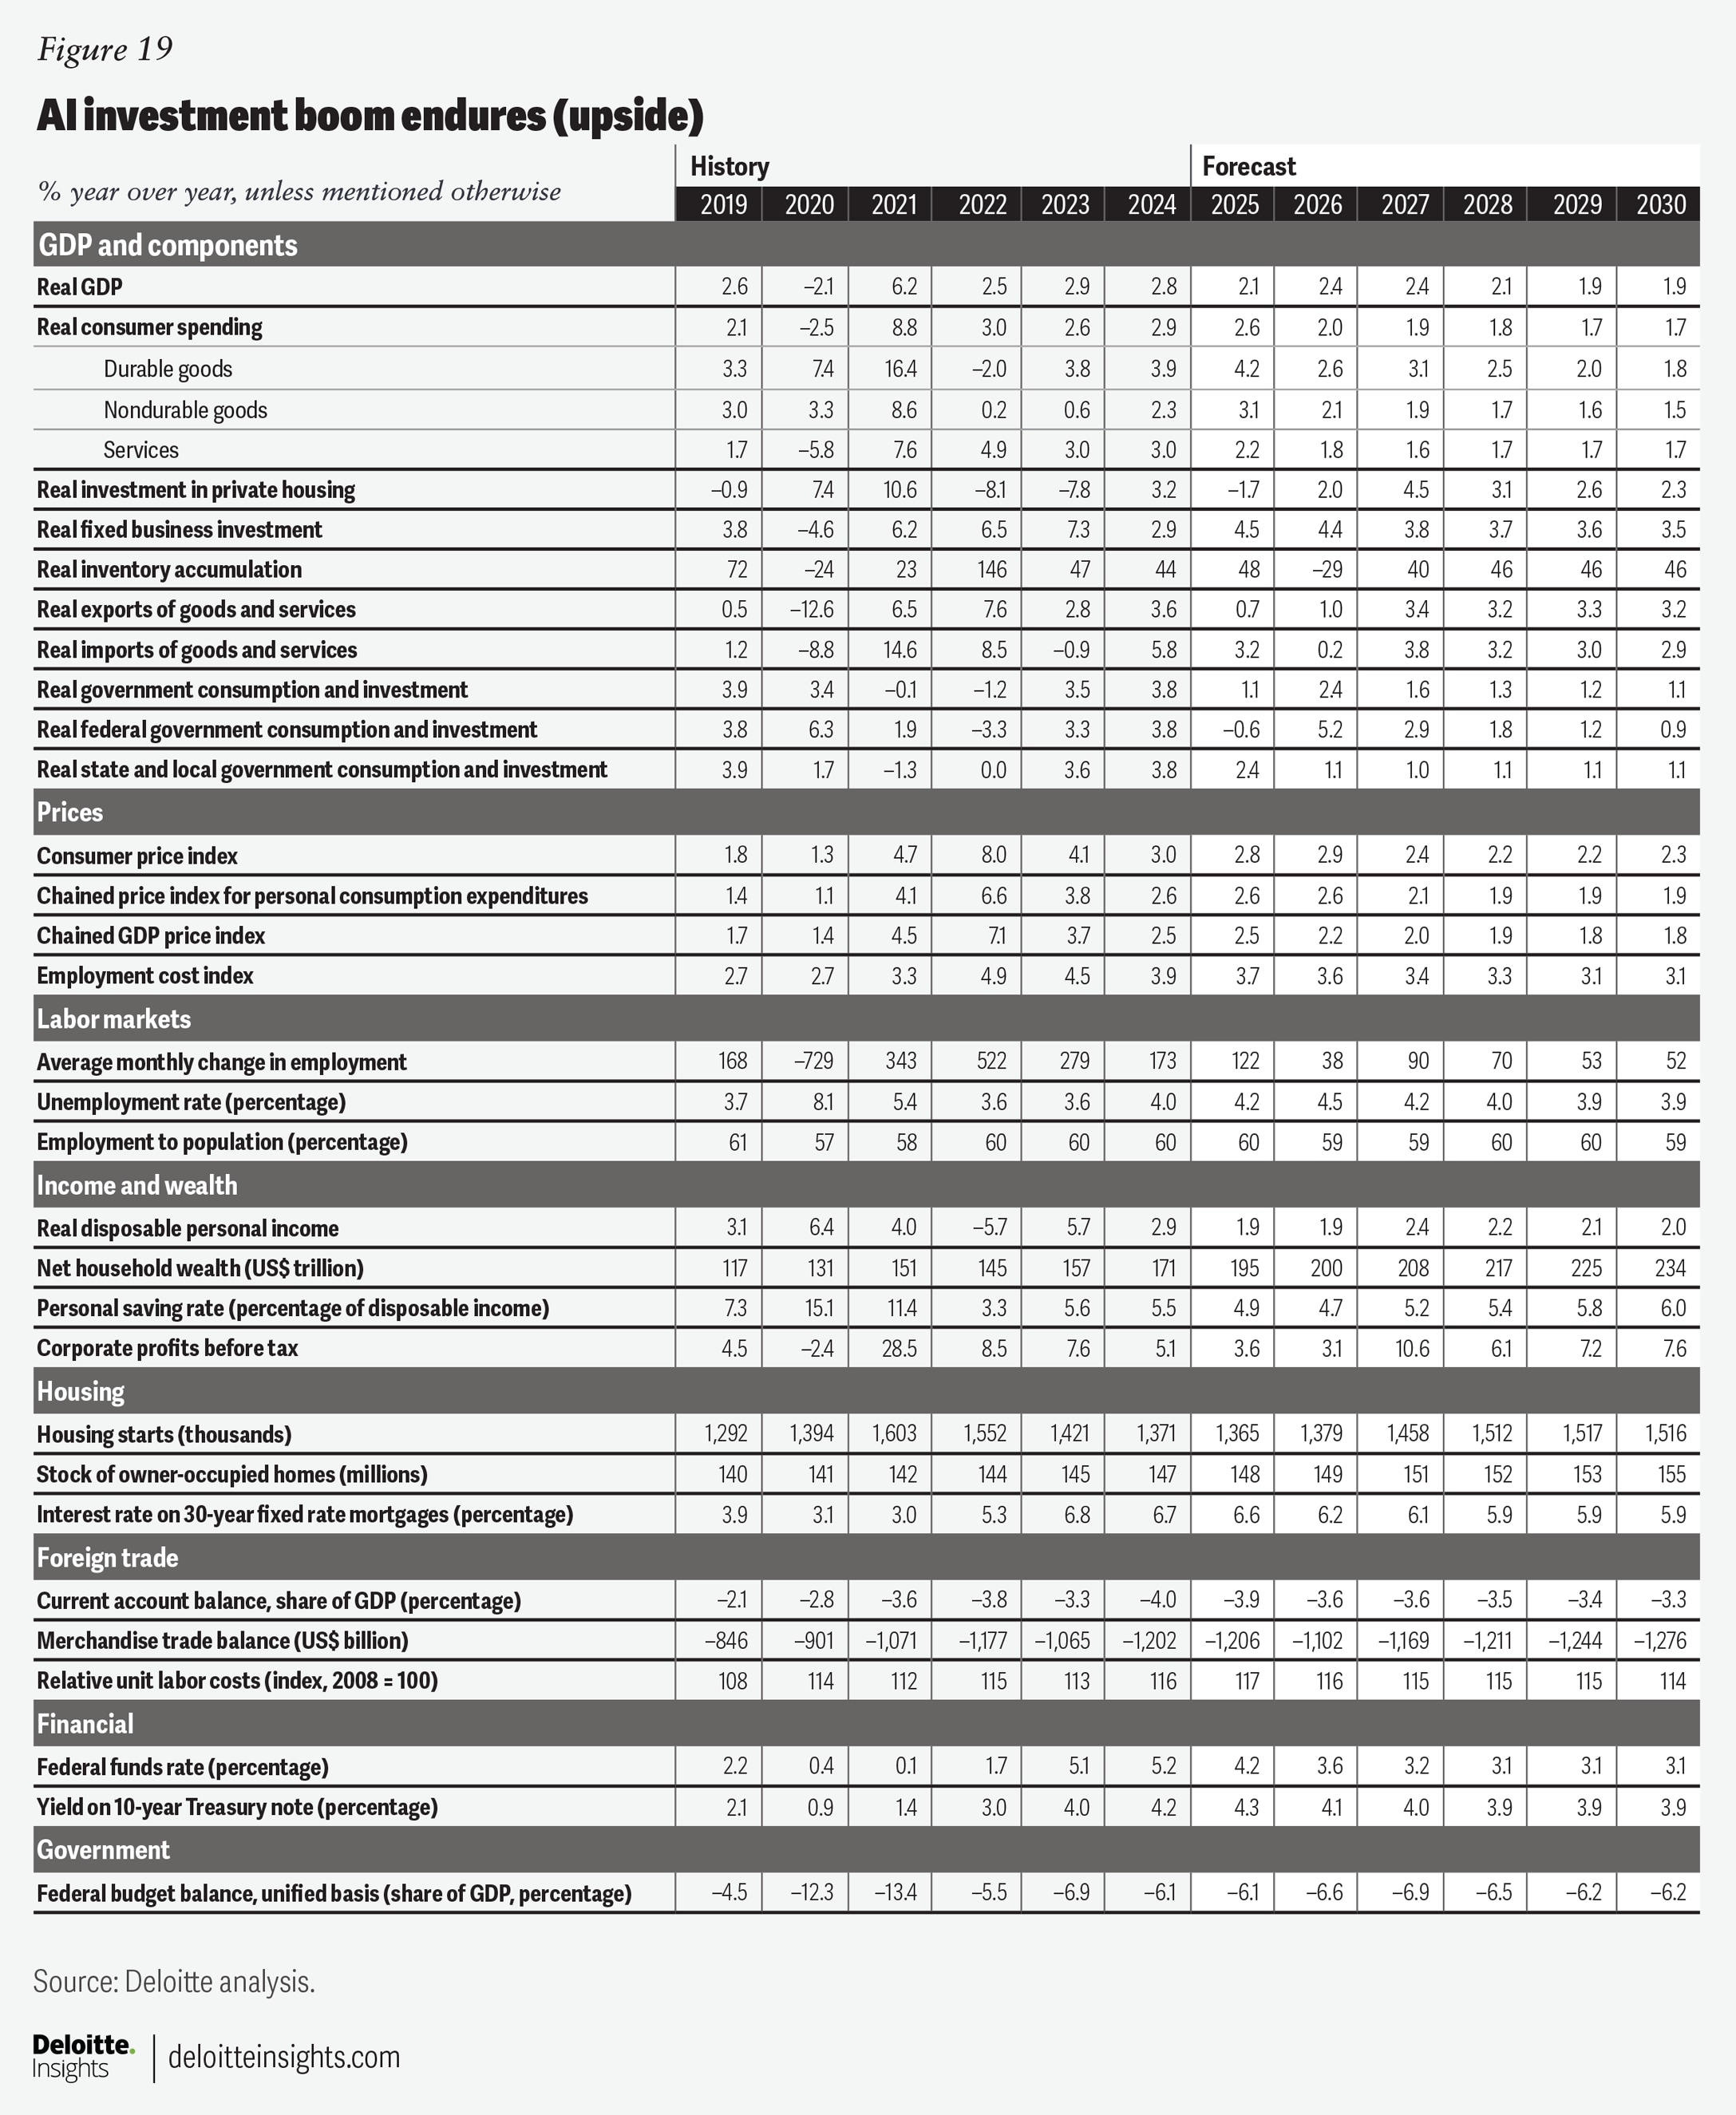
The upside scenario assumes that the tariff rate falls to about 7.5% by the end of 2026. We assume that Canada and Mexico secure favorable trade deals by the second half of 2026 under a revised United States–Mexico–Canada Agreement (USMCA). Moreover, we assume that product exemptions, court rulings, and additional trade deals lower the average tariff rate further. We also assume that net migration is stronger than in the baseline, lifting the adult population by about 1.7 million people by 2030 relative to the baseline. Business investment—driven by investments in AI—is expected to grow sustainably stronger than the baseline till the end of the forecast period in 2030.
Despite much lower tariffs and stronger business investment, the US economy is still expected to grow at a slower rate in 2025 compared with the previous two years. It is not until 2026 that the effect of the difference in tariff rates shows up more clearly in the inflation data. The rise in prices has been gradual so far since firms are absorbing the impact of tariffs.8 However, rising prices cause consumption to decelerate from recent years even though it’s considerably stronger relative to baseline. Strong immigration also puts upward pressure on aggregate demand. As a result, real consumer spending would expand by 2.2% in 2026, albeit lower than the 2.6% expected in 2025.
With an uptick in inflation, the Fed will likely take a more balanced approach to monetary policy. We assume the Fed leaves rates unchanged until December 2026. The average federal funds rate reaches its neutral 3.125% in the middle of 2027.
The yield on the 10-year Treasury in the upside scenario is expected to be higher than the baseline in the short term, till about middle of 2027, as investors see inflationary pressures continuing and the Fed adopting a more balanced monetary policy stance as a result. The 10-year Treasury yield will ease gradually between the third quarter of 2025 and the second quarter of 2027, to settle at 3.9% from the third quarter of 2027 through the end of 2030.
Business investment is expected to remain relatively strong throughout the forecast period. AI-related spending is expected to continue to fuel business investment in the next few years. With lower interest rates, stronger economic growth, and fewer tariff-related costs, business investment continues to accelerate, maintaining stronger growth between 2026 and 2028 compared with the baseline. Real business fixed investment is expected to grow 4.4% in 2026 and 3.8% in 2027.
Sectors
Consumer spending
US consumers have been resilient in recent months, with real PCE rising 2.4% in the third quarter compared with a year earlier. Spending on durable goods has been notably strong, rising 3.1% in inflation-adjusted terms. Nondurable goods were up 3%, while services grew 2.2%. Consumer spending growth likely moderated a little in the fourth quarter as the government shutdown prevented roughly US$14 billion of wages from being paid to affected workers.
Although the share of tariff costs passed on to consumers has been more muted than we had anticipated, goods inflation is clearly rising quickly. As a result, consumer confidence has weakened notably. For example, the University of Michigan’s consumer sentiment index for current conditions hit an all-time low in the fourth quarter.9 Although inflation expectations have come down some from earlier this year, the expectation for inflation over the next five years was still 3.5% in the fourth quarter. Prior to this year, this was the highest quarterly reading since 1993.
Despite the resilience of consumer spending this year, consumption is expected to slow in 2026. Aggregate wage growth has been softer than aggregate consumer spending on a year-ago basis in 14 of the last 16 months. With employment and per-worker wage growth moderating, aggregate income growth will weaken further. We expect consumer spending growth will also slow as it comes into better alignment with income growth. In addition, higher delinquency rates on credit cards, student loans, and auto loans point to weaker spending on the horizon.
Although the Fed cut rates by 75 basis points (bps) in the second half of 2025 and will likely cut rates by another 50 bps in 2026, longer-term interest rates are expected to remain more elevated, limiting the transmission of looser monetary policy. Longer-term interest rates remain relatively high because some Fed rate cuts are already priced into longer-term bond yields and because inflation expectations also remain elevated. Still-strong investment spending growth will apply additional upward pressure on longer-term interest rates.
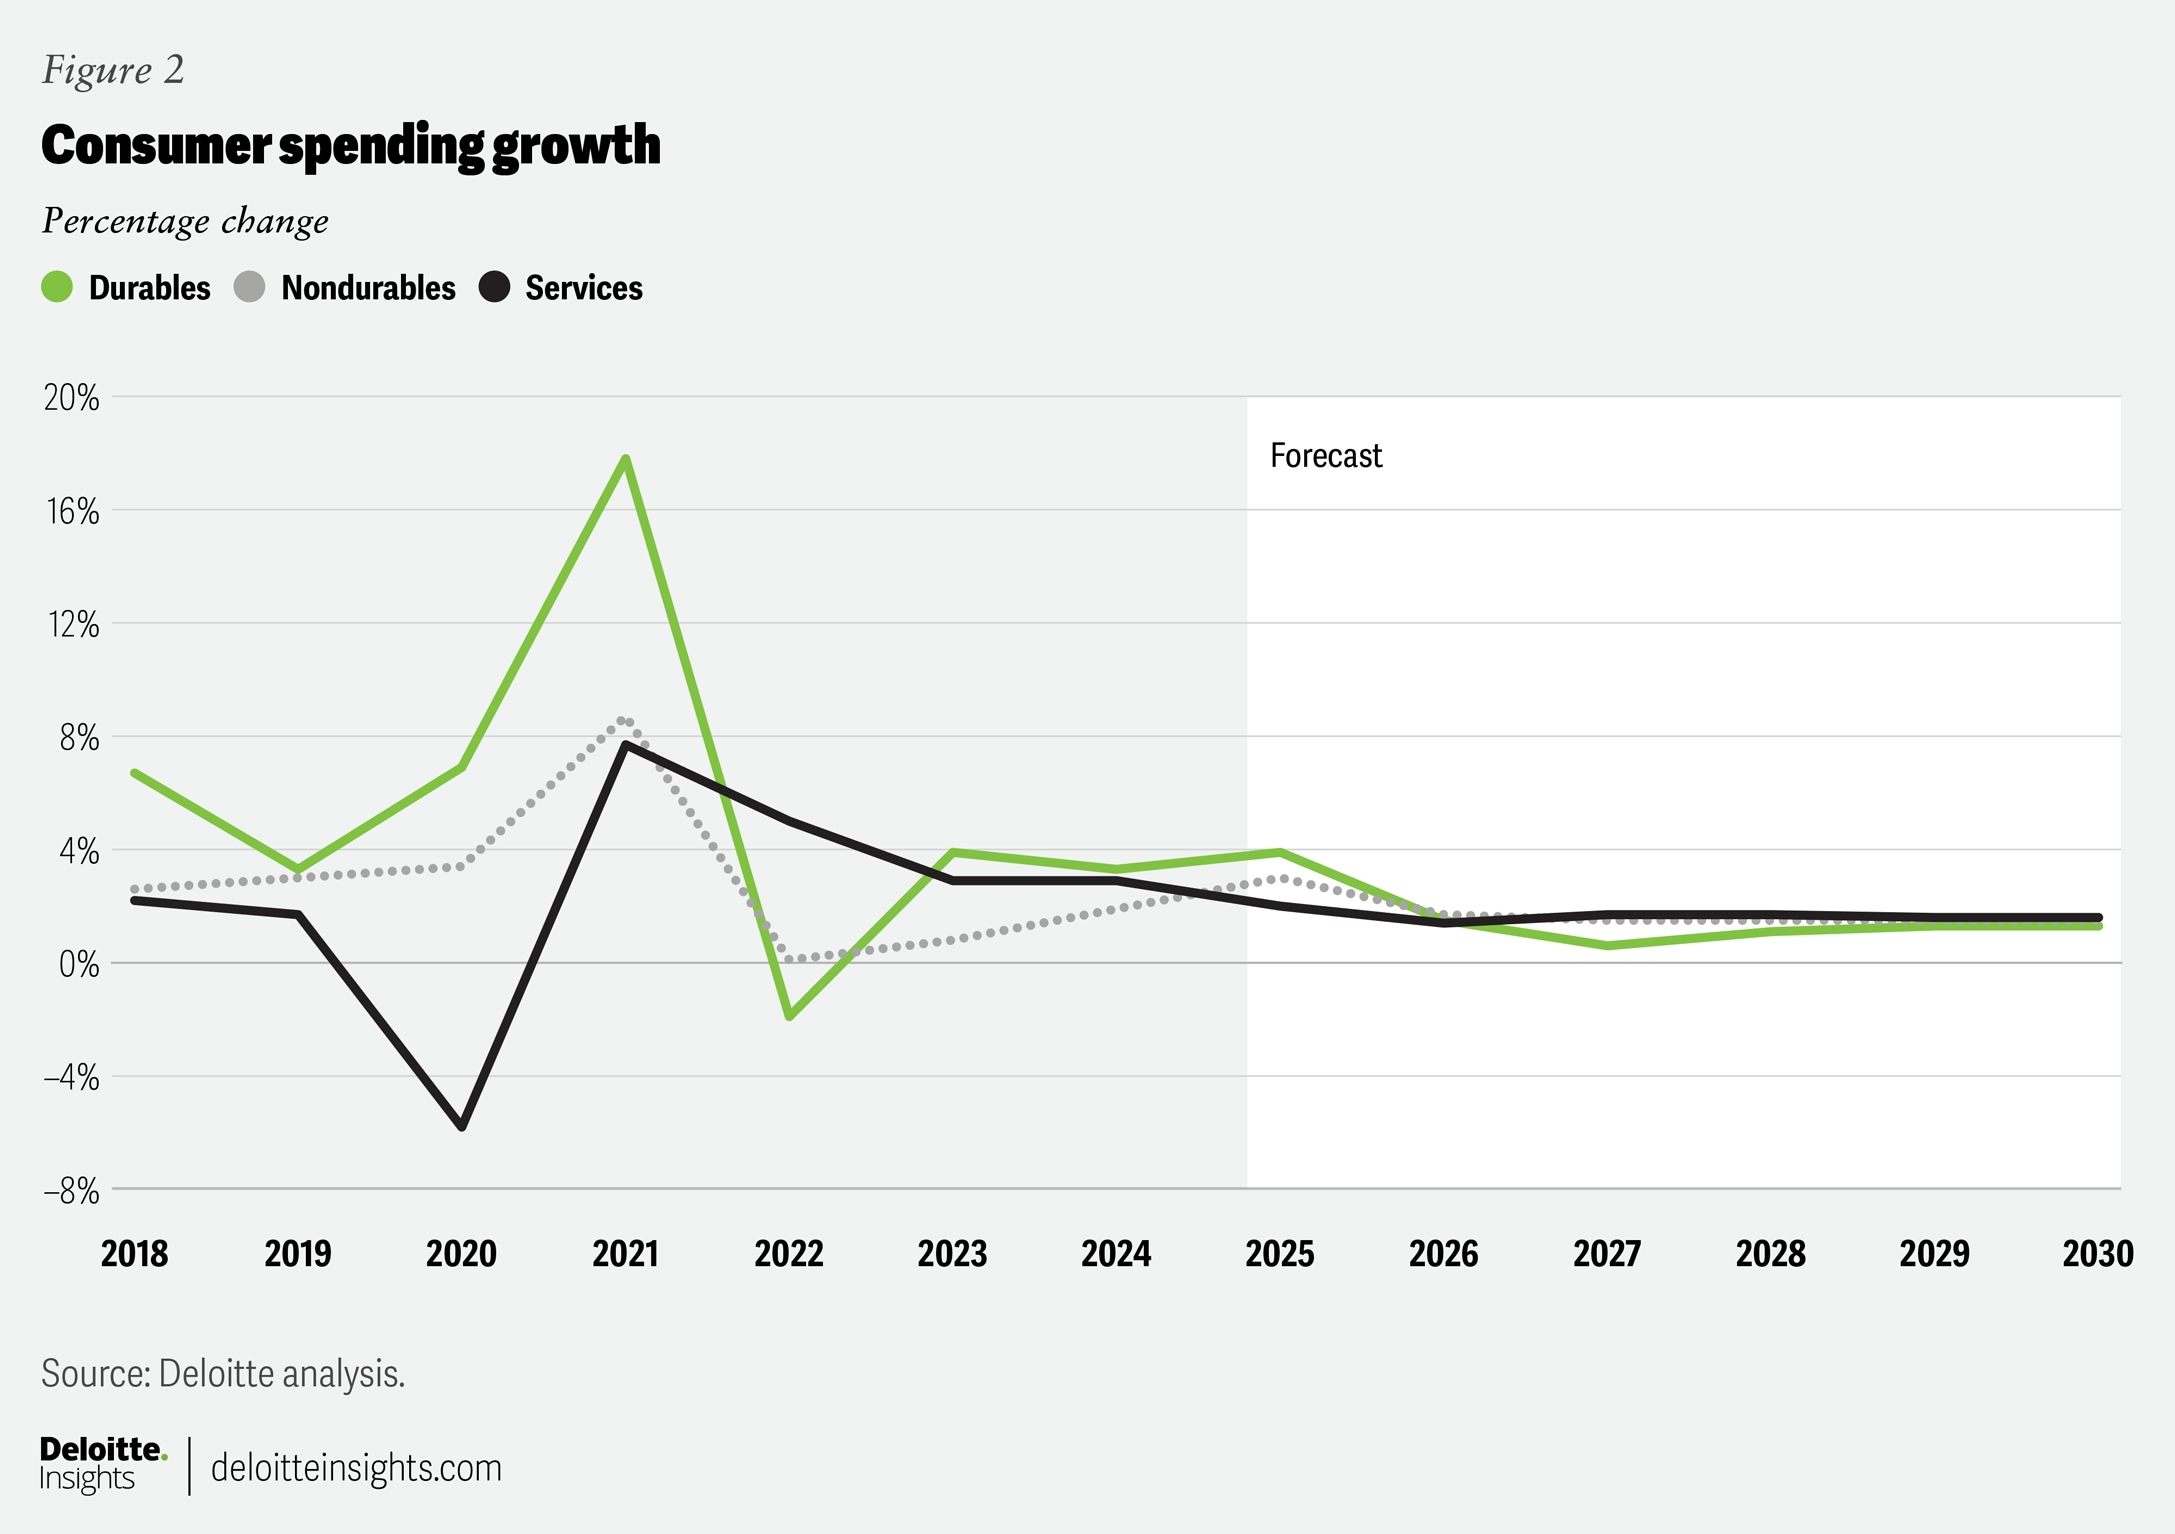
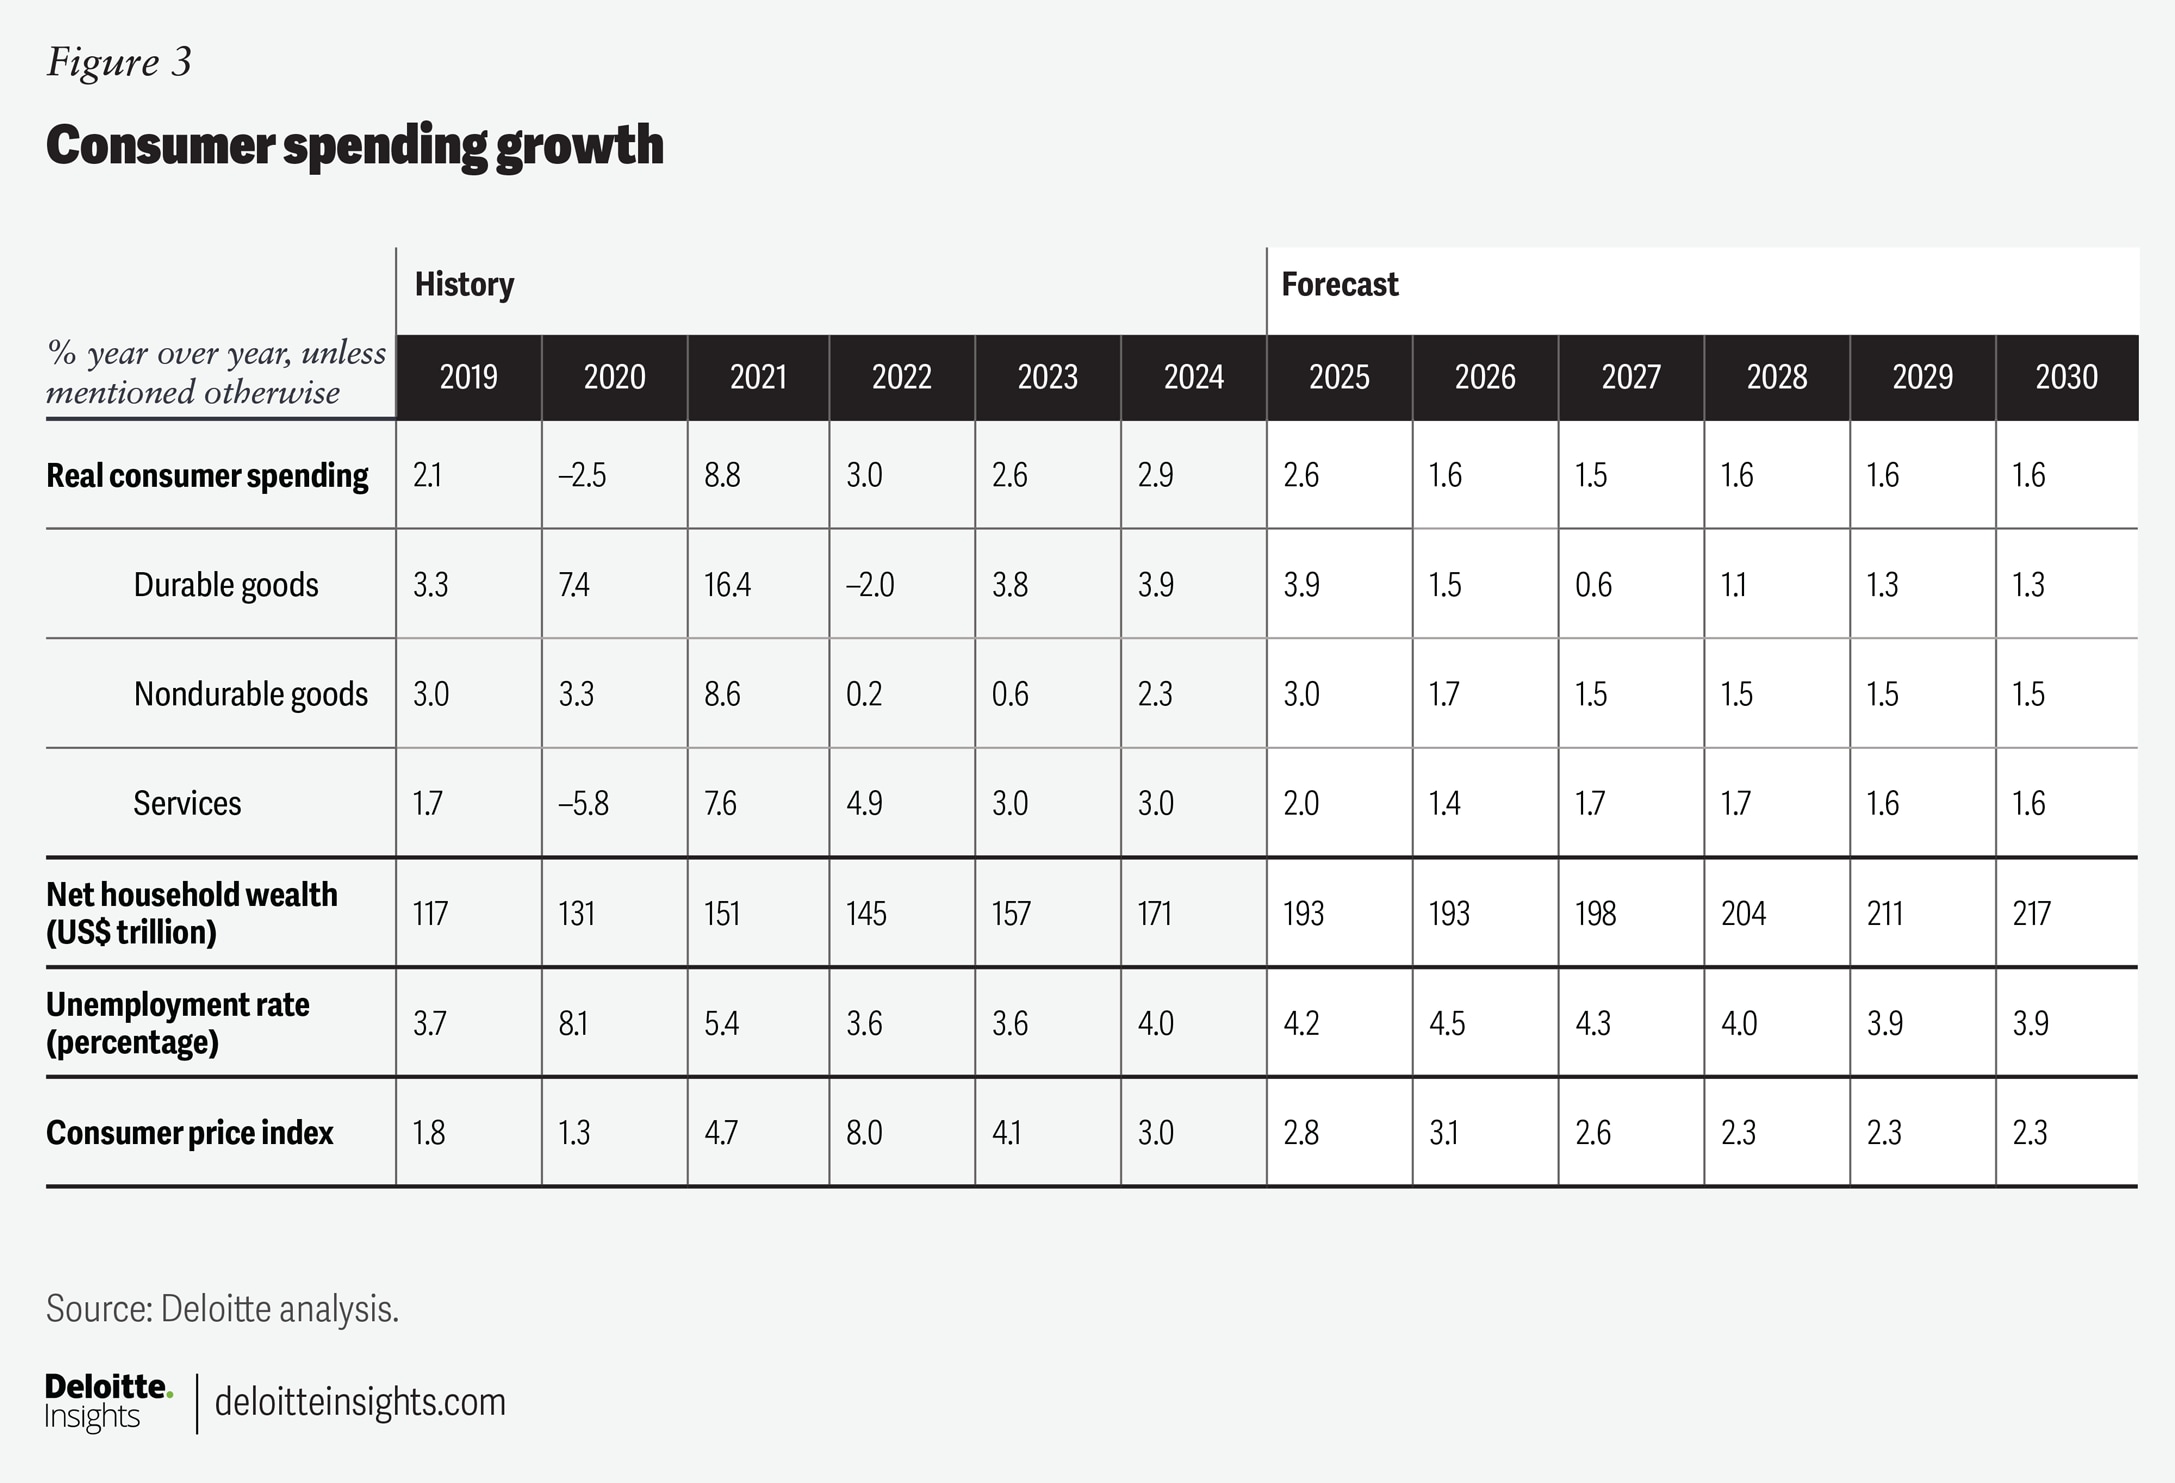
Overall, we forecast real consumer spending to grow quickly in 2025, rising 2.6% from the previous year. Consumer spending is then expected to slow to 1.6% in 2026 as inflation, a weakening labor market, and slower stock price gains restrain growth. Spending on durable goods has been unusually strong relative to other types of spending, suggesting that durable goods spending growth is poised for a slowdown. Indeed, we expect real consumer spending growth on durable goods to go from a lofty 3.9% in 2025 to 1.5% in 2026 and 0.6% in 2027. Spending on nondurable goods is expected to rise by 3% in 2025 and 1.7% in 2026. Finally, spending on services is expected to increase by 2% in 2025 and 1.4% in 2026. However, services spending growth is expected to accelerate to between 1.6% and 1.7% for the remainder of the forecast (figures 2 and 3).
Housing
Long-term interest rates have been elevated this year, with the 30-year treasury yield never dipping below 4.4%.10 The 30-year fixed mortgage rate has moved lower, falling just below 6.3% for the week ending December 5.11 The same rate had been above 7% for all of January 2025. The decline in mortgage rates likely encouraged more residential investment in June and July. However, housing starts plummeted in August, and mortgage rates are still quite high given current rates of inflation and economic growth.
The outlook for residential investment remains weak amid elevated mortgage rates. For example, residential building permits, a leading indicator of housing starts, were down 9.9% year over year in August. Housing starts never returned to their peak levels from before the global financial crisis of 2008–2009. Persistent challenges in increasing housing supply have contributed to the lack of inventory and elevated prices we see today in some parts of the country. We may have to wait for rates to drop to see a significant uptick in housing construction.
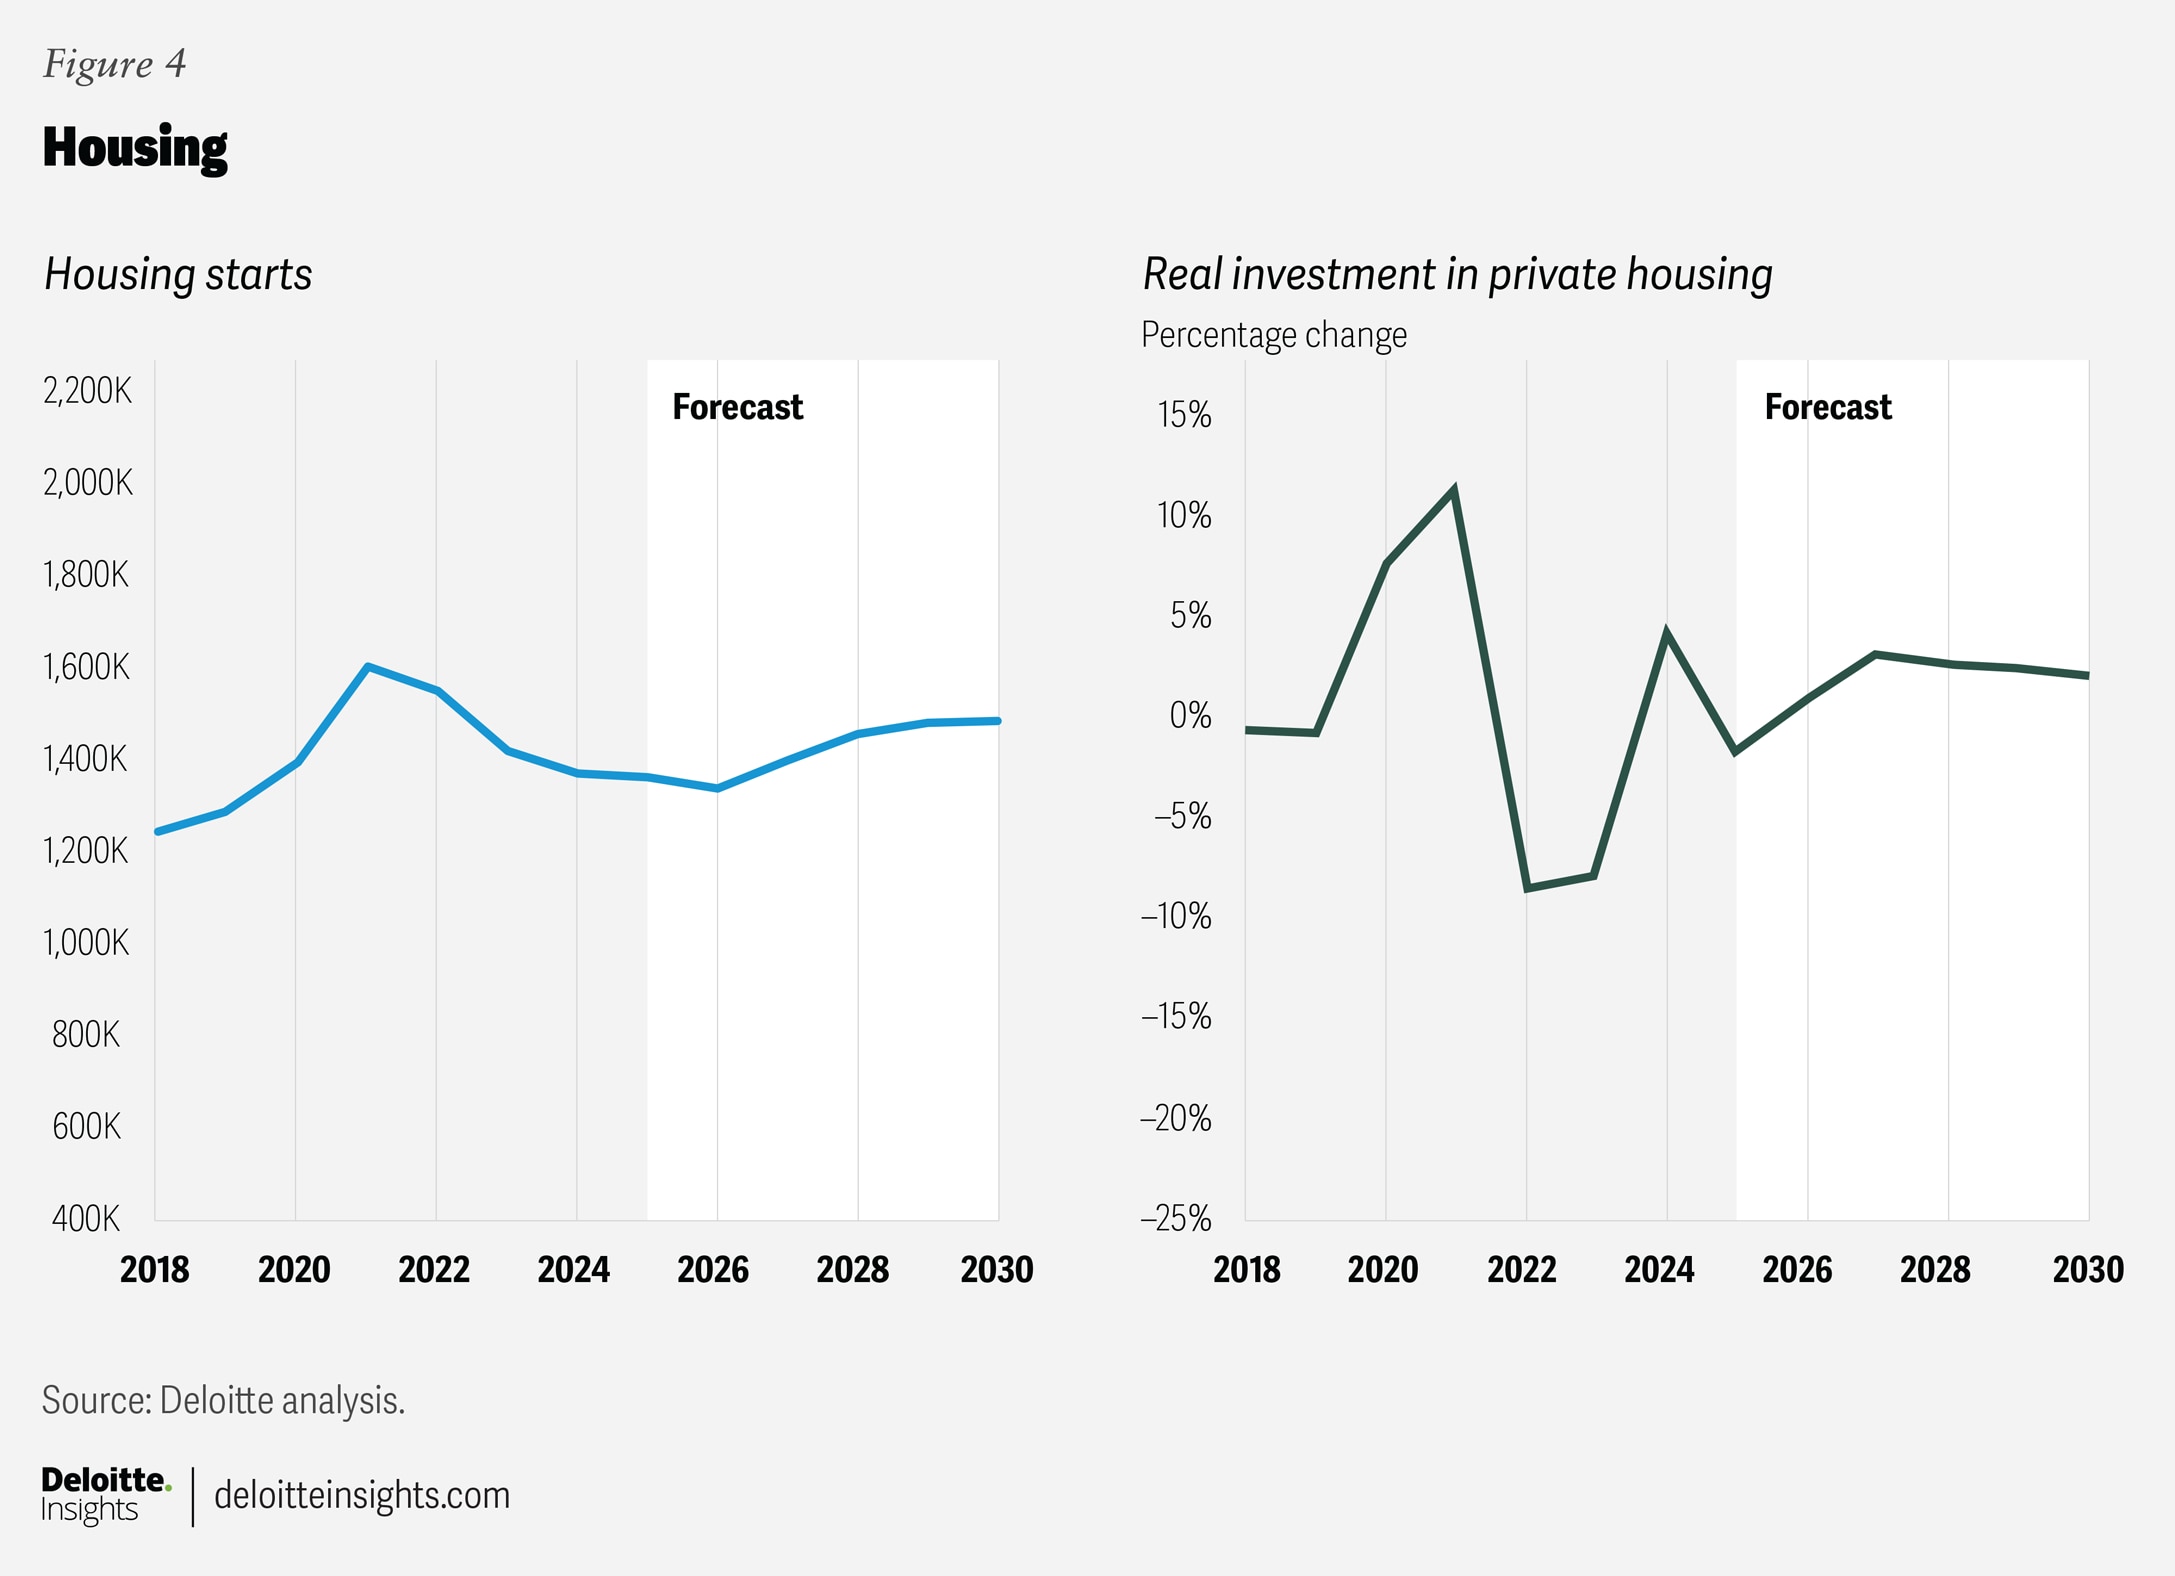
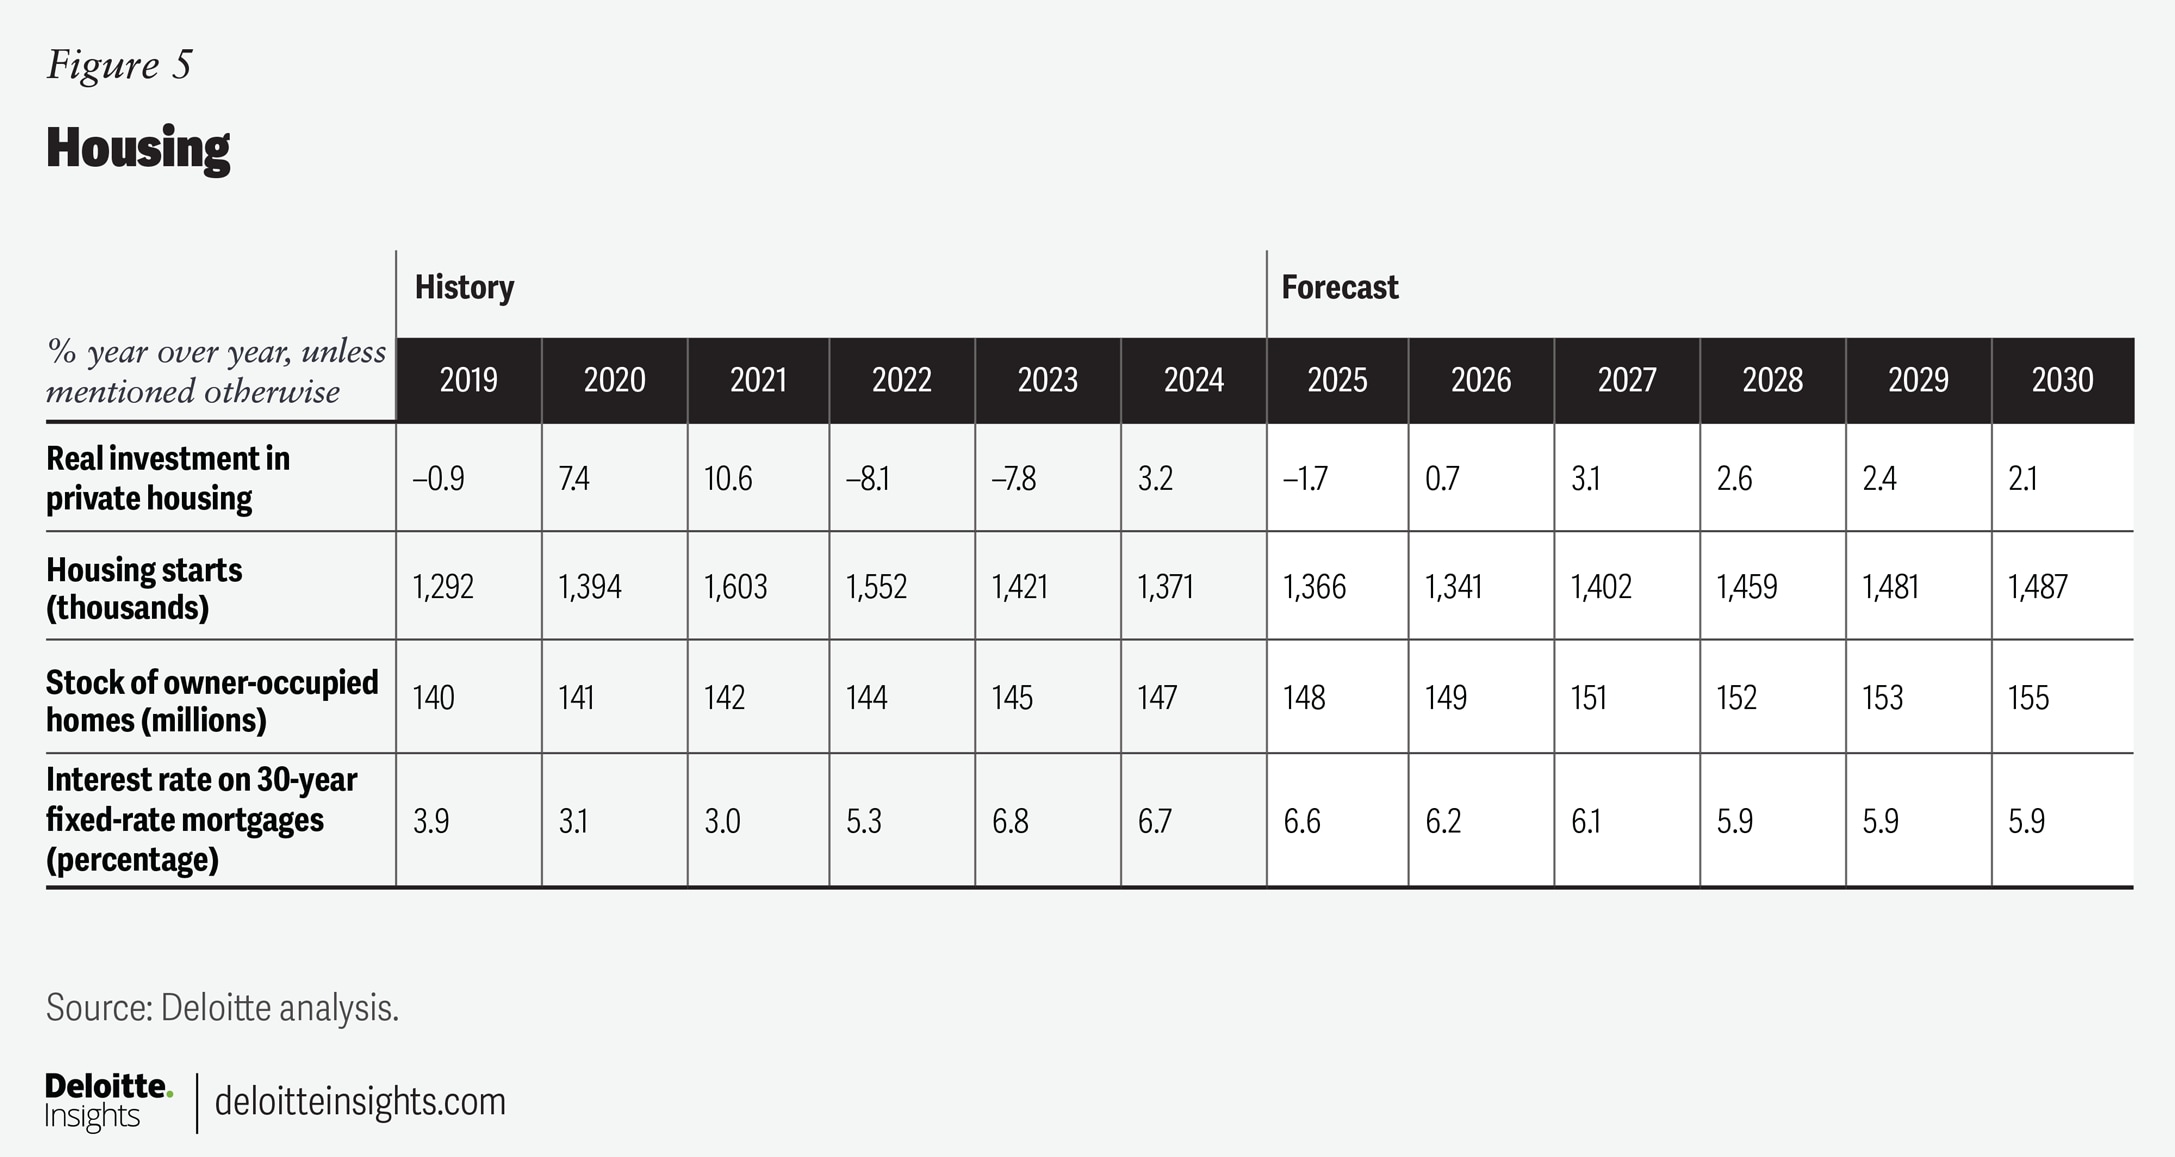
We expect housing starts to fall through the first half of 2026, before rising again in the second half of the year. Overall, in 2025, we expect housing starts to be 1.37 million before falling to 1.34 million in 2026. Thereafter, we anticipate housing starts to rise through 2030 as the Federal Open Market Committee (FOMC) cuts rates further. From 2027 through 2029, we expect the housing stock to rise more rapidly than total population, but housing starts are expected to slow toward population growth by 2030 as demographics restrain residential investment.
Although the supply of new housing growth is expected to fall over the next few quarters, demand for housing is also expected to wane. As a result, home price appreciation will remain subdued into 2027. We expect the benchmark home price index to rise by 2.5% in 2025 and by just 1.2% in 2026. In the outer years of the forecast, the house price index is expected to rise by a little less than 4% (figures 4 and 5).
Business investment
Investment is spending that helps grow the long-term productive capacity of the economy, and as such, it is one of the most important indicators of an economy’s future potential. Investment often follows a cyclical pattern, driven by commodity price booms and economic cycles. It can also be incentivized by policies like lower taxes or subsidies for investments.
Business confidence is a crucial determinant of the level of investment growth, as businesses need to feel positive about their future potential to justify spending money to grow their operations. Regional Federal Reserve Bank surveys of capital expenditure intentions have generally indicated relatively weak investment in the months ahead. The share of small businesses planning to make capital expenditure fell in November, keeping the share quite low by historical standards.
Interest rates also influence investment. Corporate borrowing rates increased along with inflation into 2023. Since then, rates mostly moved sideways, before declining modestly in recent months. Many firms still have more cash on hand than they did before the pandemic, and they can consequently avoid borrowing at elevated rates.
After posting a 7.5% decline in the second quarter of 2025, we predict investment in structures to remain weak until the end of the year. Overall, we predict investment in structures to fall 5% in 2025 and grow just 0.4% in 2026.
Besides structures construction, other types of business investment include spending on machinery and equipment (M&E), such as on computers or industrial equipment, and on intellectual property, such as software. Businesses accelerated their purchases of equipment in the first half of 2025 in anticipation of tariffs. Real spending on equipment was up 8.1% in the second quarter when compared to a year earlier.
Frontloading purchases was not the only reason for such strong growth. Investment in equipment to power data centers as demand for AI surges also contributed significantly to this growth. For example, investment in information-processing equipment was up 20.4% from a year earlier in the second quarter.
Similarly, investment in intellectual property products jumped 5.7% over the same period, with software rising 12.2%. We expect both these categories of investment to remain relatively strong as businesses push through the headwinds of high tariffs, elevated interest rates, and weakening demand. Our forecast shows M&E investments rising 8.3% in 2025 and 4.4% in 2026. We see intellectual property spending rising 5.6% in 2025 and 4.9% in 2026.
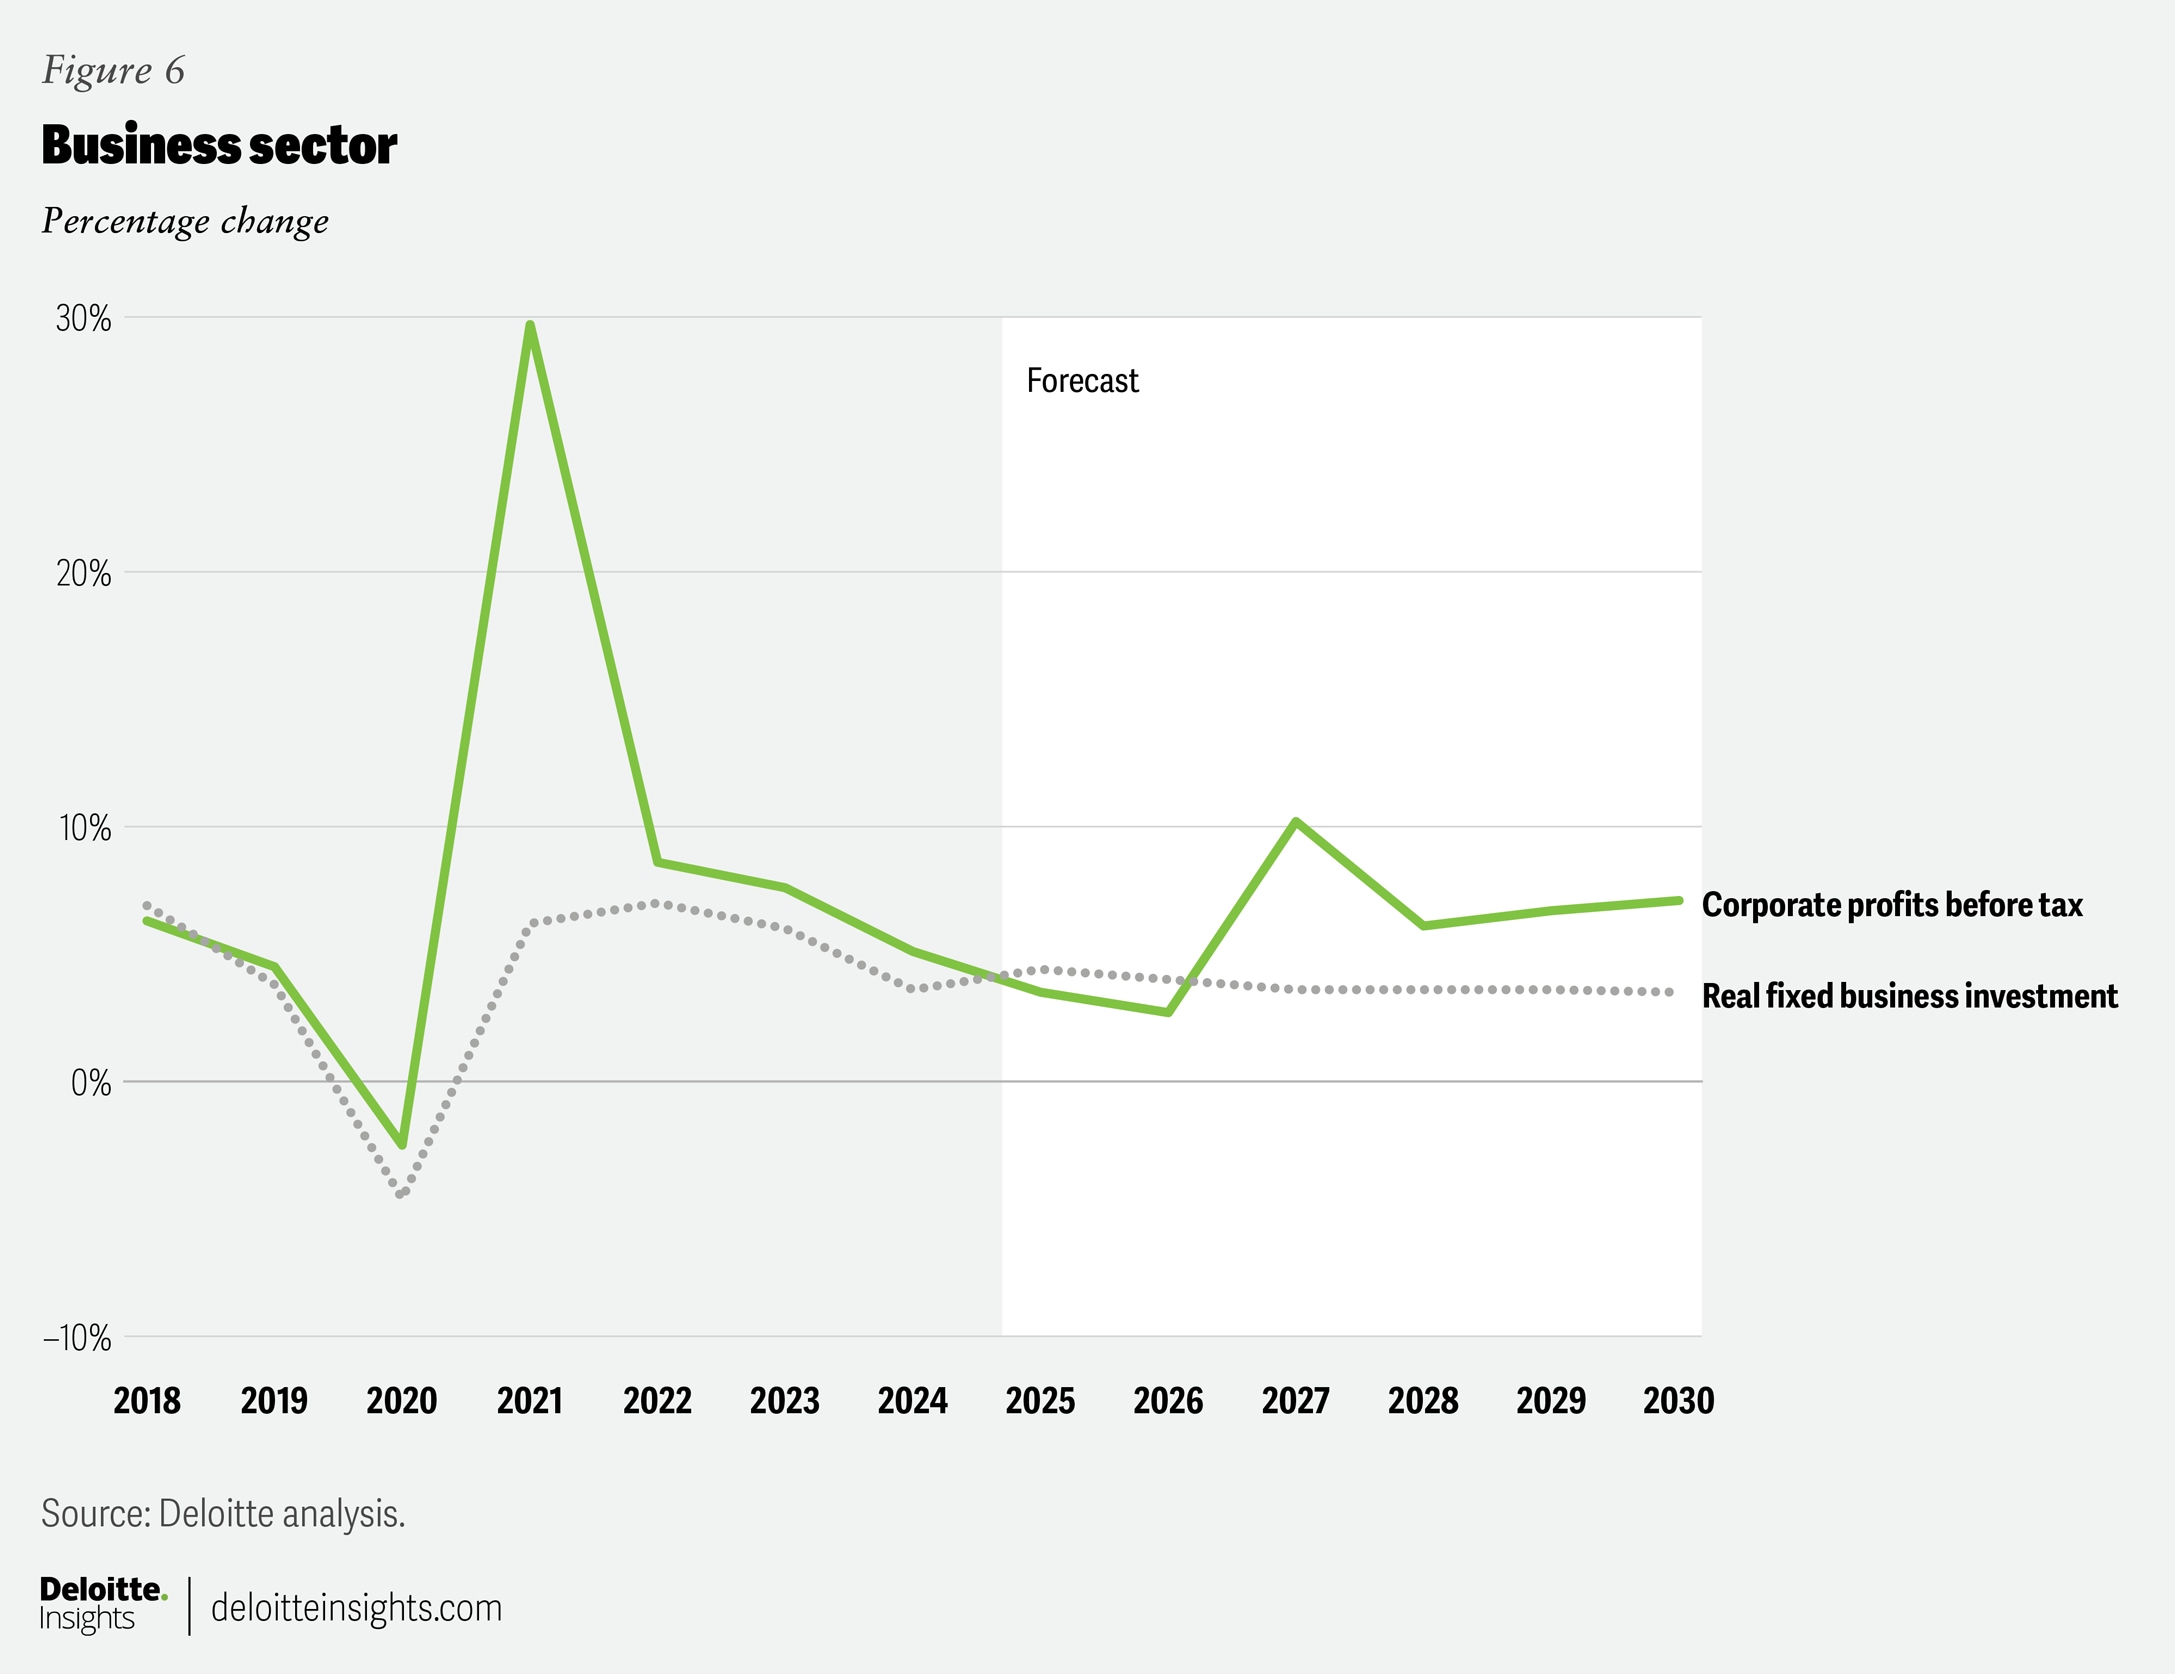
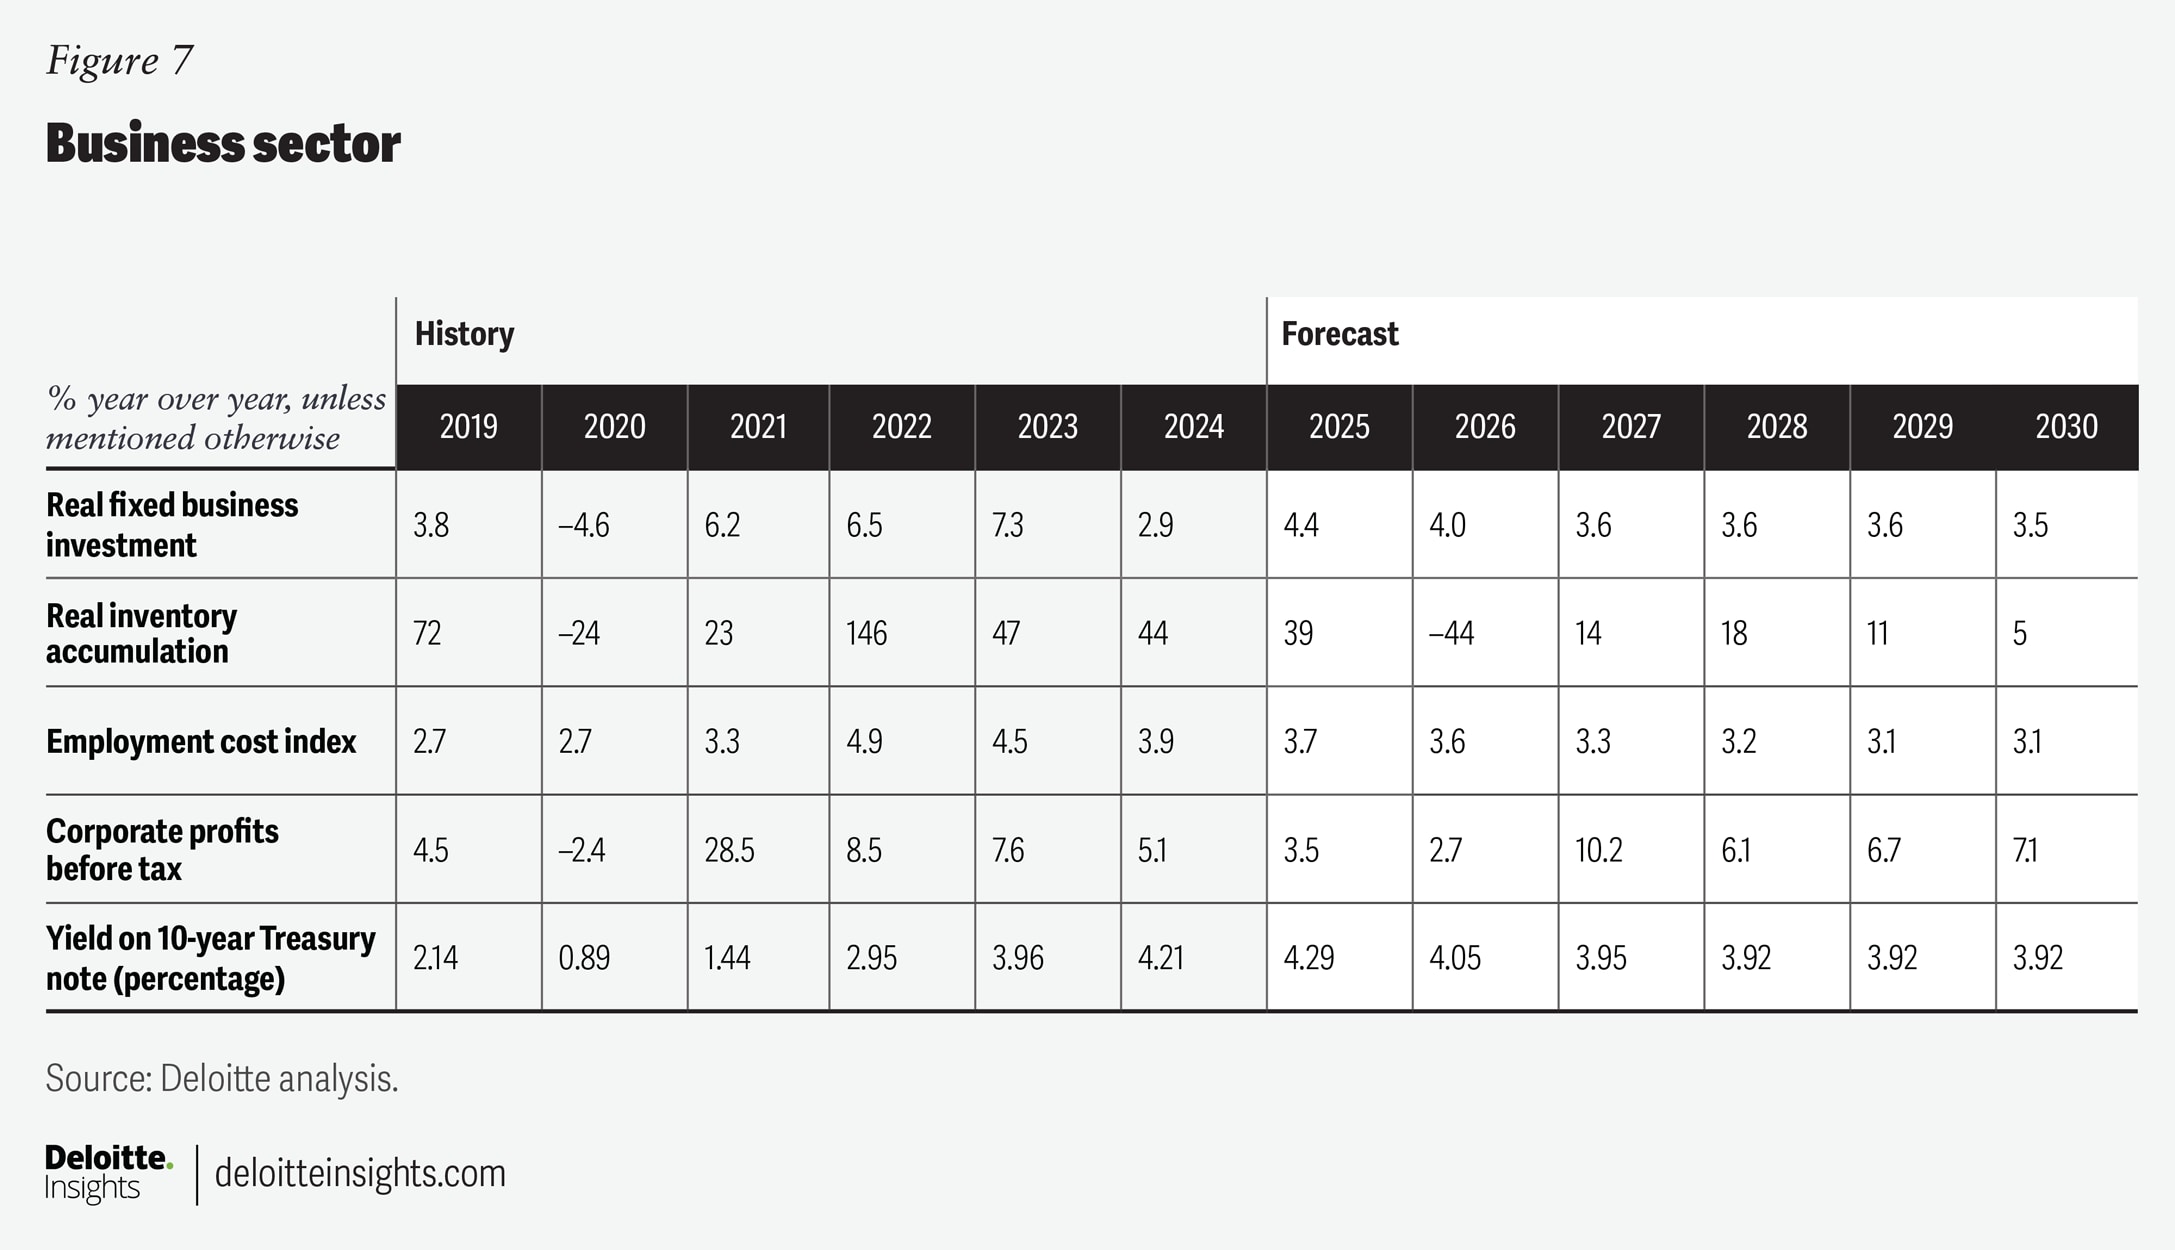
The resumption of bonus depreciation that had been gradually phased out under the Tax Cuts and Jobs Act (TCJA) is expected to support investment spending beginning next year. However, higher tariffs and interest rates restrain growth in the near term. Overall, in 2025, we predict business investment to rise 4.4%, up from 2.9% in 2024. Although we expect AI-related investment to remain strong in 2026, the growth rate is expected to wane. Rising inflation will also work against business investment growth. Even so, the pace of business investment is expected to be a still-strong 4% in 2026. Business investment growth is expected to moderate to around 3.6% for the remainder of the forecast (figures 6 and 7).
Foreign trade
Foreign trade remains the sector marked by considerable uncertainty. The tariff landscape is evolving quickly. On November 5, the US Supreme Court heard oral arguments on the US administration’s use of the International Emergency Economic Powers Act to implement tariffs.12 Thus, the future path of tariffs and trade policy remains highly uncertain. Given the difficulty of predicting the specific package of tariffs that may be introduced, or the possible duration of time they may remain in force, we have chosen to build our forecast around the average effective tariff rate, rather than on a specific selection of imports.
In our baseline scenario, we raised the average tariff rate on goods imports by 12.5 percentage points, from approximately 2.5% at the start of this year to 15%. The Yale Budget Lab estimates that the pre-substitution tariff rate was 16.8% as of November 17.13 We assume that the average effective tariff rate is lower than this rate because buyers can substitute away from the most affected goods and because numerous products are exempt from tariffs. In addition, we expect a rising share of imports from Canada and Mexico to enter the United States duty free as they officially become compliant with the USMCA.
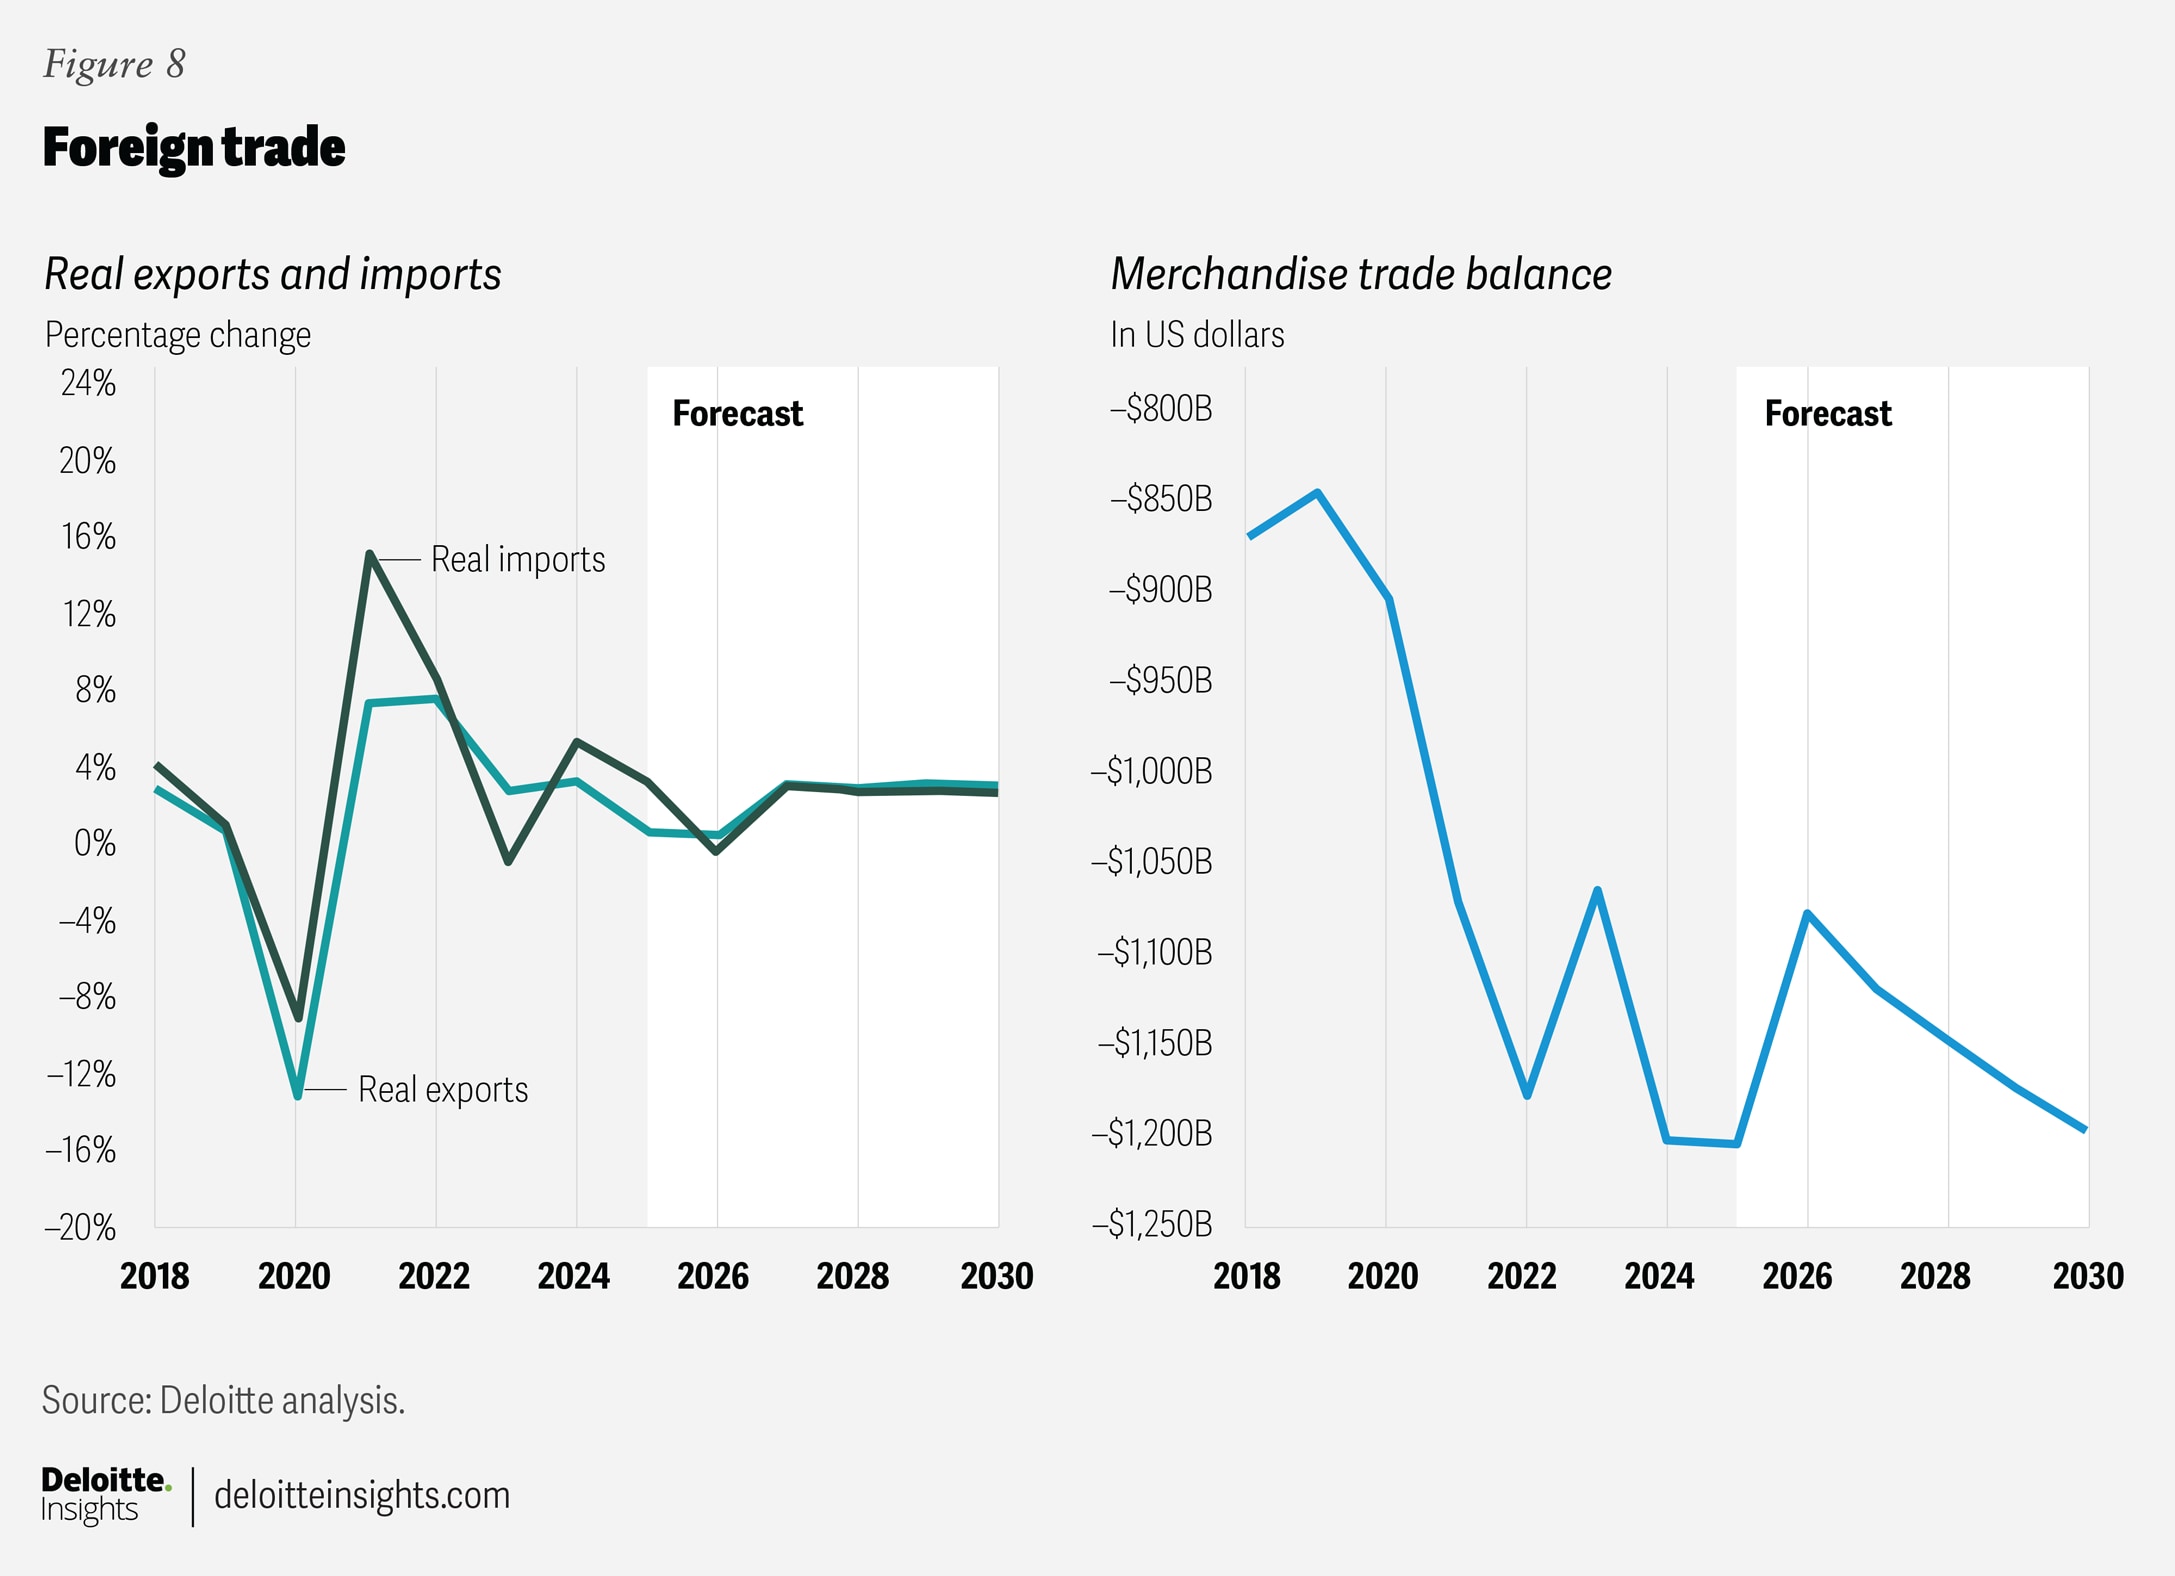
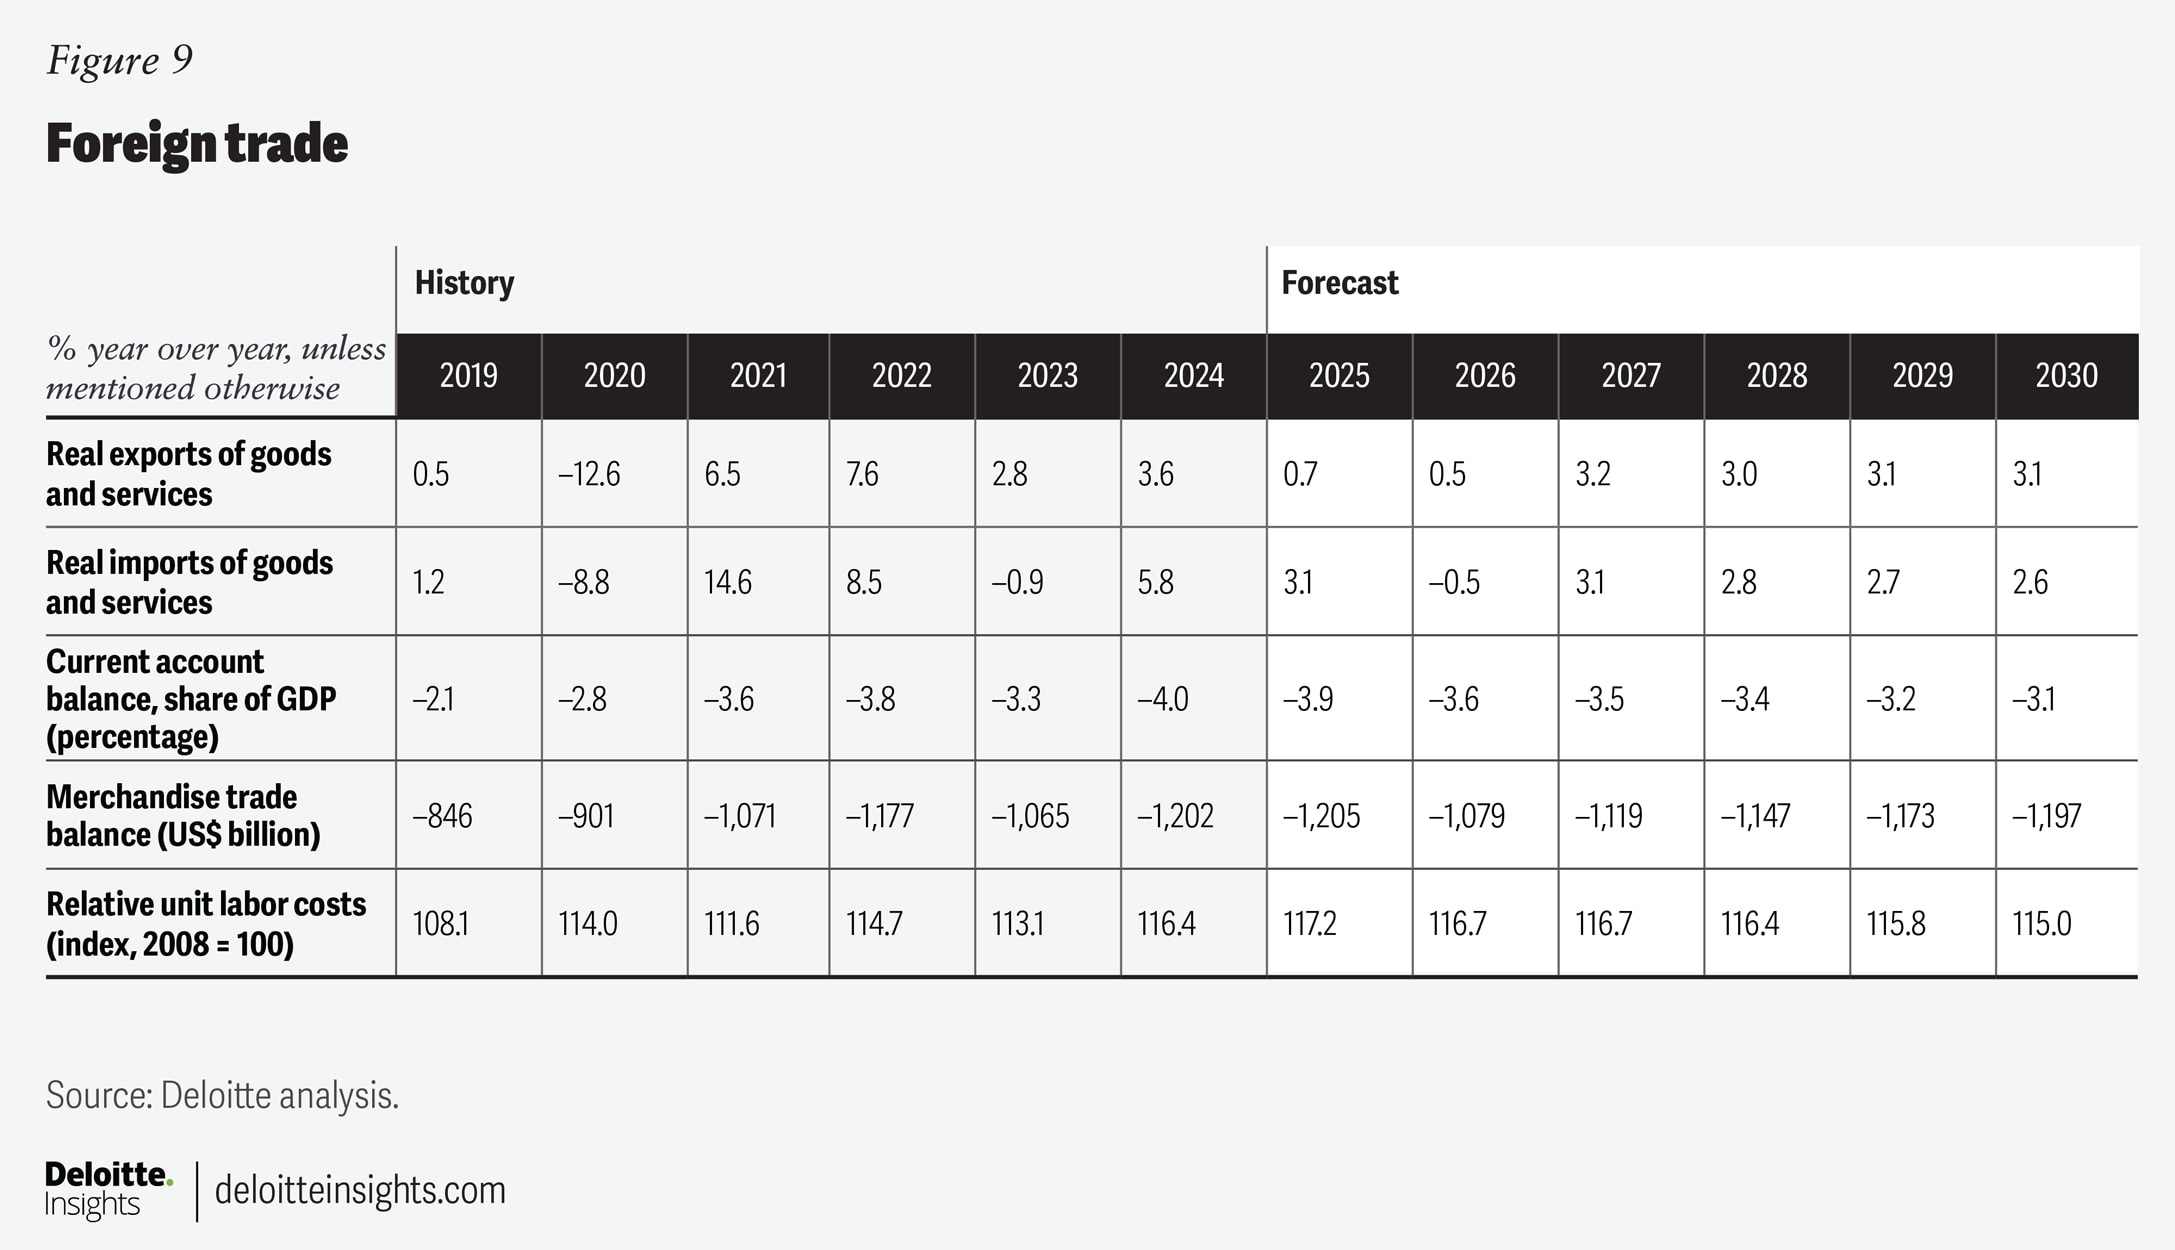
The imposition of these tariffs is likely to turn into a complicated process involving individuals and businesses trying to make substitution and supply chain decisions based on new relative prices. As elevated tariffs remain in place, we expect growth in exports and imports to be 0.7% and 3.1% in 2025, respectively. Import growth for this year as a whole is flattered by a surge in imports at the start of the year in anticipation of looming tariffs. Trade growth slows more dramatically in 2026, with exports growing 0.3% and imports falling 0.6% (figures 8 and 9).
Government policy
In July 2025, the administration enacted new tax legislation, commonly referred to as the One Big Beautiful Bill Act, which includes changes to federal tax and spending laws. The Congressional Budget Office (CBO) expects that the bill would add about US$3.4 trillion to the federal deficit over the next 10 years excluding debt service and macroeconomic effects. The CBO also estimates that adding in debt service costs would bring the total cost of the bill to US$4.1 trillion over the next 10 years. Most of that rise in the deficit will occur earlier in CBO’s 10-year forecast window. For example, just over US$1 trillion would be added to the deficit in 2026 and 2027 alone.
Some of the most significant tax cuts in the bill include an extension of the tax provisions in the TCJA that were set to expire and an elimination of taxes on overtime and tipped income. To offset these tax reductions in the budget window, savings are found by adjusting certain tax credits that were enacted under the Inflation Reduction Act and reducing expenditures on Medicaid and food assistance programs.
Although the increase to the deficit is expected to be substantial, the economic effects are more limited. Much of the cost of the budget bill is spent extending tax provisions that are already in place. Extending those provisions creates neither a stimulative nor contractionary effect. After removing those provisions, the direct effect of the bill is expected to support economic growth through 2026 before it becomes increasingly contractionary through the end of the forecast period.
In addition to the budget bill, trade policy also generates revenues. There is substantial uncertainty over how much revenue these tariffs will generate. The CBO estimates that tariff revenue could amount to US$4 trillion through 2035. However, the Yale Budget Lab estimates that tariffs will generate about $2.3 trillion over the same period after accounting for dynamic effects.14 Using our baseline assumptions for tariffs and immigration, we estimate that tariffs would create about US$2.5 trillion in revenue over the next decade.
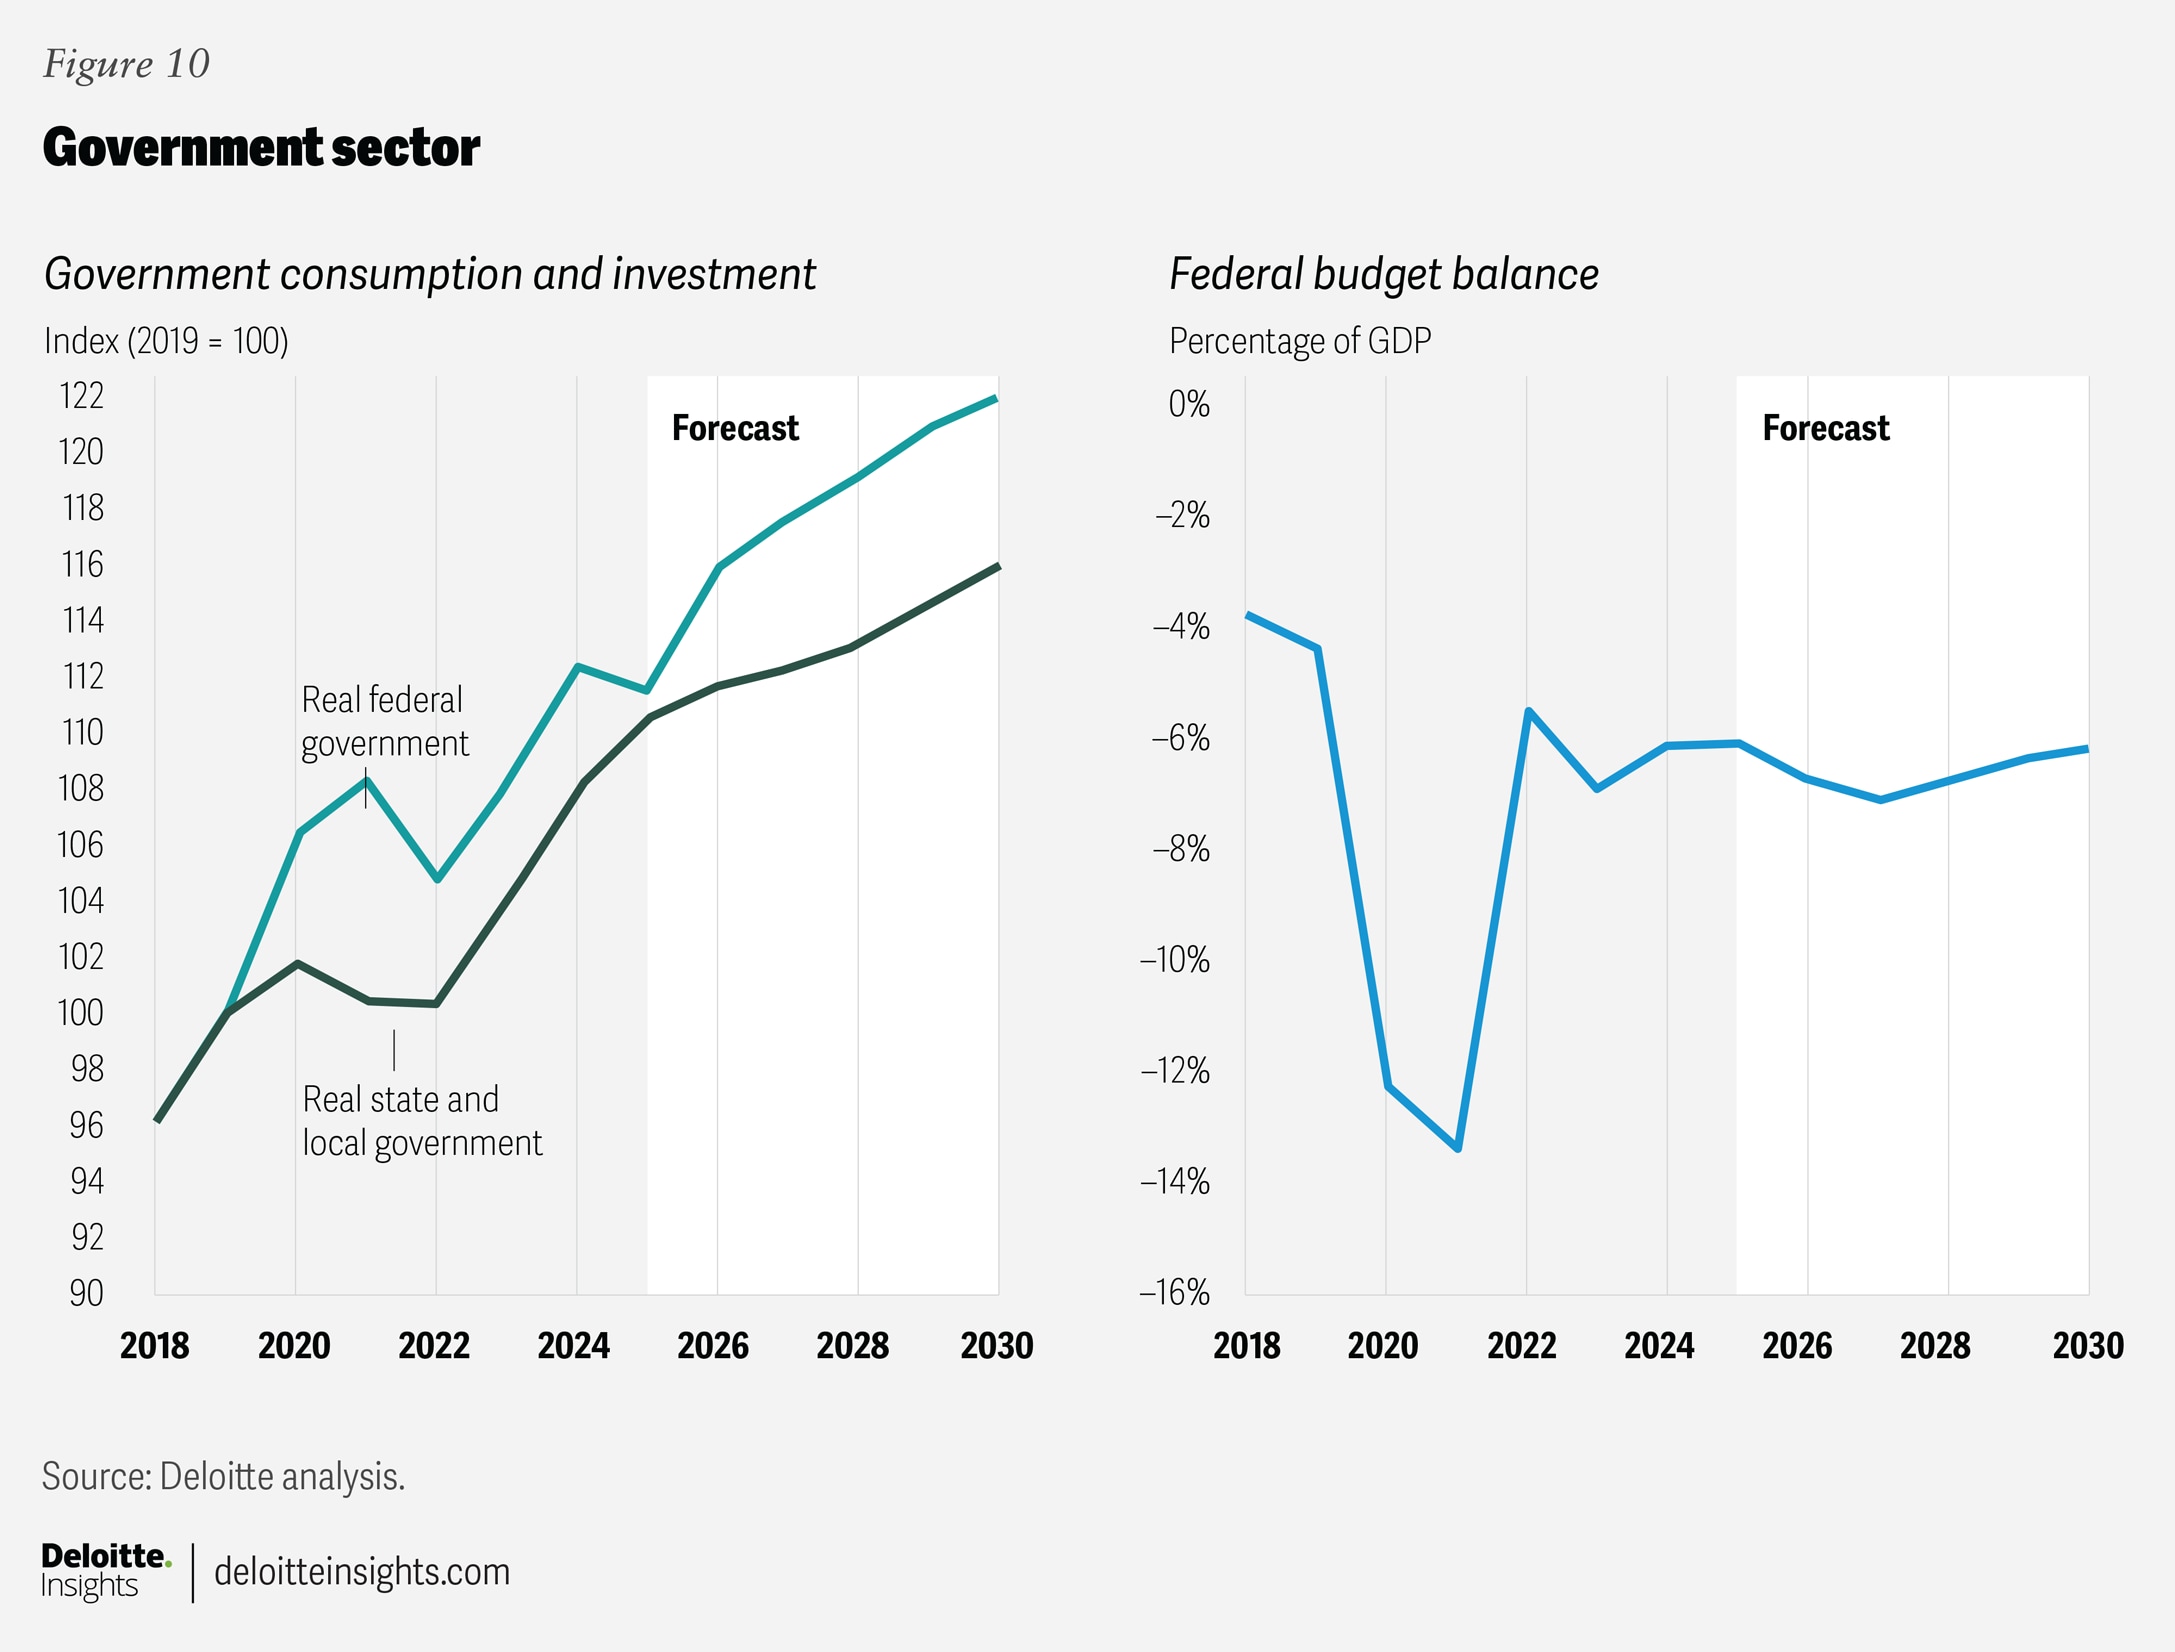
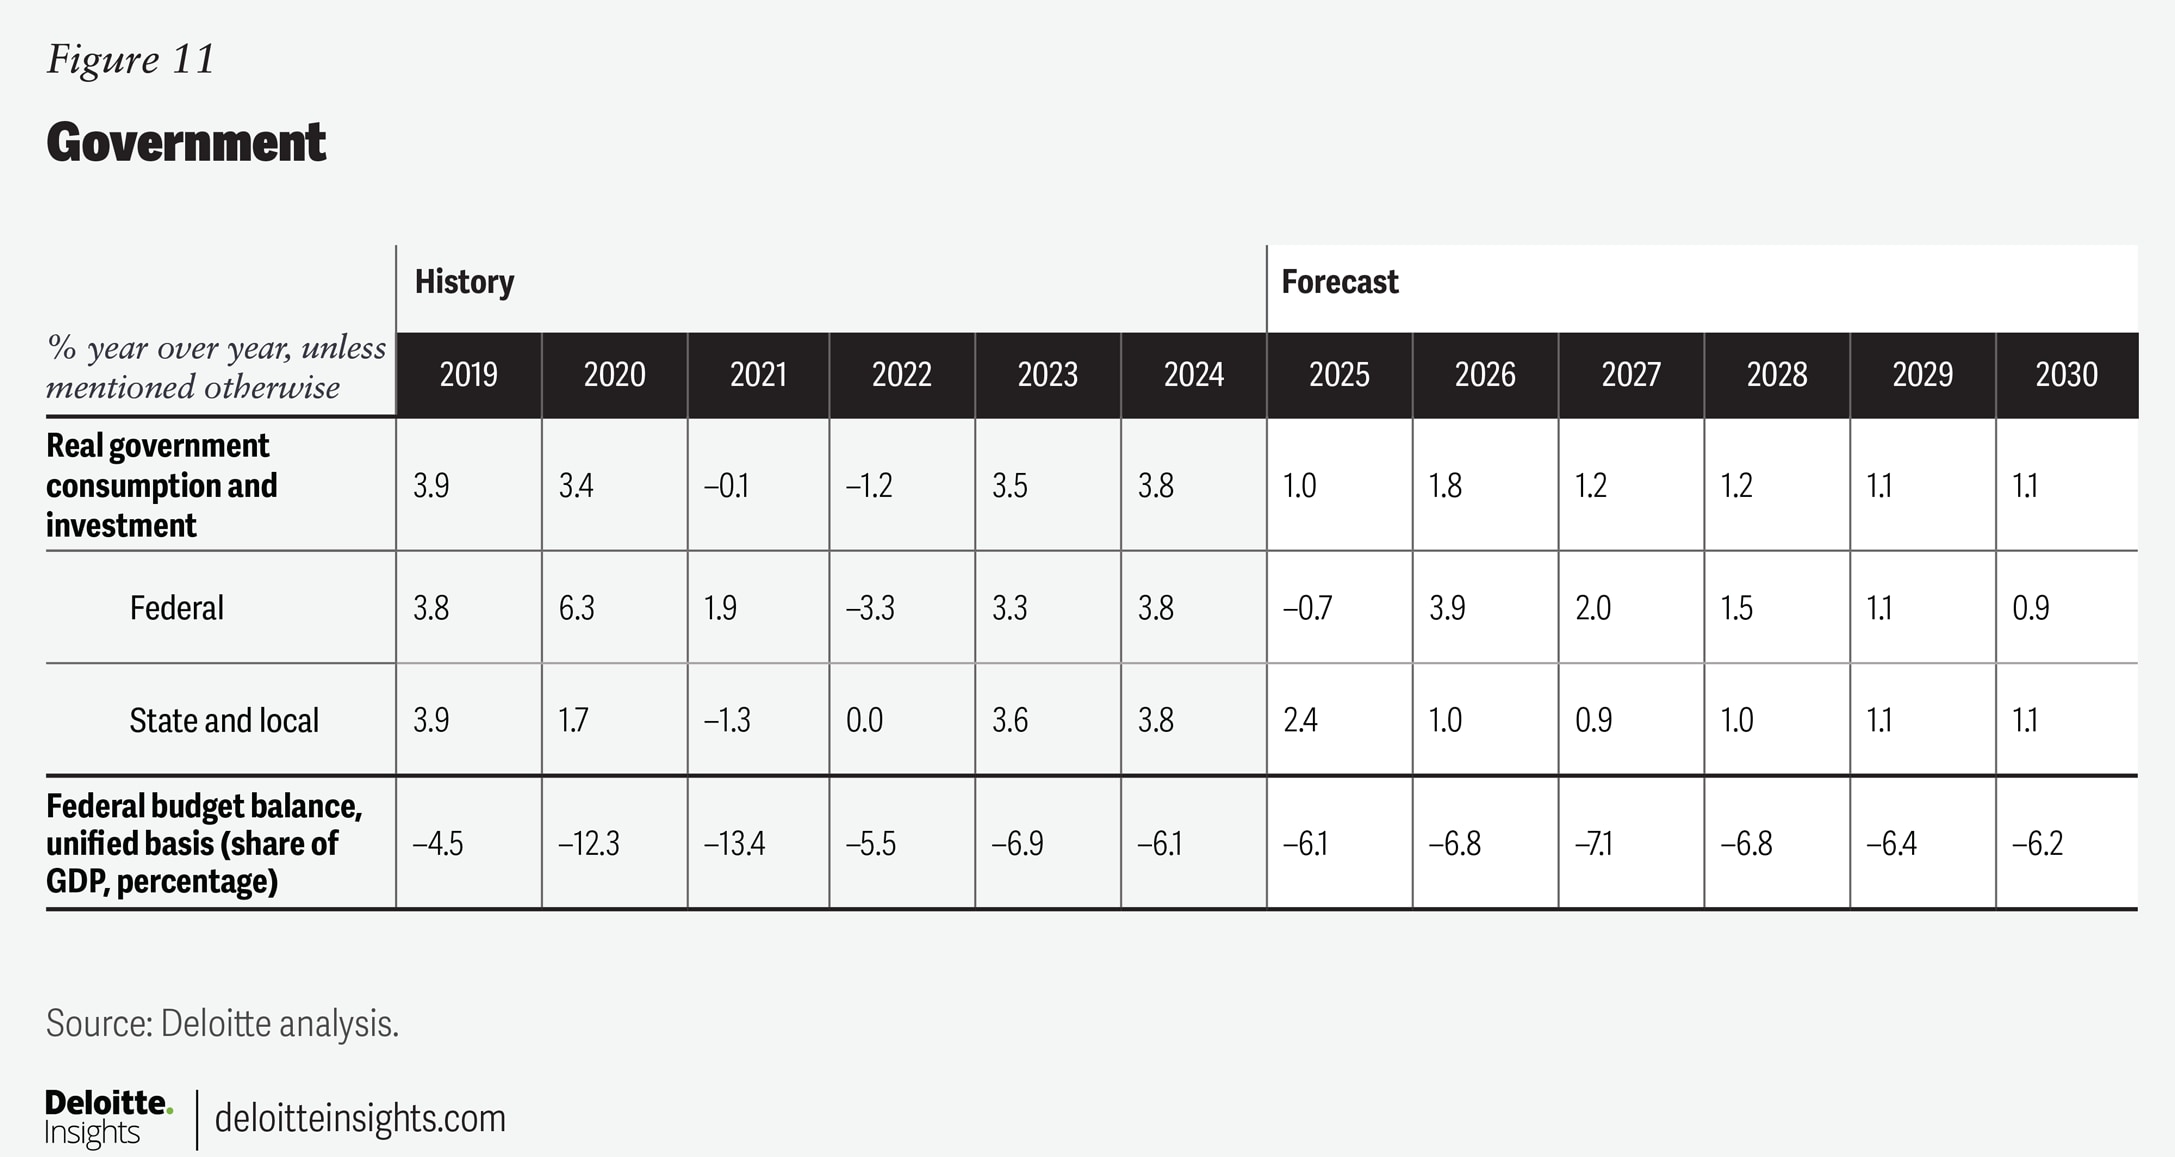
On the spending side, federal government employment has been declining since January 2025. We expect federal government employment to remain below its previous peak for the duration of the forecast. Incorporating all these factors plus debt service costs and economic effects, we find that the federal budget deficit will rise to 7.1% of GDP in 2027 from 6.1% in 2025. The deficit will narrow to 6.2% by 2030 (figures 10 and 11).
Labor market
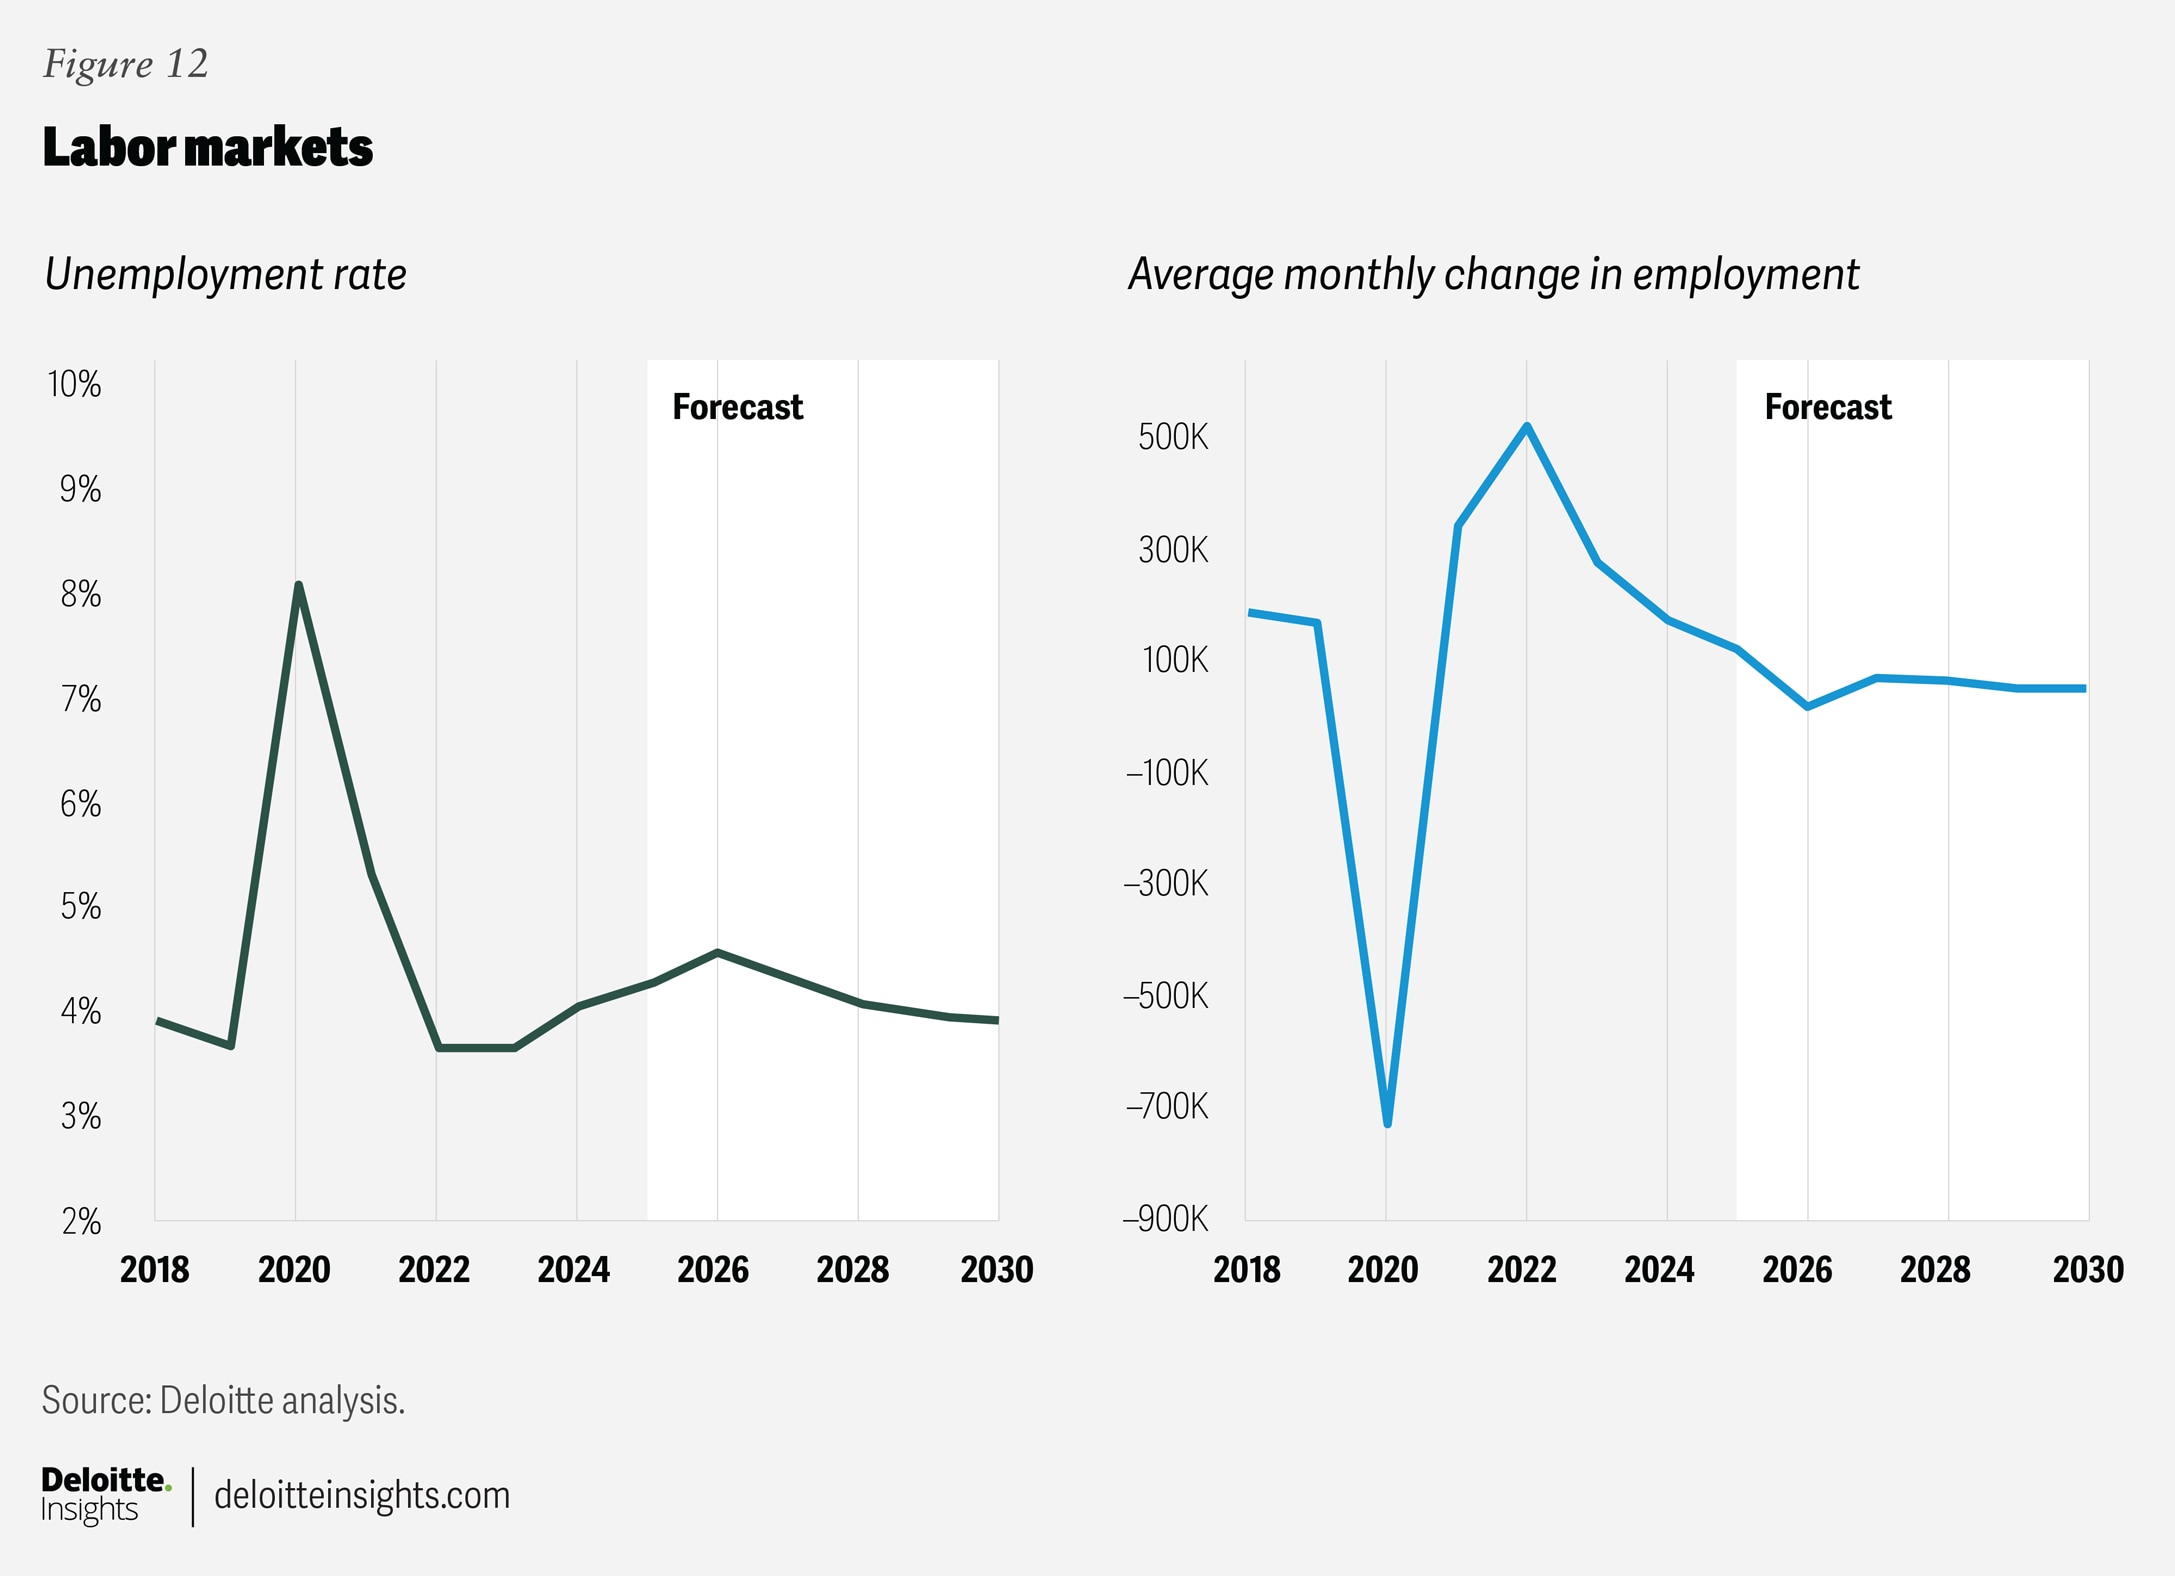
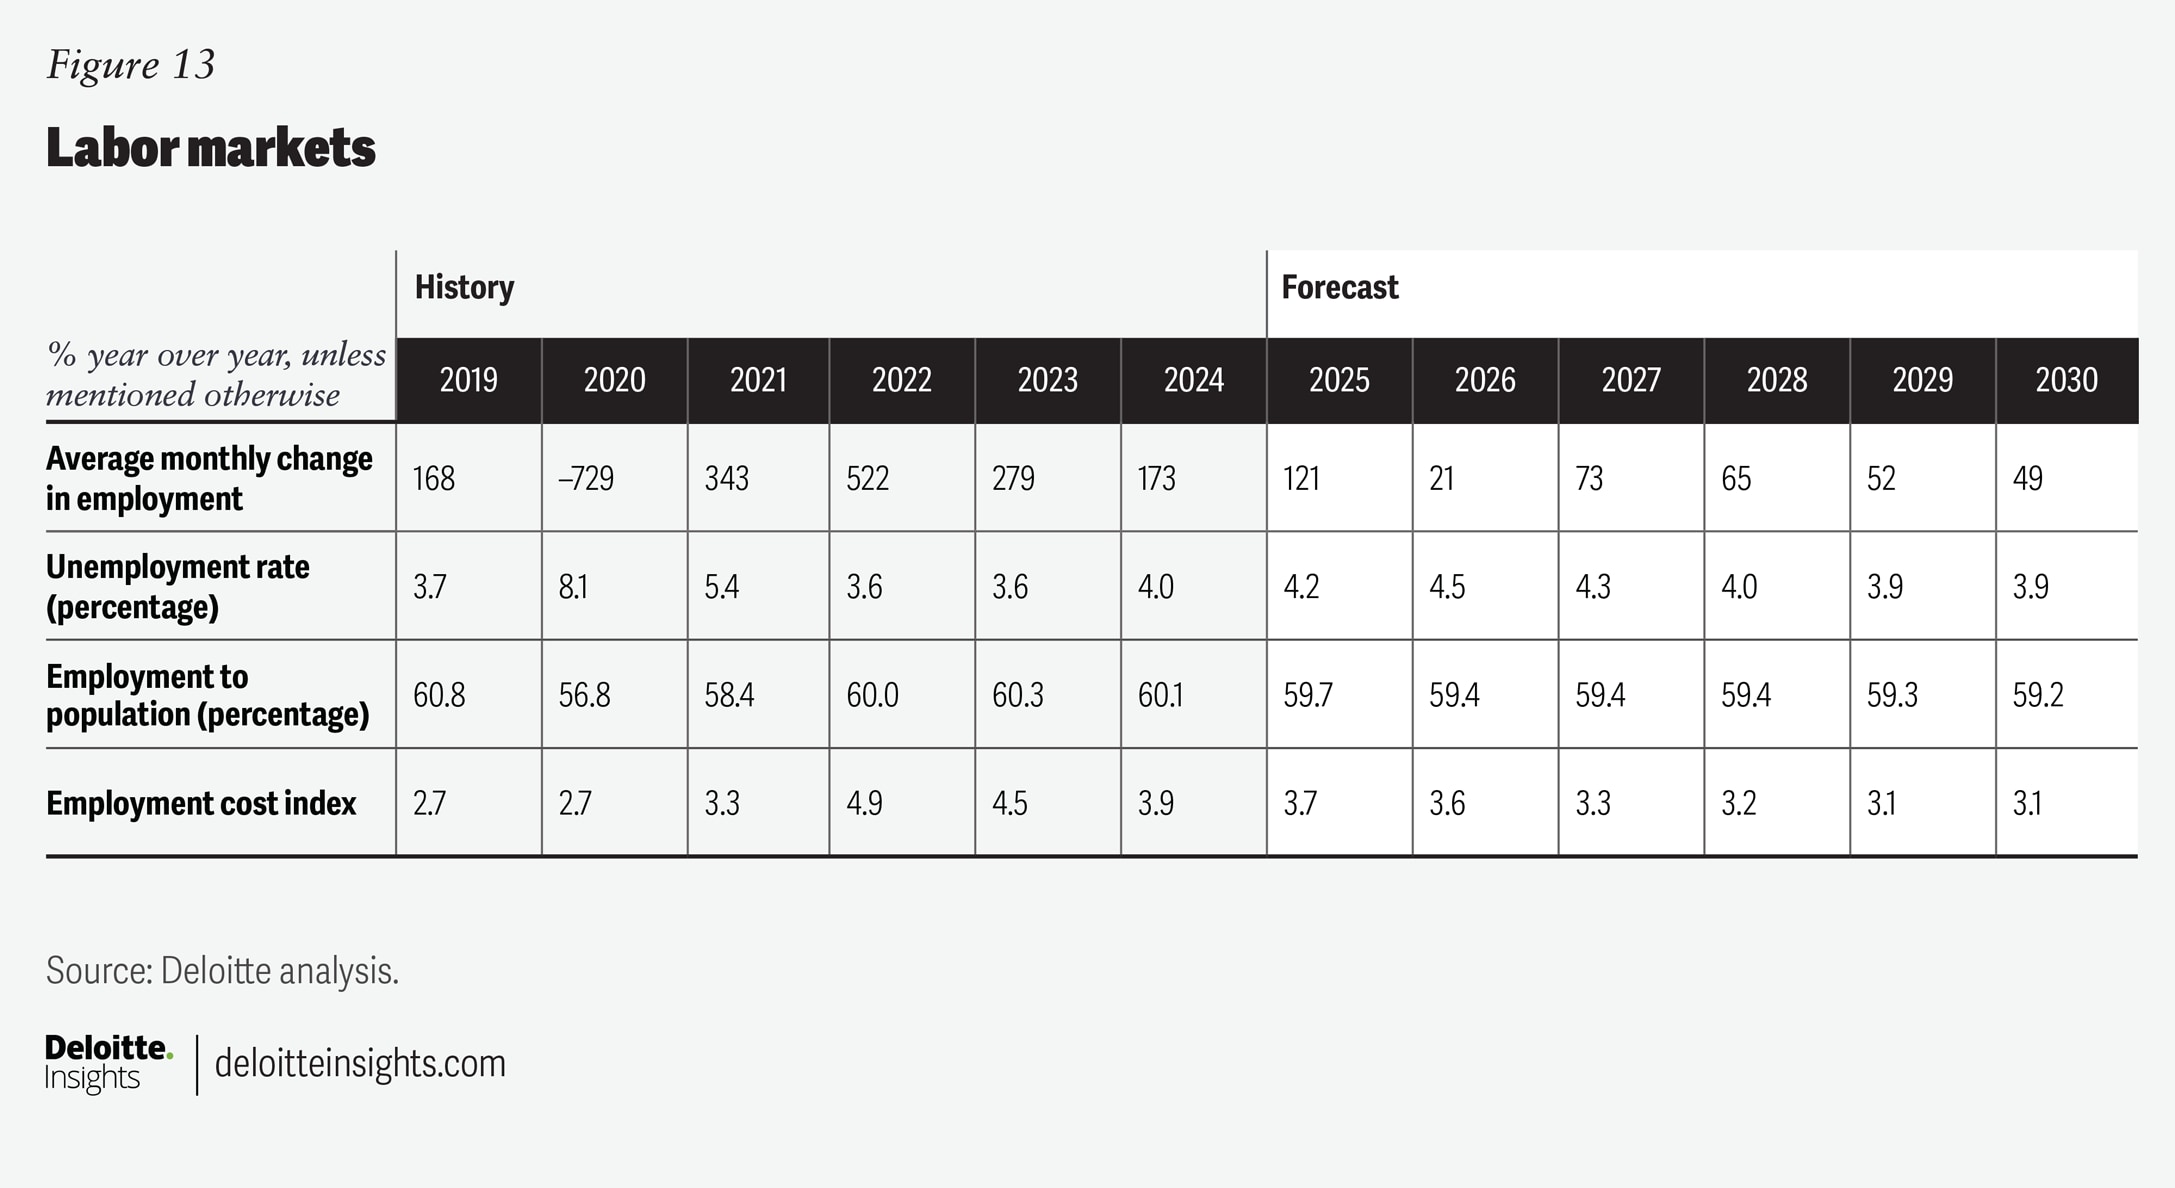
The labor market has weakened since April. Average monthly nonfarm payroll gains were 22,000 during the three months to November, far below the average gain of 168,000 in 2024. Most of the recent payroll gains have been concentrated in health care and social assistance. The unemployment rate also increased to 4.6% in November from an average of 4.1% in the first half of the year.
Given the recent data that shows immigration has experienced a significant decline this year, we have adjusted demographics accordingly. For example, we now assume that net migration amounts to just 3.3 million adults through 2030, down from 6.8 million estimated by the CBO in January. Our baseline estimates for net migration are merely estimates. The latest immigration data is yet to be available, and we recognize that immigration patterns could change substantially over the next five years.
The effects on the economy accumulate over time. Historically, new migrants take time to join the labor force, so previous waves of immigration support labor force growth in subsequent years, helping to offset the effects of lower net migration in the near term. Weaker labor force growth lowers employment growth and the labor force participation rate. The participation rate slips a little because immigrants typically have higher participation rates than their native-born counterparts. However, this also pushes the unemployment rate slightly lower than the counterfactual despite weaker overall employment growth.
We expect job growth to turn modestly negative through the first quarter of 2026 as high tariffs, weaker immigration, and elevated interest rates restrain demand for labor. Federal government employment is projected to see the sharpest drop in growth, but private sector employment growth is also expected to moderate into next year. We expect the unemployment rate to average 4.5% in 2026 before declining toward 3.9% in 2030 (figures 12 and 13).
Financial markets
Stock markets have shown considerable strength15 despite the headwinds to economic growth. Equity prices initially plummeted when “reciprocal tariffs” were announced on April 2. However, since then, stock prices have rebounded strongly. As of this writing, the S&P 500 stock price index was more than 12% higher than a year earlier.
While equity markets have recovered, bond markets have been acting unusually. During financial market stress in April, the yield on US Treasury bonds increased and the value of the dollar fell. In the past, bond yields fell along with the value of the dollar. Since then, yields on longer-term Treasury bonds have remained elevated and the dollar has remained weak. In addition, the dollar had been expected to appreciate, as tariffs were implemented, making the recent downturn in the dollar particularly unusual.
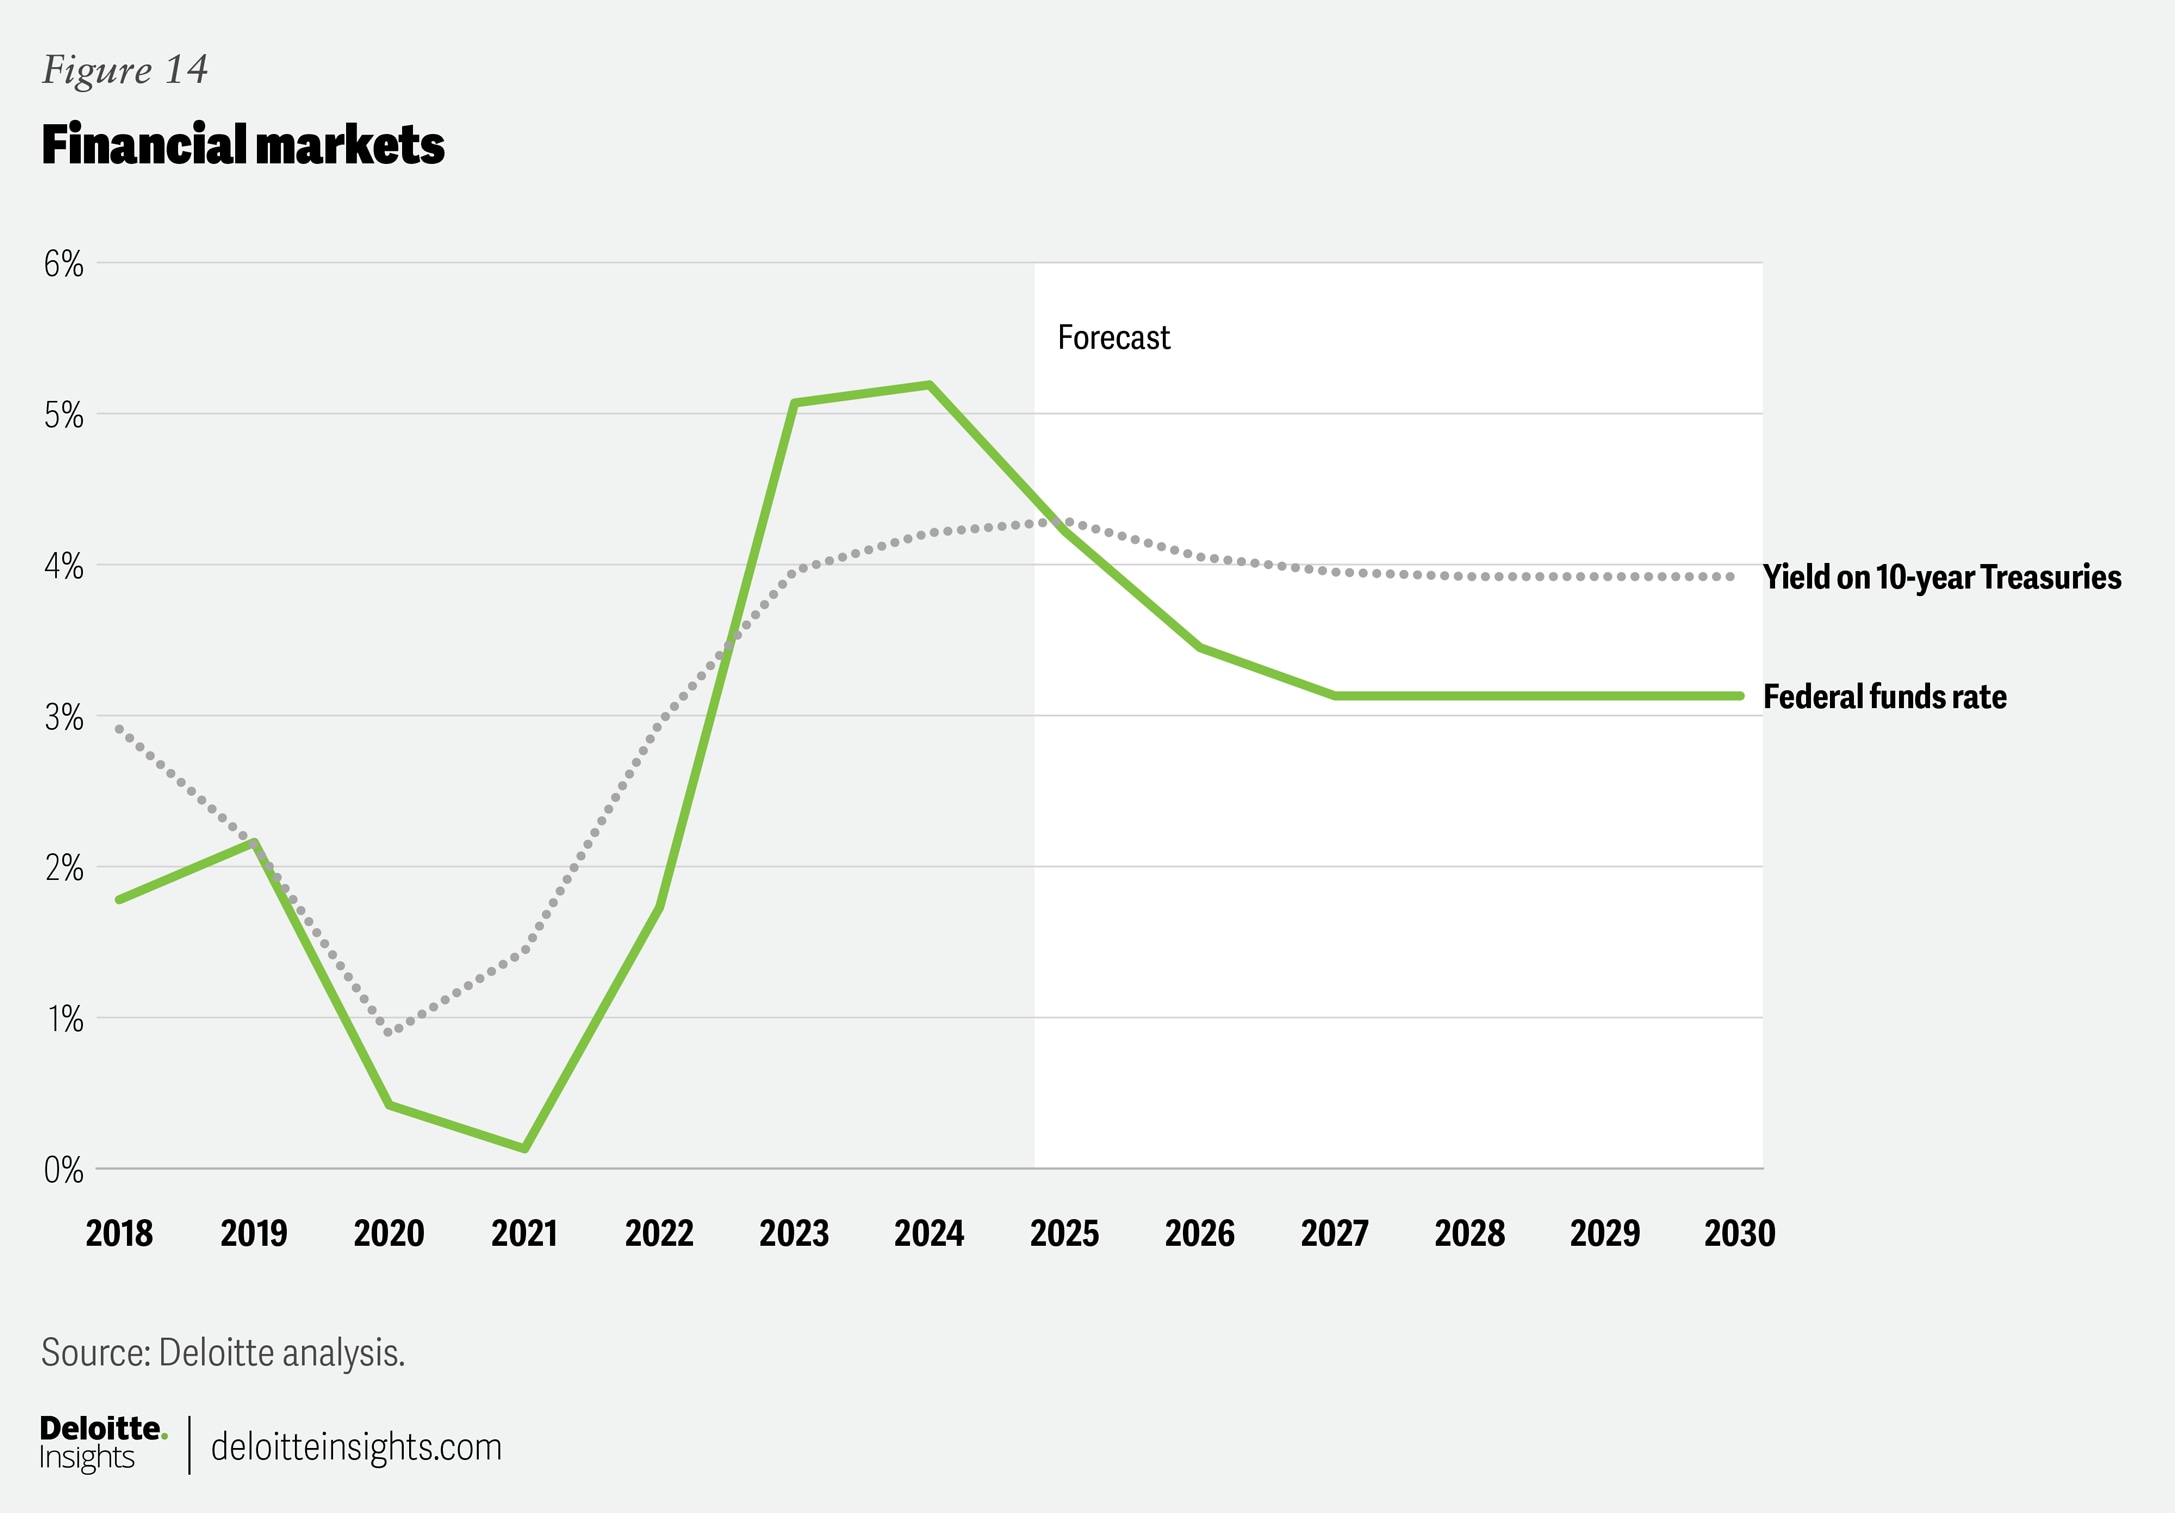
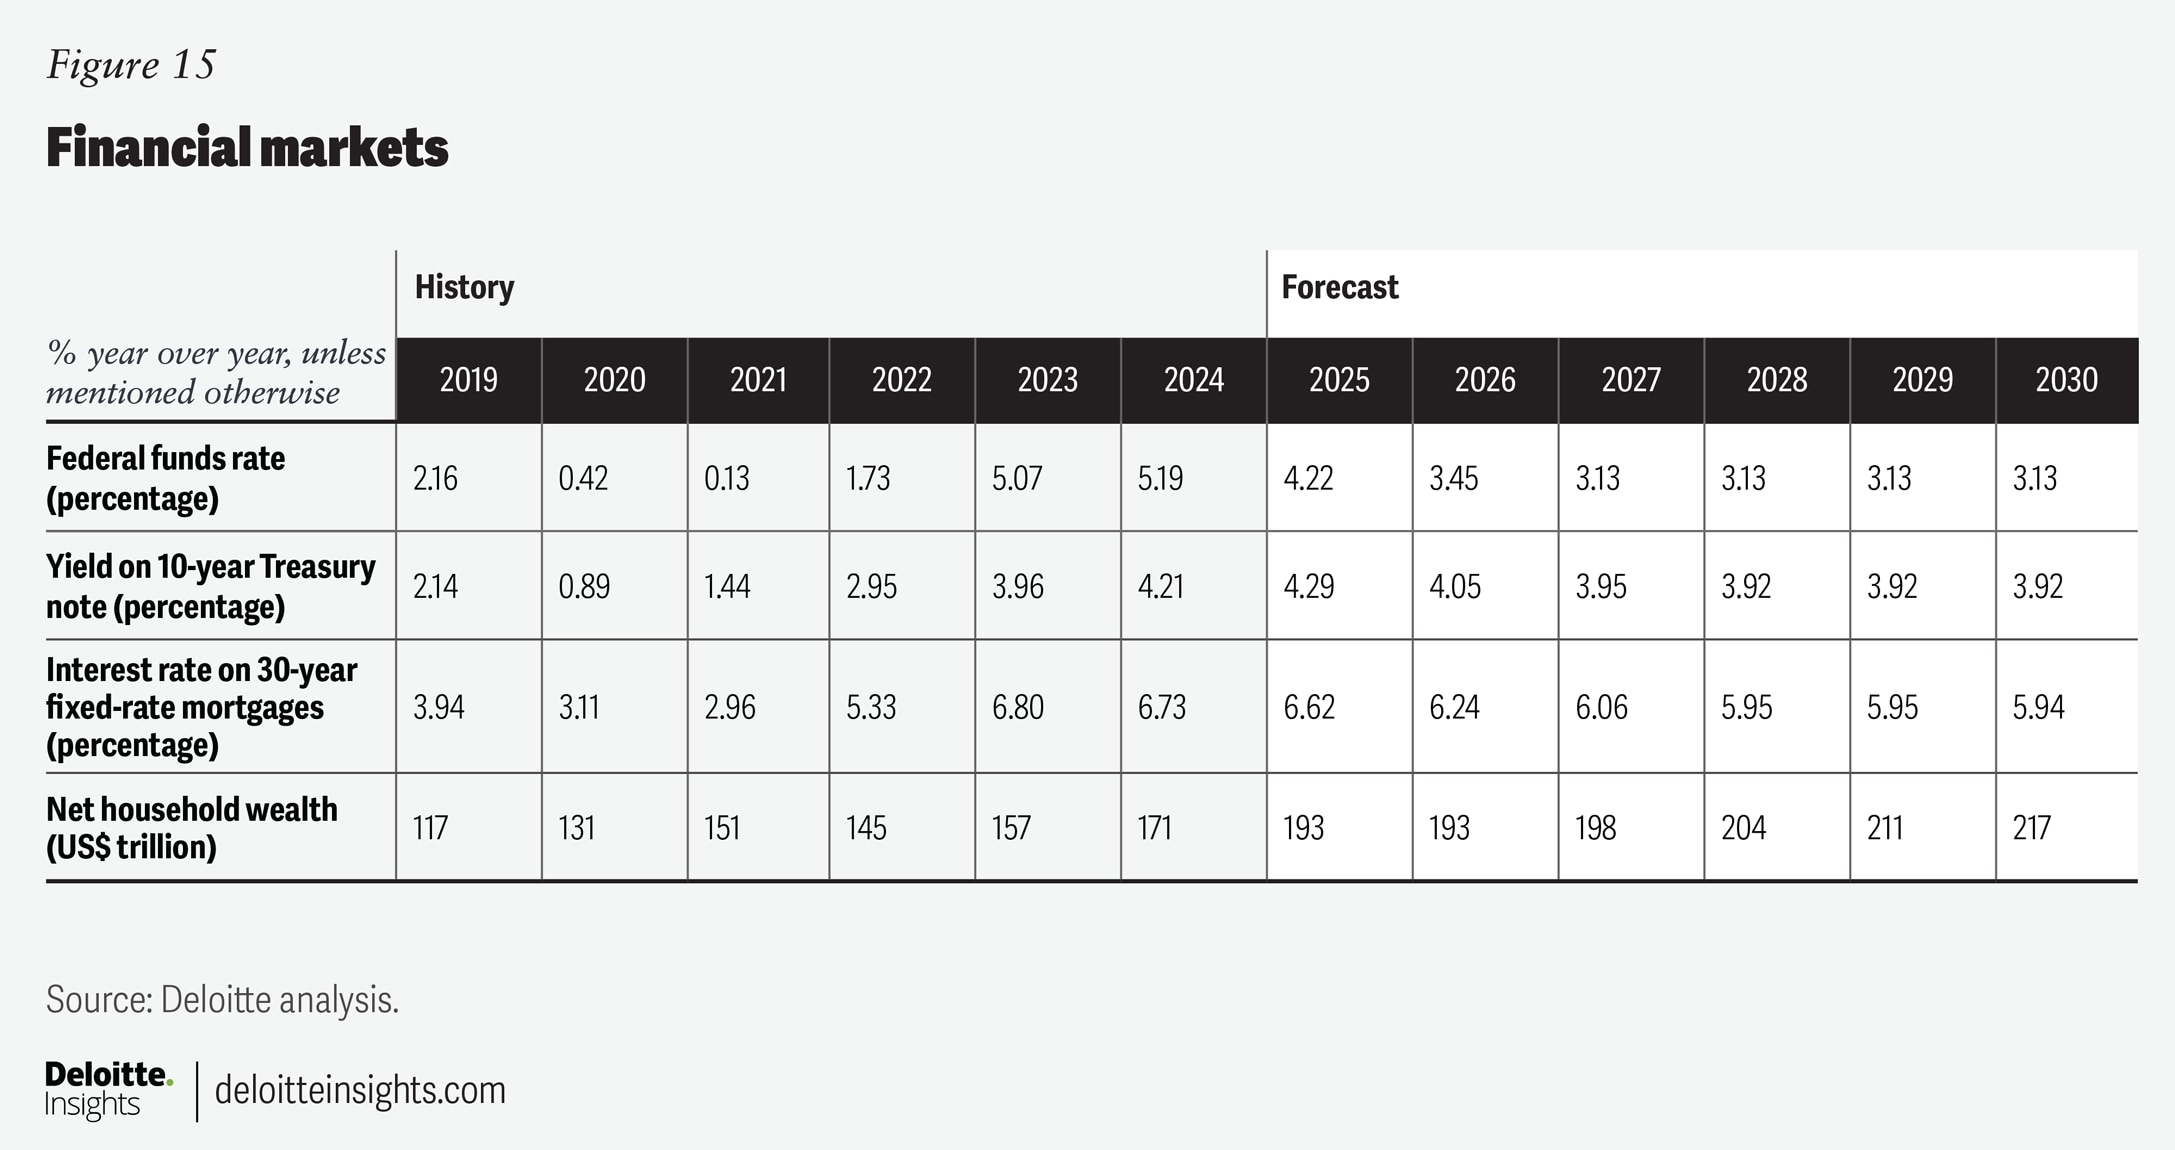
In our baseline forecast, we maintain a relatively high 10-year Treasury yield. However, we assume it remains around 4.1% through the end of this year. Although we anticipate short-term interest rates to decline in the next couple of years, long-term interest rates are expected to remain elevated. Notably, we expect the 10-year Treasury yield to remain above 3.9% through 2030.
Since the FOMC began its rate-cutting cycle, it cut rates by 150 bps, bringing the Fed’s target range to between 3.5% and 3.75%. However, policymakers are now entering a period of complex choices on interest rates. In our baseline scenario, we think the Fed waits until the second quarter of 2026 to make its next rate cut. Since inflation is now expected to accelerate more gradually but over a longer time horizon, we expect the FOMC to cut rates only twice in 2026 (figures 14 and 15).
Prices
Headline inflation has started to ease, with year-on-year consumer price index (CPI) inflation in November reaching 2.7%, the highest reading since January 2025. Core inflation, which excludes food and energy prices, has also moderated. For example, core CPI inflation was 2.6% in November. The Fed likely sees some of the inflationary impulse to be temporary and related to tariffs, which will allow it to cut interest rates even as inflation remains above the Fed's 2% target.
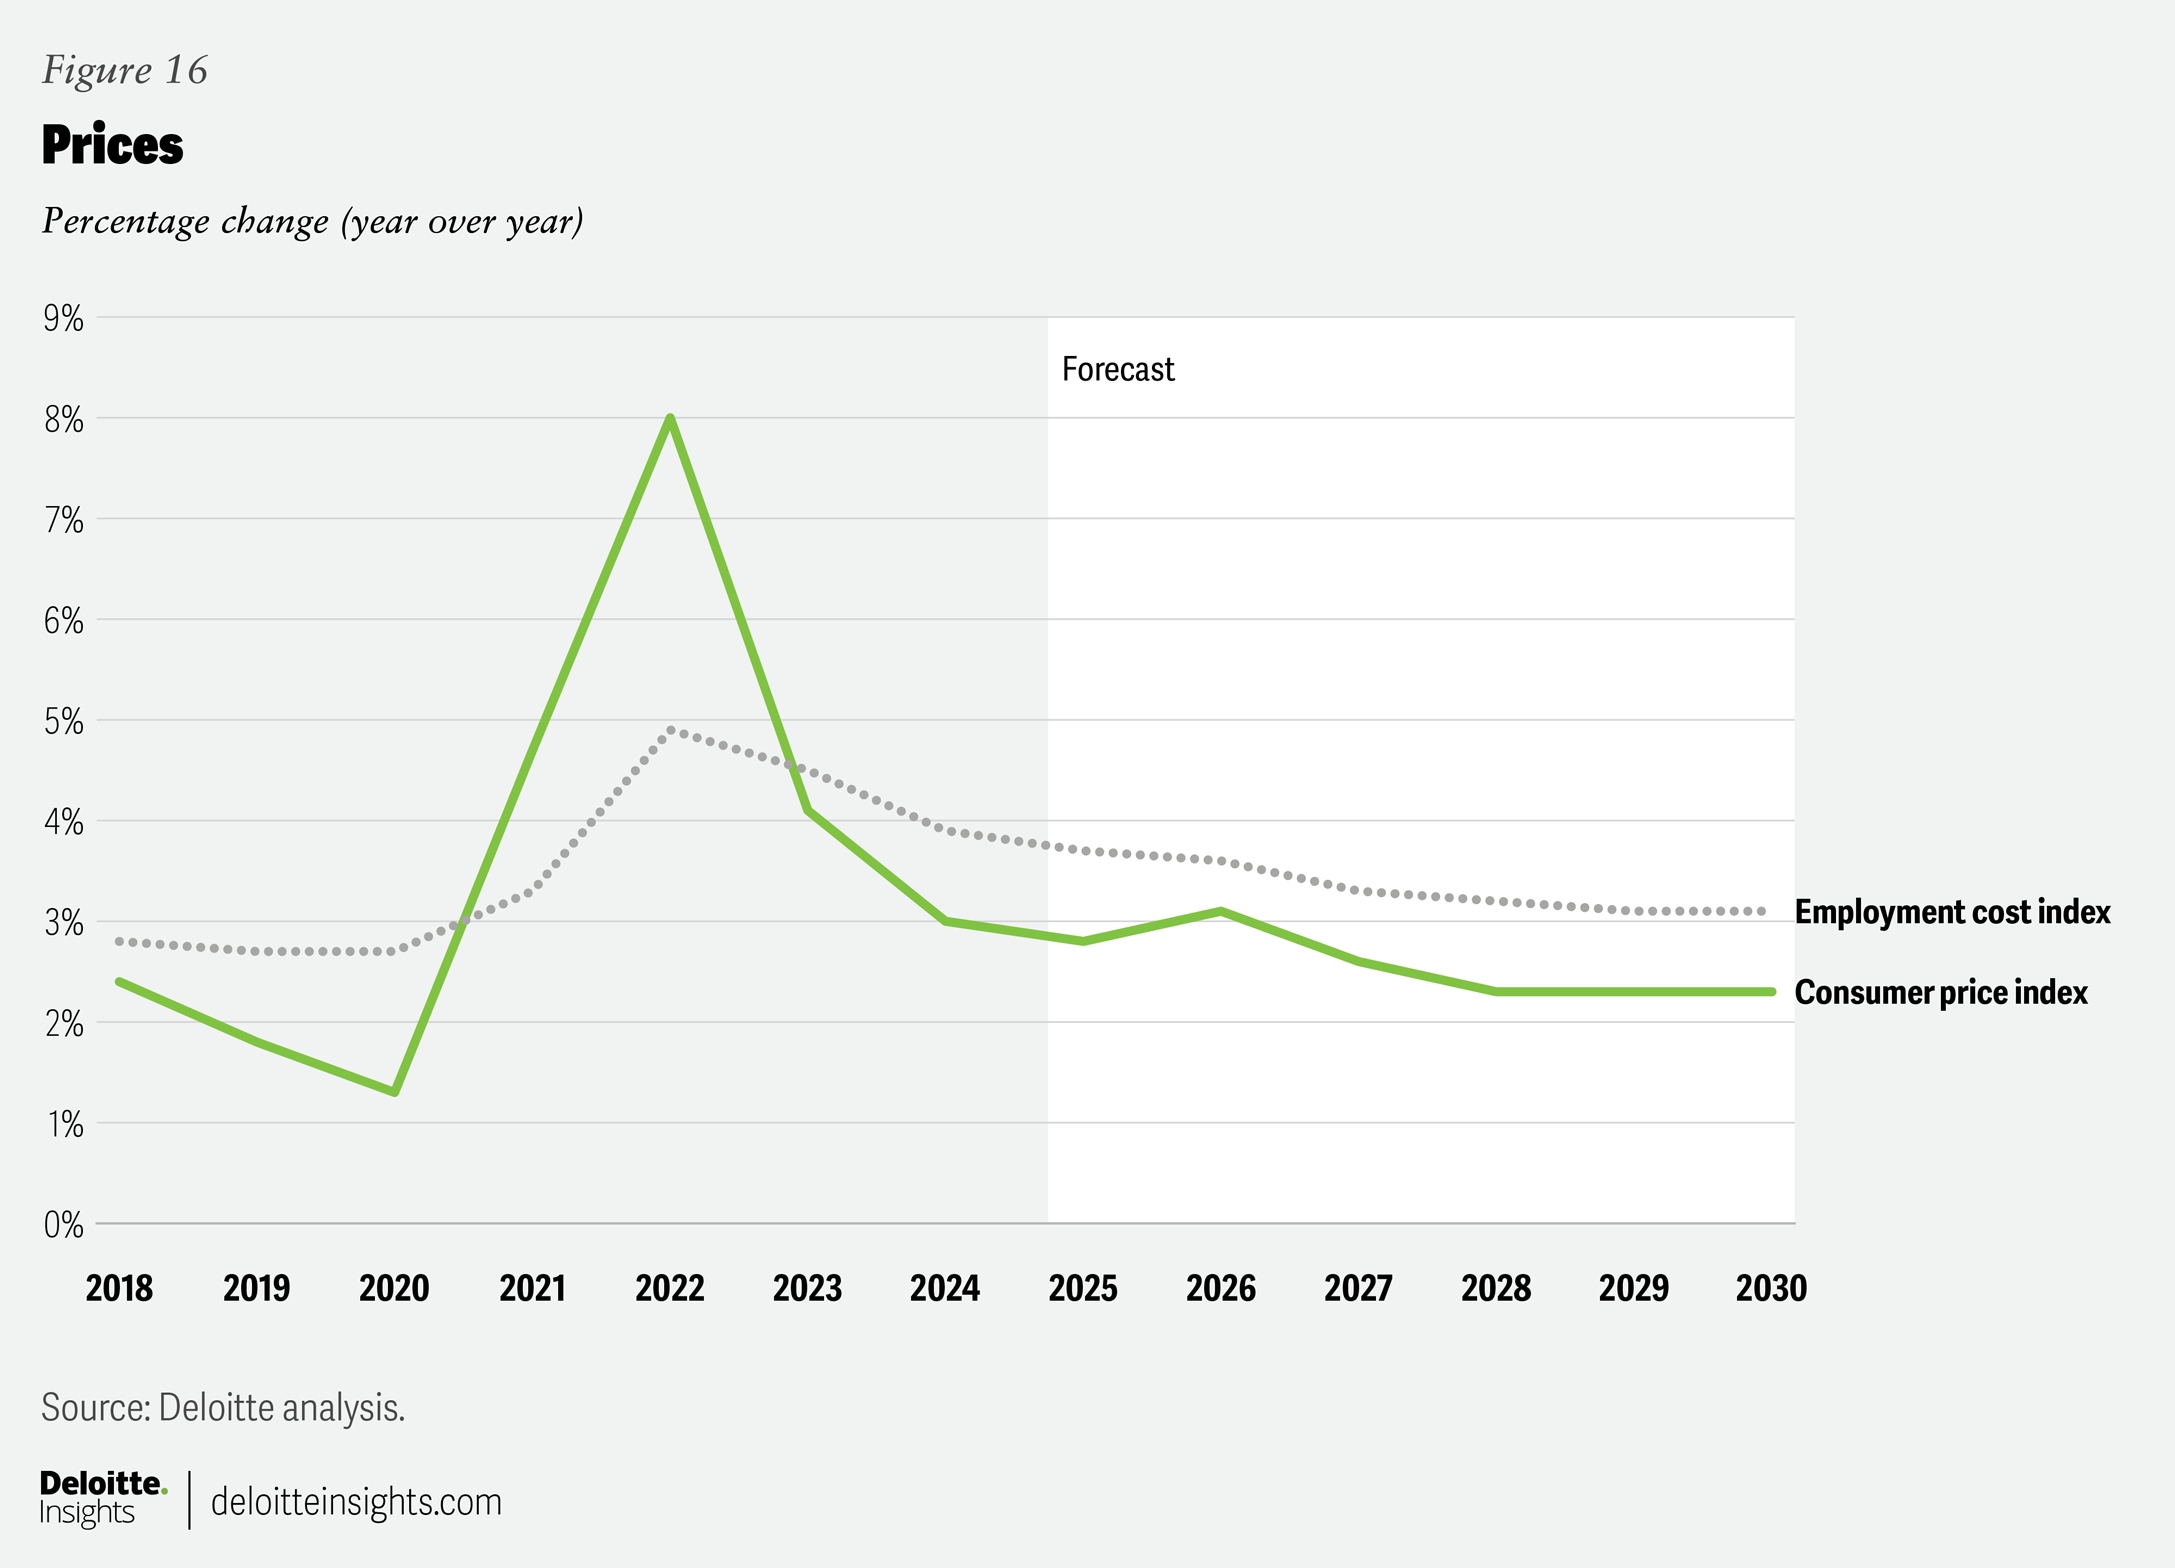
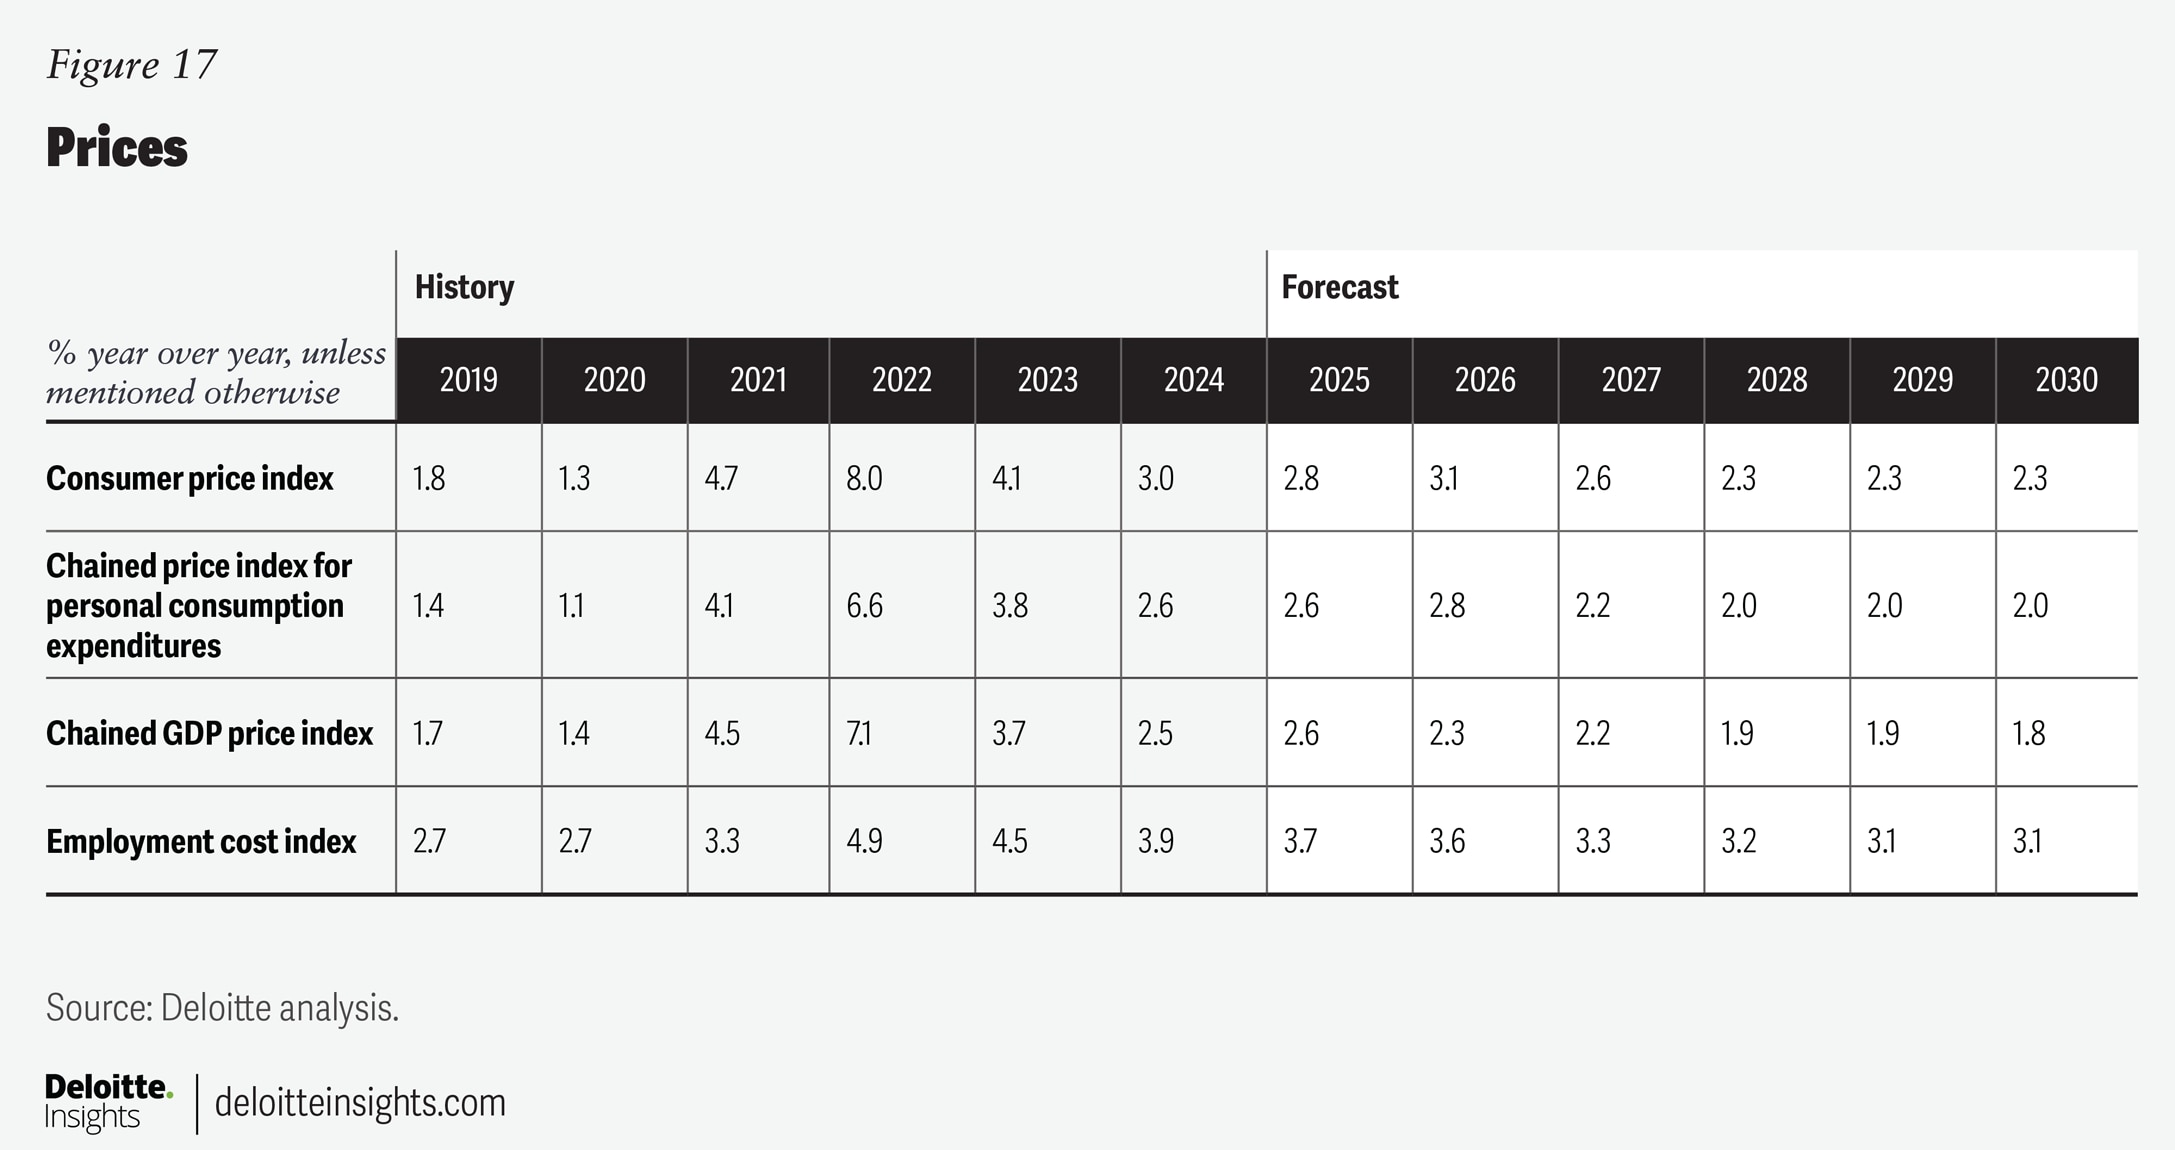
The outlook for inflation remains highly uncertain and depends heavily on how much of the tariff cost is passed on to consumers. We assume that about 60% of the tariff cost is passed on to consumers, which is at the lower end of estimates. We expect CPI growth to average 2.8% in 2025 and accelerate modestly to 3.1% in 2026. Thereafter, inflation is expected to moderate to about 2.3% in 2028 where it is expected to remain through the end of the forecast.
In addition to the inflationary impulse from tariffs, inflation expectations could also push inflation higher. Tariffs should amount to a one-time upward price adjustment rather than enduring inflation. However, if inflation expectations move higher, then inflation could become more entrenched. In November, the New York Fed’s survey of consumer expectations revealed a median one-year ahead expected inflation rate of 3.2%. That was down from 3.6% in April, but up slightly from 3% in January. Other measures have seen more extreme upward movement in inflation expectations. For example, in the University of Michigan’s May survey, one-year ahead inflation expectations were 4.1% in December, up significantly from 3.3% in January.
Appendix
